. 2023 Sep 5;120(36):e2308972120.
doi: 10.1073/pnas.2308972120. Epub 2023 Aug 28.

Compass-like manipulation of electronic nematicity in Sr3Ru2O7

Affiliations

Compass-like manipulation of electronic nematicity in Sr3Ru2O7

Masahiro Naritsuka et al. Proc Natl Acad Sci U S A. .

Abstract

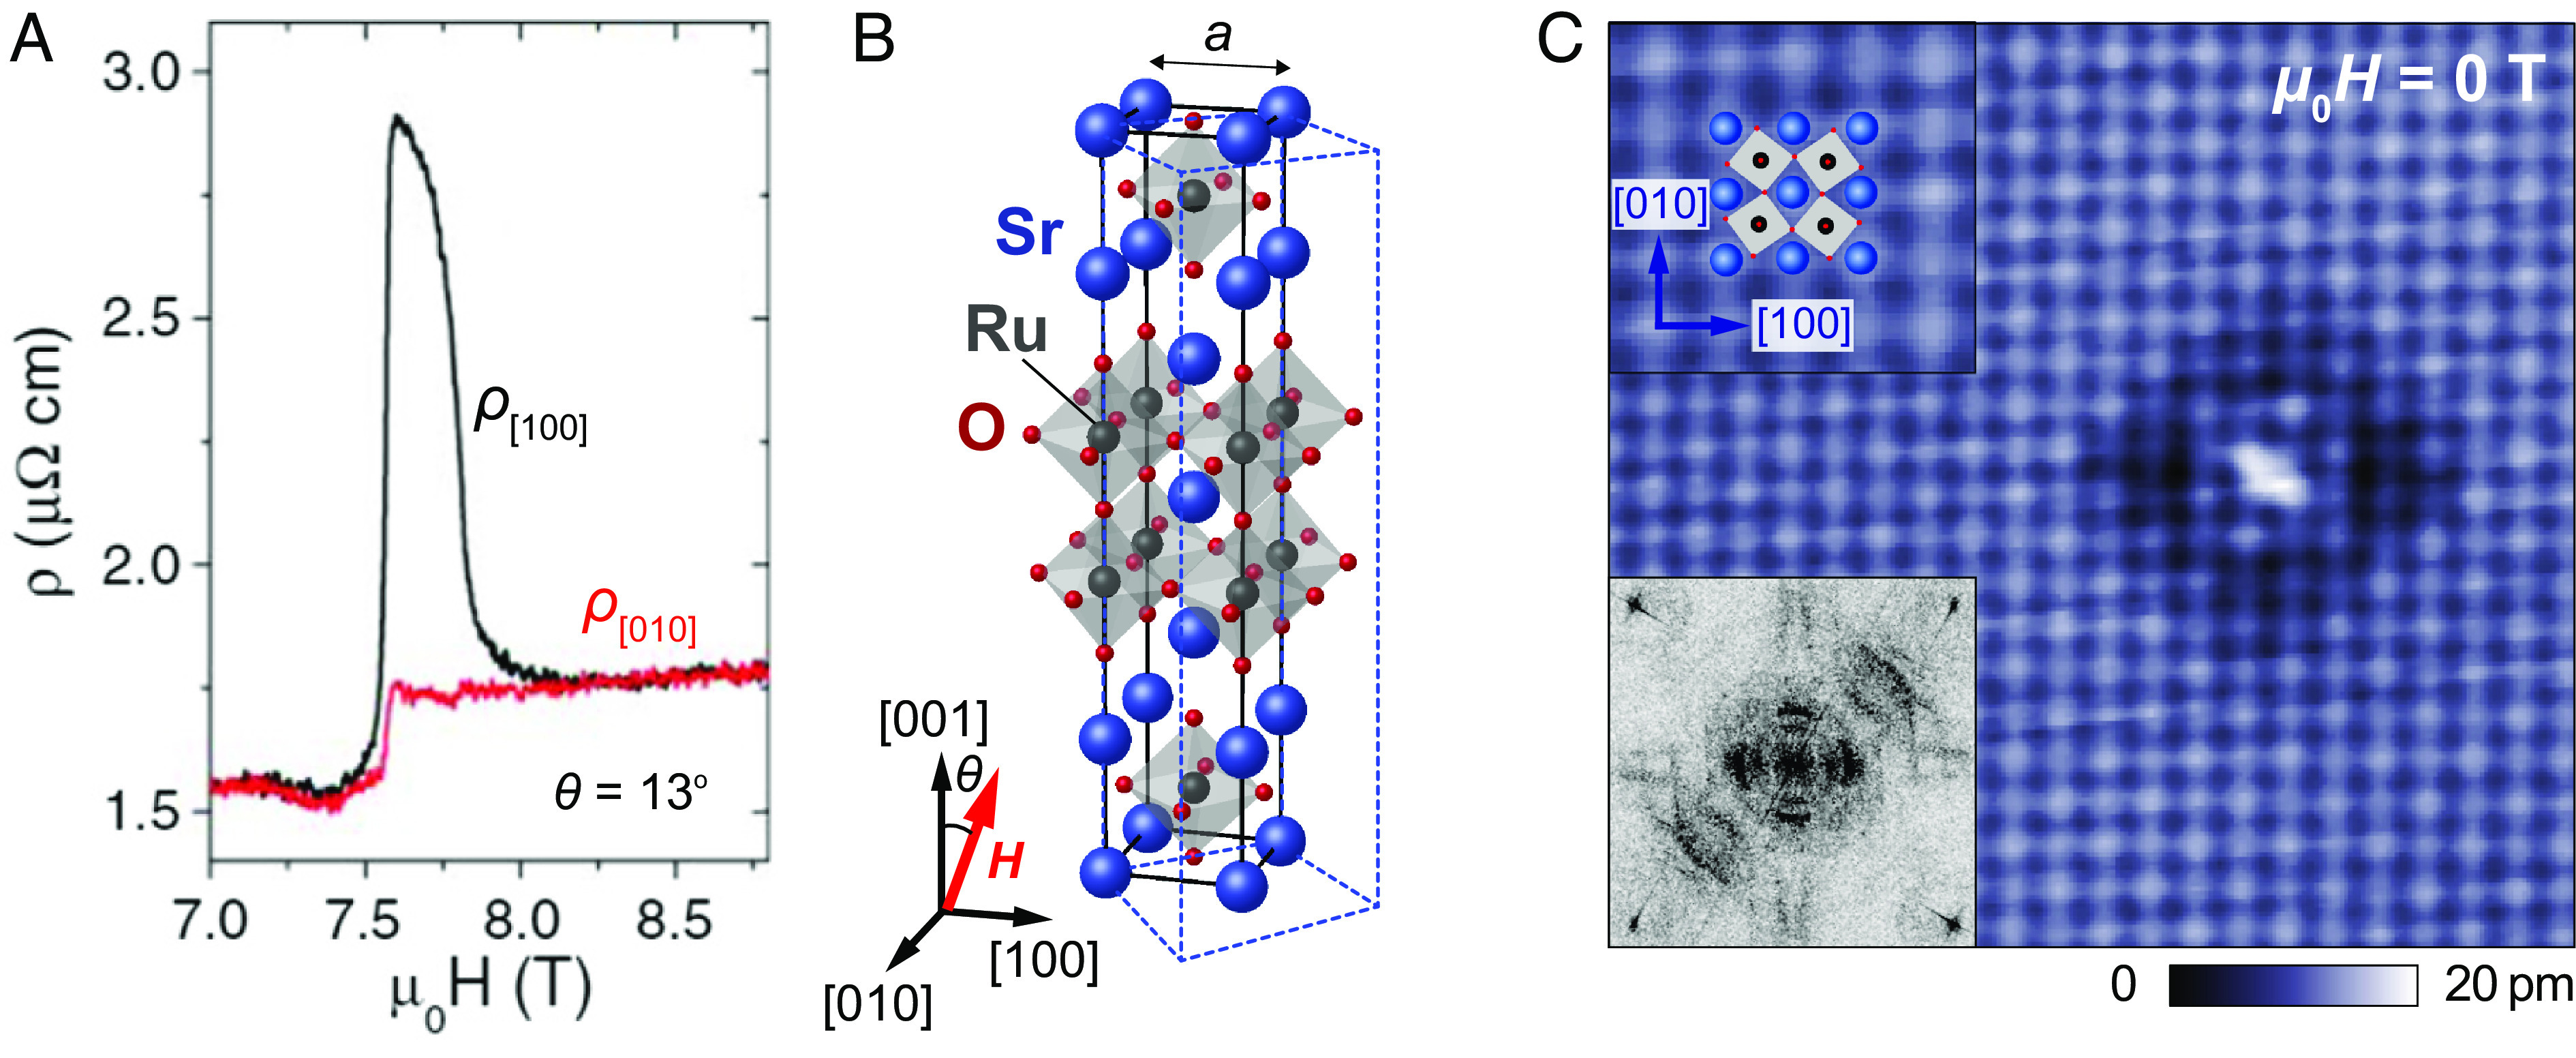
Electronic nematicity has been found in a wide range of strongly correlated electron materials, resulting in the electronic states having-4.5pc]Please note that the spelling of the following author name(s) in the manuscript differs from the spelling provided in the article metadata: Izidor Benedičič. The spelling provided in the manuscript has been retained; please confirm. a symmetry that is lower than that of the crystal that hosts them. One of the most astonishing examples is [Formula: see text], in which a small in-plane component of a magnetic field induces significant resistivity anisotropy. The direction of this anisotropy follows the direction of the in-plane field. The microscopic origin of this field-induced nematicity has been a long-standing puzzle, with recent experiments suggesting a field-induced spin density wave driving the anisotropy. Here, we report spectroscopic imaging of a field-controlled anisotropy of the electronic structure at the surface of [Formula: see text]. We track the electronic structure as a function of the direction of the field, revealing a continuous change with the angle. This continuous evolution suggests a mechanism based on spin-orbit coupling resulting in compass-like control of the electronic bands. The anisotropy of the electronic structure persists to temperatures about an order of magnitude higher compared to the bulk, demonstrating novel routes to stabilize such phases over a wider temperature range.

Keywords: magnetism; nematicity; scanning tunneling microscopy; spin–orbit coupling; strongly correlated electron materials.


Conflict of interest statement

The authors declare no competing interest.

Figures

Fig. 1.
Fig. 1.
Electronic nematicity in Sr3Ru2O7. (A) Close to the metamagnetic critical point at μ0H7.8T, applying a field with a small in-plane component Hab[100] (or, equivalently, [010]) induces a large anisotropy in the resistivity. Figure adapted from ref. . (B) Crystal structure of Sr3Ru2O7 with the tetragonal unit cell (black lines) in side view (Blue spheres: Sr, black: Ru, red: O). Due to the octahedral rotations, the true unit cell is orthorhombic (blue dotted lines). (C) Topographic STM image showing the Sr square lattice and a twofold symmetric quasiparticle interference pattern around a defect. Top Left inset shows an enlarged image of the topography with the top view of the crystal structure superimposed (Vs=10mV, Is=300pA). Bottom Left inset: Fourier transformation of a spectroscopic map acquired in zero magnetic field across similar defects in a larger area at V=0.3mV (T=80mK), showing the C4 symmetry breaking.
Fig. 2.
Fig. 2.
Field-control of nematicity. (AE) Topographic images around defects, A, at zero field with definition of the nematic order parameter Ψ, and, BE, in in-plane magnetic field |μ0H|=5T for field directions as indicated by the red arrow (Vs=15mV, Is=300pA, T=4.2K). (F) sketch of the crystal structure and definition of angle φ in which μ0H is applied relative to the crystallographic axes. (G and H) Dependence of nematic order parameter Ψ (extracted from the white rectangle in A) on the field angle φ as defined in F. Ψ shows sign reversal for φ=0°, 90°, 180°, and 270°, with maxima in |Ψ| when the field is along [110] and [1¯10], respectively (φ=45°, 135°, 225°, and 315°). (H) shows the same data as in G in a polar plot. The solid line shows a sine function as a guide to the eye. (I) colour plot of the real part of the Fourier transformation Re[z~(q)] of the topography. Red (blue) symbols indicate the same (opposite) phase relative to the topography at zero field. The Fourier peaks associated with a checkerboard modulation at qckb=(±1/2,±1/2) is indicated by a black circle. (J) the intensity of the Fourier peak at qckb (black circle in I) as a function of in-plane field direction φ. The checkerboard contrast is maximal for field along [100] or [010], showing a contrast reversal between the two directions. (K) same data as in J shown in a polar plot. Lines in G, H, and K are drawn as guides for the eye.
Fig. 3.
Fig. 3.
Relation of band structure and modulated density of states. Using a tight-binding description (Eq. 1), modeling the electronic structure of the top surface layer by a single layer of Sr2RuO4 including a magnetization M and spin-orbit coupling reproduces the key findings of Fig. 2. To model the influence of the magnetic field on the electronic structure, we assume that the magnetization M points in the direction of the applied field (red arrow), (A). As a consequence of spin–orbit coupling, the band structure obtained from the minimal model (for details see main text and Materials and Methods), (B), depends on the in-plane direction of the magnetization. For direct comparison with the experimental data, we calculate the real-space continuum local density of states (cLDOS), (C), for the in-plane magnetisation directions shown in A at energy E1 indicated by the orange horizontal line in B, showing symmetry breaking QPI patterns, with the symmetry breaking most obvious for φ=45° and 135°, as also seen in Fig. 2 C and E. (D) cLDOS for magnetization directions indicated in A at energy E2, green line in B, showing the appearance of a checkerboard for φ=0° and 90° as in Fig. 2 B and D.
Fig. 4.
Fig. 4.
Quasiparticle interference imaging. (AD) Fourier transform of dlnI/dlnV maps at different directions of the in-plane field H along [1¯10] (A), [010] (B), [110] (C) and [100] (D), shown at V=0.8mV (Vs=10mV, Is=100pA, T=4.2K, μ0H=5T, in-plane field direction is indicated by an arrow in each panel). (E) Difference of Fourier transforms of spectroscopic maps in A and C with magnetic field μ0H=5T applied in the orthorhombic directions (H [1¯10] and H[110]). (F) Same as E but for B and D with magnetic fields applied in the tetragonal directions (H[010] and H[100]).

References

    1. Y. Kohsaka et al., An intrinsic bond-centered electronic glass with unidirectional domains in underdoped cuprates. Science 315, 1380–1385 (2007). 10.1126/science.1138584. - DOI - PubMed
    1. T.-M. Chuang et al., Nematic electronic structure in the “parent” state of the iron-based superconductor Ca(Fe1xCox)2As2. Science 327, 181–184 (2010). 10.1126/science.1181083. - DOI - PubMed
    1. J.-H. Chu et al., In-plane resistivity anisotropy in an underdoped iron arsenide superconductor. Science 329, 824–826 (2010). 10.1126/science.1190482. - DOI - PubMed
    1. F. Ronning et al., Electronic in-plane symmetry breaking at field-tuned quantum criticality in CeRhIn5. Nature 548, 313–317 (2017). 10.1038/nature23315. - DOI - PubMed
    1. R. A. Borzi et al., Formation of a nematic fluid at high fields in Sr3Ru2O7. Science 315, 214–217 (2007). 10.1126/science.1134796. - DOI - PubMed