. 2023 Nov:71:100993.
doi: 10.1016/j.drup.2023.100993. Epub 2023 Aug 10.

H3K4me3 remodeling induced acquired resistance through O-GlcNAc transferase

Affiliations

H3K4me3 remodeling induced acquired resistance through O-GlcNAc transferase

Dinoop Ravindran Menon et al. Drug Resist Updat. 2023 Nov.

Abstract

Aims: Drivers of the drug tolerant proliferative persister (DTPP) state have not been well investigated. Histone H3 lysine-4 trimethylation (H3K4me3), an active histone mark, might enable slow cycling drug tolerant persisters (DTP) to regain proliferative capacity. This study aimed to determine H3K4me3 transcriptionally active sites identifying a key regulator of DTPPs.

Methods: Deploying a model of adaptive cancer drug tolerance, H3K4me3 ChIP-Seq data of DTPPs guided identification of top transcription factor binding motifs. These suggested involvement of O-linked N-acetylglucosamine transferase (OGT), which was confirmed by metabolomics analysis and biochemical assays. OGT impact on DTPPs and adaptive resistance was explored in vitro and in vivo.

Results: H3K4me3 remodeling was widespread in CPG island regions and DNA binding motifs associated with O-GlcNAc marked chromatin. Accordingly, we observed an upregulation of OGT, O-GlcNAc and its binding partner TET1 in chronically treated cancer cells. Inhibition of OGT led to loss of H3K4me3 and downregulation of genes contributing to drug resistance. Genetic ablation of OGT prevented acquired drug resistance in in vivo models. Upstream of OGT, we identified AMPK as an actionable target. AMPK activation by acetyl salicylic acid downregulated OGT with similar effects on delaying acquired resistance.

Conclusion: Our findings uncover a fundamental mechanism of adaptive drug resistance that governs cancer cell reprogramming towards acquired drug resistance, a process that can be exploited to improve response duration and patient outcomes.

Keywords: Acquired drug resistance; Adaptive cancer drug resistance; Cancer persisters; Cellular reprogramming; Epigenetics; H3K4me3; Metabolism; OGT; TET1.


Conflict of interest statement

Declaration of Competing Interest The authors declare that they have no competing financial interests or personal relationships that influence the work reported in this paper.

Figures
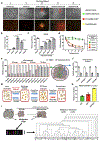
Fig. 1.
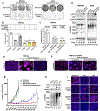
Fig. 1.. Transient cell states precede the development of multi-clonal acquired drug resistance.
a, Representative bright field or combined fluorescence images (n ≥ 3 independent experiments) of FUCCI-WM164 cells exposed to dabrafenib 50 nM for the indicated time frames. mKO2-hCdt1 (red) indicates G1 phase, mAG-hGem (green) indicates G2/M and mKO2-mAG (yellow) indicates early S phase. Red arrows indicate re-proliferative cell clusters (IDTC colonies) that escape the drug-induced slow-cycling state. b, Number of IDTC colonies at indicated time points during chronic exposure of WM164 cells to dabrafenib 50 nM (n = 3), P-Values were calculated using one-way ANOVA, * ** P ≤ 0.001, * * P ≤ 0.01, data are represented as mean ± SD. c, Relative growth rate at indicated time points during chronic exposure of WM164 cells to dabrafenib 50 nM measured by MTT assay (n = 3). P-Values were calculated using one-way ANOVA, * ** P ≤ 0.001, * * P ≤ 0.01, data are represented as mean ± SD. d, Re-treatment response of WM164 cells to indicated concentrations of dabrafenib (72 h treatment) subjected to 21 days of drug holiday after chronic exposure to dabrafenib 50 nM for the indicated time measured by MTT assay. P-Values were calculated using two-way ANOVA, * ** P ≤ 0.001. e and f, Re-treatment response of isolated IDTC colonies (e) or slow-cycling (f) WM164 cells to indicated concentrations of dabrafenib (72 h treatment) subjected to 21 days of drug holiday after chronic exposure to dabrafenib 50 nM for the indicated time measured by MTT assay (n = 3). Data are represented as mean ± SD. g, Model of reversibility of phenotypic transitions during chronic drug exposure. h, Number of IDTC colonies in a co-culture of GFP-positive and RFP-positive WM164 cells in a 1:1 ratio following 45 days of exposure to dabrafenib 50 nM that are either GFP-positive, RFP-positive, or double-positive (n = 2). Data are represented as mean ± SD. i, Phylogenetic tree of individual parental cells (n = 19, bold) and cells isolated from IDTC colonies after 75 days of exposure to dabrafenib 50 nM (n = 29), generated by analyzing chromosomal re-arrangements using whole chromosome FISH.
Fig. 2.
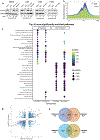
Fig. 2.. H3K4me3 remodeling during the development of permanent acquired drug resistance.
a, Immunoblotting of H3K4me3 at the individual cell states in WM164, A375, A549 and H1975 cells. Histone 3 were used as loading control. Representative images of independent experiments are shown (n ≥ 2). b, Global H3K4me3 ChIP-seq profiles of parent, IDTC colony and resistant cells, replicates (all n = 2) were combined for visualization. c, Over-representation analysis of genes annotated to significantly (FDR<5%) differentially marked proximal H3K4me3 peaks against Reactome pathways database of parent compared to IDTC colony or resistant. The top 10 most significantly enriched pathways are shown. d, Scatter plot showing log2 fold change of differentially marked proximal H3K4me3 peaks (colony vs parental) as determined by ChIP-seq and mRNA expression levels of differentially expressed genes (colony vs parental) as determined by microarray. Shown are all genes that were significantly differentially expressed (p ≤ 0.05, absolute log2FC ≥ 0.5) in both datasets. The slope is indicated by the red line. e, Venn diagrams comparing annotated genes with increased (upper panel) and decreased (lower panel) H3K4me3 in IDTC colony (Col) compared to parent (P) and resistant (R) compared to parent (P).
Fig. 3.
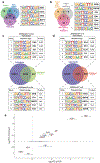
Fig. 3.. Therapy induced H3K4me3 remodeling preferentially occurs at CpG island motifs.
a and b, Transcription factor binding motifs of proximal H3K4me3 peaks identified in IDTC colony and resistant cells (a) or significantly (FDR<5%) differentially marked proximal H3K4me3 peaks of all conditions (b). Top 20 most significantly discovered motifs were compared and commonly found sequence logos are shown. c and d, Venn diagram comparing annotated CpG islands from the USC genome browser for hg19 with significantly (FDR<5%) differentially marked proximal H3K4me3 peaks (ΔH3K4me3) of parent (P) vs IDTC colony (Col) (c middle panel) or parent (P) vs resistant (R) (d middle panel). Top 5 transcription factor binding motifs identified in significantly differentially marked proximal H3K4me3 peaks (lower panel) and significantly differentially marked proximal H3K4me3 peaks that also overlap with CpG islands (upper panel) are shown. e, Scatter plot of log2FC of the differentially marked proximal H3K4me3 peaks of parent vs IDTC colony as determined by ChIP-seq and log2FC of mRNA levels as determined by RT-qPCR of 21 resistance-associated genes. Genes with significant changes in their mRNA level are indicated in red. Genes with H3K4me3 peaks overlapping with CpG islands are indicated by squares.
Fig. 4.
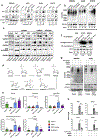
Fig. 4.. Transiently resistant IDTC-colonies upregulate H3K4me3 through O-linked N-acetylglucosamine transferase.
Immunoblotting of OGT, TET1 (a) and O-GlcNAc (b) at the individual cell states in WM164, A375 (a only), A549 and H1975 cells. β-Actin was used as loading control. c, Immunoblotting of OGT, TET1 and O-GlcNAc in PDX tumors either untreated (control) or exposed to TAK-733 for 30 days. GAPDH was used as processing and loading control. Representative images are shown (n ≥ 2). d, Schematic representation of the hexosamine biosynthesis pathway. e, Abundance of the indicated metabolites (QC normalized data) from WM164 cells (IDTC and IDTC colony n = 6, parent and resistant n = 7) at individual cell states. P-Values were calculated using ANOVA, * ** P ≤ 0.001, * * P ≤ 0.01, * P ≤ 0.05, n.s. P > 0.05, Data are represented as mean +SD. f, Immunoprecipitation of O-GlcNAcylated proteins in WM164, A549 and H1975 parent or IDTC colony cells followed by immunoblotting for histone 3. Cell lysates were normalized to total protein concentration, and OGT was used as an IP positive control. Representative images of independent experiments are shown (n ≥ 2). g, Immunoblotting of O-GlcNAc and H3K4me3 after treatment with PLX4032 (1 μM) (45 days) or OSMI4B (10 μM) (48 h), alone or in combination (45 days). β-Actin and H3 was used as loading control. h, Transcript levels of NRG1, WNT5A, VEGFC and EGFR after treatment with PLX4032 (1 μM) (45 days) or OSMI4B (10 μM) (48 h), alone or in combination (45 days). P-Values were calculated using ANOVA, * ** P ≤ 0.001, * * P ≤ 0.01, * P ≤ 0.05, n.s. P > 0.05, Data are represented as mean +SD.
Fig. 5.
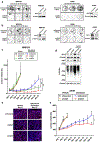
Fig. 5.. Inhibition of OGT blocks therapy-induced cellular reprogramming preventing tumor recurrence.
a, Crystal violet staining of shOGT and shControl WM164 and A549 following exposure to dabrafenib (50nM) or docetaxel (5nM), respectively, for 45 days (left panels). Immunoblotting of OGT in WM164 and A549 (right panels) following transfection with shRNA targeting OGT. β-Actin was used as loading control. Representative images of independent experiments are shown (n≥2). b, Same as (a) with shTET1. Representative images of independent experiments are shown (n≥2). c, Tumor growth of WM164 shControl, shOGT and shTET1 cells injected into flanks of immunocompromised mice and treated with vehicle or dabrafenib (10 mg/kg)/trametinib (0.1 mg/kg), (n=6 per group). P-Values were calculated using t-tests corrected for multiple comparisons, *** P ≤ 0.001, Data are represented as mean ±SD. d, Immunoblotting of OGT, TET1 and O-GlcNAc from isolated tumor samples treated with vehicle (11 days) or dabrafenib (10 mg/kg)/trametinib (0.1 mg/kg) (treated, 27 days). β-Actin was used as loading control. Samples correspond to e and representative images of independent experiments are shown (n≥2). e, Immunofluorescence of H3K4me3 (red) combined with Hoechst nuclear staining (blue) of tumor samples treated with vehicle or dabrafenib (10 mg/kg)/trametinib (0.1 mg/kg). Representative images of independent experiments are shown (n≥3). f, Tumor growth of A549 shControl and shOGT cells injected into flanks of immunocompromised mice and treated with vehicle or docetaxel (15 mg/kg) (n=4 per group). P-Values were calculated using t-tests corrected for multiple comparisons, * P ≤ 0.05. Data are represented as mean ±SD.
Fig. 6.
Fig. 6.. AMP-activated protein kinase (AMPK) activation prevents OGT-mediated cellular reprogramming.
a, Crystal violet staining of WM164 and A549 cells exposed to dabrafenib 50 nM or docetaxel 5 nM with or without aspirin 2 mM for the indicated time frames. b, Relative growth rate of WM164 cells exposed to the indicated drug combinations for the indicated time points using MTT assay (n = 3). P-values were calculated using one-way ANOVA, * ** P ≤ 0.001, n.s. P > 0.05, Data are represented as mean ± SD. c, Relative growth rate of WM164 parental cells compared to WM164 cells exposed to dabrafenib 50 nM and aspirin 2 mM for 235 days, followed by 21 days drug holiday and re-treatment with indicated dabrafenib concentrations for 72 h (n = 3). Data are represented as mean ± SD. d, Immunoblotting of phospho-acetyl-CoA carboxylase (p-ACC), OGT, TET1 and O-GlcNAc from WM164 and A549 cells following indicated treatments. β-Actin was used as loading control. Representative images of independent experiments are shown (n ≥ 2). e and f, Immunofluorescence staining of H3K4me3 (red) combined with Hoechst nuclear staining (blue) in WM164 shControl or shAMPK cells with indicated treatments. Representative images of independent experiments are shown (n ≥ 3). g, Tumor growth of WM164 cells that were treated in vitro with either dabrafenib 50 nM or dabrafenib 50 nM combined with aspirin 2 mM for 50 days before injection into immunocompromised mice (n = 3). P-values were calculated using t-tests corrected for multiple comparisons, * ** P ≤ 0.001, Data are represented as mean ± SD. h, Immunoblotting of OGT, TET1 and O-GlcNAc from isolated tumor samples treated with vehicle, aspirin (100 mg/kg), dabrafenib (10 mg/kg)/trametinib (0.1 mg/kg) or the combination. GAPDH was used as loading control. Representative images of independent experiments are shown (n ≥ 2). i, Immunofluorescence staining of H3K4me3, OGT and TET1 (all red) combined with Hoechst nuclear staining (blue) of tumor samples treated with vehicle, aspirin (100 mg/kg) dabrafenib (10 mg/kg)/trametinib (0.1 mg/kg) or the combination. Representative images of independent experiments are shown (n ≥ 3).

References

    1. Ahronian LG, Sennott EM, Van Allen EM, Wagle N, Kwak EL, Faris JE, Godfrey JT, Nishimura K, Lynch KD, Mermel CH, Lockerman EL, Kalsy A, Gurski JM Jr., Bahl S, Anderka K, Green LM, Lennon NJ, Huynh TG, Mino-Kenudson M, Getz G, Dias-Santagata D, Iafrate AJ, Engelman JA, Garraway LA, Corcoran RB, 2015. Clinical acquired resistance to RAF inhibitor combinations in BRAF-mutant colorectal cancer through MAPK pathway alterations. Cancer Discov. 5 (4), 358–367. - PMC - PubMed
    1. Akella NM, Ciraku L, Reginato MJ, 2019. Fueling the fire: emerging role of the hexosamine biosynthetic pathway in cancer. BMC Biol. 17 (1), 52. - PMC - PubMed
    1. Bai X, Fisher DE, Flaherty KT, 2019. Cell-state dynamics and therapeutic resistance in melanoma from the perspective of MITF and IFNγ pathways. Nat. Rev. Clin. Oncol. 16 (9), 549–562. - PMC - PubMed
    1. Buescher JM, Moco S, Sauer U, Zamboni N, 2010. Ultrahigh performance liquid chromatography– tandem mass spectrometry method for fast and robust quantification of anionic and aromatic metabolites. Analytical chemistry 82 (11), 4403–4412. - PubMed
    1. Chiaradonna F, Ricciardiello F, Palorini RJC, 2018. The nutrient-sensing hexosamine biosynthetic pathway as the hub of cancer metabolic rewiring. Cells 7 (6), 53. - PMC - PubMed

Publication types