. 2024 Jan 4;147(1):147-162.
doi: 10.1093/brain/awad286.

ALCAM on human oligodendrocytes mediates CD4 T cell adhesion

Affiliations

ALCAM on human oligodendrocytes mediates CD4 T cell adhesion

Hélène Jamann et al. Brain. .

Abstract

Multiple sclerosis is a chronic neuroinflammatory disorder characterized by demyelination, oligodendrocyte damage/loss and neuroaxonal injury in the context of immune cell infiltration in the CNS. No neuroprotective therapy is available to promote the survival of oligodendrocytes and protect their myelin processes in immune-mediated demyelinating diseases. Pro-inflammatory CD4 Th17 cells can interact with oligodendrocytes in multiple sclerosis and its animal model, causing injury to myelinating processes and cell death through direct contact. However, the molecular mechanisms underlying the close contact and subsequent detrimental interaction of Th17 cells with oligodendrocytes remain unclear. In this study we used single cell RNA sequencing, flow cytometry and immunofluorescence studies on CNS tissue from multiple sclerosis subjects, its animal model and controls to characterize the expression of cell adhesion molecules by mature oligodendrocytes. We found that a significant proportion of human and murine mature oligodendrocytes express melanoma cell adhesion molecule (MCAM) and activated leukocyte cell adhesion molecule (ALCAM) in multiple sclerosis, in experimental autoimmune encephalomyelitis and in controls, although their regulation differs between human and mouse. We observed that exposure to pro-inflammatory cytokines or to human activated T cells are associated with a marked downregulation of the expression of MCAM but not of ALCAM at the surface of human primary oligodendrocytes. Furthermore, we used in vitro live imaging, immunofluorescence and flow cytometry to determine the contribution of these molecules to Th17-polarized cell adhesion and cytotoxicity towards human oligodendrocytes. Silencing and blocking ALCAM but not MCAM limited prolonged interactions between human primary oligodendrocytes and Th17-polarized cells, resulting in decreased adhesion of Th17-polarized cells to oligodendrocytes and conferring significant protection of oligodendrocytic processes. In conclusion, we showed that human oligodendrocytes express MCAM and ALCAM, which are differently modulated by inflammation and T cell contact. We found that ALCAM is a ligand for Th17-polarized cells, contributing to their capacity to adhere and induce damage to human oligodendrocytes, and therefore could represent a relevant target for neuroprotection in multiple sclerosis.

Keywords: ALCAM; MCAM; Th17 cells; multiple sclerosis; oligodendrocytes.


Conflict of interest statement

The authors report no competing interests.

Figures

Figure 1
Figure 1
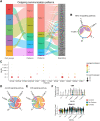
Contact with T cells leads to significant alterations in the transcriptional profile of oligodendrocytes. (A) Schematic of single cell sequencing experiments. Created with BioRender.com. (B and C) Uniform manifold approximation and projection (UMAP) of all preps (n = 3) grouped by (B) experimental condition or (C) cell type. Doublets, cells with high mitochondrial content and residual myeloid cells were removed. (D) Violin plots of canonical oligodendrocyte (OL) and T cell marker expression in each cell type cluster. (E) Top 30 identified gene ontology (GO) biological processes of differentially expressed genes (DEGs) between oligodendrocytes directly exposed to Th17 cells (contact condition) and oligodendrocytes separated from Th17 cells by an insert (no contact condition).
Figure 2
Figure 2
Cell adhesion molecules are implicated in oligodendrocyte–T cell contact. (A) Alluvial plot of all preps (n = 3) identifying significant outgoing communications between T cells and oligodendrocytes (OLs) in direct contact. The flow thickness shows the contribution of the cell group or signalling pathway to the inferred pattern, and the height of the patterns indicates the number of associated cell groups or signalling pathways. (B) Chord diagram of MHC-II signalling pathway network in the contact condition. (C) Dot plot of cell adhesion molecule (CAMs) expression in each cell population across conditions. (D and E) Chord diagram of (D) ALCAM and (E) CD6 signalling pathway networks in the contact condition. The inner bar colours of the chord diagram represent the targets that receive signal from the corresponding outer bar. The inner bar size is proportional to the signal strength received by the targets. (F) Violin plots of expression of CD6 and LGALS1, the corresponding ligands of ALCAM and MCAM, in the different cell subpopulations.
Figure 3
Figure 3
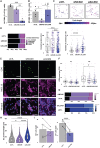
ALCAM and MCAM are expressed by oligodendrocytes in MS. (A and B) Representative confocal images of (A) ALCAM or (B) MCAM staining on CNS post-mortem tissue from controls with epilepsy (temporal lobe, white matter) and multiple sclerosis (MS) patient normal-appearing white matter (NAWM), pre-active, active and chronic inactive lesions (frontal lobe, white matter). Oligodendrocytes (OLs) are stained in magenta (NogoA) and nuclei in blue (DAPI). Scale bar = 25 µm, representative of n = 3 MS and two control donors. Arrows point to examples of oligodendrocytes positive for ALCAM or MCAM. (C) Proportion of O4+ OL expressing ALCAM and MCAM on their surface by flow cytometry analysis of ex vivo tissue of MS patients in normal-appearing cortex (NAC), cortical lesion (CL), NAWM or white matter lesion (WML) tissue. Control (CTL) tissue corresponds to non-inflammatory neurological disease: epilepsy, hereditary spastic paraplegia and amyotrophic lateral sclerosis (ALS). Each dot represents one area of tissue, bar plots representing mean ± standard error of the mean (SEM). Kruskal-Wallis test, n = 5 MS donors, n = 4 ALS donors, n = 3 epilepsy donors, n = 1 other neurological disease (OND) donor. One-way ANOVA, Tukey’s multiple comparison’s test, *P ≤ 0.05.
Figure 4
Figure 4
ALCAM and MCAM are expressed by human primary oligodendrocytes in resting and inflamed conditions. (A and B) Proportion and delta median fluorescence (ΔMFI) for surface expression by oligodendrocytes (OLs) of (A) MCAM or (B) ALCAM after exposure to indicated cytokines for 16 h (flow cytometry analysis). Each dot represents one prep (one human donor), bar plots representing mean ± SEM, Kruskal-Wallis test. (C) Representative confocal images of ALCAM or MCAM (green) expression by human primary OL (Olig1, magenta) in resting condition or after activation with TNFα/IFNγ for 16 h. Staining performed after permeabilization. Nuclei (DAPI) = blue. Scale bar = 50 µm. (D) Quantification of ALCAM or MCAM staining overlap with oligodendrocyte staining (Olig1, CNPase or NogoA) (E) and mean fluorescence intensity (MFI) of ALCAM or MCAM on oligodendrocyte. Box plots representing data spreading (box for the interquartile interval, horizontal bar for median, diamond for mean), each dot represents one field of view, Wilcoxon test, n = 3 preps. (F) Relative expression of ALCAM or MCAM mRNA by human primary oligodendrocyte in resting condition or after activation with TNFα. Relative mRNA level was quantified based on 18S RNA expression using RT-qPCR. Each dot represents one experiment, bar plots representing mean ± SEM, paired t-test, n = 3 preps. (G and H) Percentage and delta MFI quantification of (G) MCAM and (H) ALCAM expression by human oligodendrocytes in primary culture as assessed by flow cytometry after coculture with human Th2- or Th17-polarized CD4 T cells for 36 h. Each dot represents one donor, bar plots representing mean ± SEM. One-way ANOVA with Tukey’s post hoc test (MCAM analyses and ALCAM percentage) or Kruskal-Wallis test (ALCAM MFI), n = 3 preps. *P ≤ 0.05, **P ≤ 0.01, ***P ≤ 0.001.
Figure 5
Figure 5
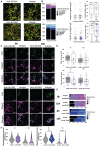
ALCAM silencing in oligodendrocytic cell line MO3.13 reduces damage induced by Th17-polarized cells. (A) ALCAM and MCAM percentage and (B) Δ median fluorescent intensity (MFI) on O4+ cells from transfected MO3.13 cells with control (siCTL), ALCAM (siALCAM) or MCAM (siMCAM) silencing RNA in co-culture with polarized Th17 cells. Quantification from fluorescence activated single cell sorting (FACS) acquisition, each dot represents one experiment, bar plots representing mean ± SEM, Wilcoxon test for ALCAM and paired t-test for MCAM quantifications. (C) Representative tracking of Th17-polarized cells in co-culture with transfected MO3.13 cells over 2 h. Track length is colour-coded. Scale bar = 40 µm. (D) Live imaging quantification of contact behaviour (proportion of each type of contact), contact duration and number of contact per cell. Box plots representing data spreading (box for the interquartile interval, horizontal bar for median, diamond for mean), each dot represents one contact, Kruskal-Wallis test, n = 3 donors, n = 4 movies per donor, 218 tracks for siCTL, 206 tracks for siMCAM and 335 tracks for siALCAM. (E) Representative confocal images from polarized Th17 cells (CellTracker green, green)—transfected MO3.13 cells (CellTracker Orange CMRA, magenta) 16 h co-cultures. Nuclei are stained by DAPI (blue). Scale bar = 50 µm. (F) Adherent polarized Th17 cells quantification after 16 h co-culture with transfected MO3.13 cells. Box plots representing data spreading (box for the interquartile interval, horizontal bar for median, diamond for mean), each dot represents one field of view (FOV), n = 3 donors for 8 h co-culture and n = 4 donors for 16 h co-culture, Kruskal-Wallis test. (G) MO3.13 cells branch level proportion and (H) process length after 16 h co-culture with polarized Th17 cells. Violin plot incremented with box plots representing data spreading (box for interquartile interval, horizontal bar for median, dot for mean), n = 4 donors, Kruskal-Wallis test. (I) Transfected MO3.13 cells death per cent after 16 h co-culture with polarized Th17 cells quantified by FACS (O4+ Amcyan+ cells %). Each dot represents one donor, bar plots representing mean ± SEM, paired t-test. *P < 0.05, **P < 0.01, ***P < 0.001, ****P < 0.0001.
Figure 6
Figure 6
ALCAM blockade protects oligodendrocytes from Th17-mediated injury. (A) Representative tracks of Th17-polarized cell–human primary oligodendrocyte (OLs) co-culture (n = 4 independent experiments). Scale bar = 20 µm. (B) Contact behaviour (proportion of each type of contact), number of contact per cell and contact duration quantification from live imaging experiment on polarized Th17 cell–OL co-culture 2-h videos with ALCAM (30 µg/ml) or MCAM (40 µg/ml) neutralizing antibodies or isotype (IgG1, 30 µg/ml or 40 µg/ml). Box plots representing data spreading (box for the interquartile interval, horizontal bar for median, diamond for mean), each dot represents one contact. Number of tracks: anti-ALCAM = 115; isotype ALCAM = 113; anti-MCAM = 105; isotype MCAM = 79. (C) Representative confocal images of human primary OL (NogoA, magenta) in co-culture with human polarized Th17 cells (CellTracker green) for 8 h or 16 h in the presence of ALCAM neutralizing antibody, MCAM neutralizing antibody or isotype. Nuclei are stained in blue. Scale bar = 50 µm. (D) Quantification of adherent polarized Th17 cells remaining on human primary oligodendrocyte. Box plots representing data spreading (box for the interquartile interval, horizontal bar for median, diamond for mean), each dot represents one field of view (FOV), n = 4 preps and donors for 8 h co-culture and n = 3 preps and donors for 16 h co-culture, Wilcoxon test. (E) Quantitative analysis of branch level complexity per oligodendrocyte and (F) length of n = 190 (8 h, ALCAM isotype), n = 165 (8 h, anti-ALCAM), n = 139 (16 h, ALCAM isotype), n = 151 (16 h, anti-ALCAM), n = 180 (8 h, MCAM isotype), n = 175 (8 h, anti-MCAM), n = 140 (16 h, isotype), n = 154 (16, anti-MCAM) oligodendrocyte after co-culture with Th17 cells in the presence of ALCAM or MCAM neutralizing antibody or isotype. Violin plot incremented with box plots representing data spreading (box for interquartile interval, horizontal bar for median, dot for mean), Wilcoxon test, n = 4 preps and donors for 8 h co-culture and n = 3 preps and donors for 16 h co-culture. *P < 0.05, **P < 0.01, ****P < 0.0001.

Similar articles

Cited by

References

    1. Reich DS, Lucchinetti CF, Calabresi PA. Multiple sclerosis. N Engl J Med. 2018;378:169–180. - PMC - PubMed
    1. Kuhlmann T, Ludwin S, Prat A, Antel J, Bruck W, Lassmann H. An updated histological classification system for multiple sclerosis lesions. Acta Neuropathol. 2017;133:13–24. - PubMed
    1. Cui QL, Khan D, Rone M, et al. Sublethal oligodendrocyte injury: A reversible condition in multiple sclerosis? Ann Neurol. 2017;81:811–824. - PubMed
    1. Allanach JR, FarrellJW, 3rd, Mésidor M, Karimi-Abdolrezaee S. Current status of neuroprotective and neuroregenerative strategies in multiple sclerosis: A systematic review. Mult Scler. 2021;28:29–48. - PMC - PubMed
    1. Gacem N, Nait-Oumesmar B. Oligodendrocyte development and regenerative therapeutics in multiple sclerosis. Life (Basel). 2021;11(4):327. - PMC - PubMed

Publication types

Substances

Grants and funding