

Kappa Free Light Chain Index Predicts Disease Course in Clinically and Radiologically Isolated Syndromes
- PMID: 37640543
- PMCID: PMC10462056
- DOI: 10.1212/NXI.0000000000200156
Kappa Free Light Chain Index Predicts Disease Course in Clinically and Radiologically Isolated Syndromes
Abstract
Background and objectives: To evaluate whether the kappa free light chain index (K-index) can predict the occurrence of new T2-weighted MRI lesions (T2L) and clinical events in clinically isolated syndrome (CIS) and radiologically isolated syndrome (RIS).
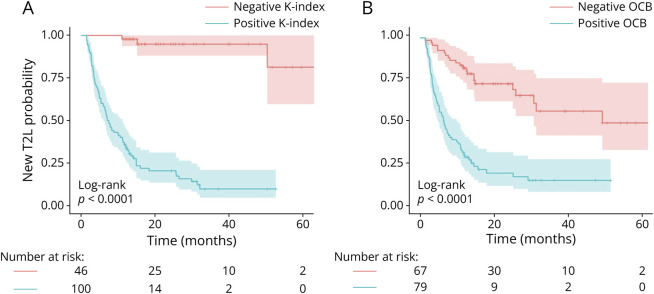
Methods: All consecutive patients presenting for the diagnostic workup, including CSF analysis, of clinical and/or MRI suspicion of multiple sclerosis (MS) since May 1, 2018, were evaluated. All patients diagnosed with CIS and RIS with at least 1-year follow-up were included. Clinical events and new T2L were collected during follow-up. The K-index performances in predicting new T2L and a clinical event were evaluated using time-dependent ROC analyses. The time to clinical event or new T2L was estimated using survival analysis according to the binarized K-index using an independent cutoff of 8.9, and the ability of each variable to predict outcomes was compared using the Harrell c-index.
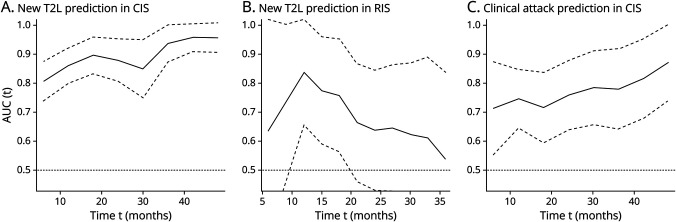
Results: One hundred and eighty two patients (146 CIS and 36 RIS, median age 39 [30; 48] y-o, 70% females) were included with a median follow-up of 21 [13, 33] months. One hundred five (58%) patients (85 CIS and 20 RIS) experienced new T2L, and 28 (15%; 21 CIS and 7 RIS) experienced a clinical event. The K-index could predict new T2L over time in CIS (area under the curve [AUC] ranging from 0.86 to 0.96) and in RIS (AUC ranging from 0.84 to 0.54) but also a clinical event in CIS (AUC ranging from 0.75 to 0.87). Compared with oligoclonal bands (OCBs), the K-index had a better sensitivity and a slight lower specificity in predicting new T2L and clinical events in both populations. In the predictive model, the K-index was the variable that best predict new T2L in both CIS and RIS but also clinical events in CIS (c-index ranging from 0.70 to 0.77), better than the other variables, including OCB.
Discussion: This study provides evidence that the K-index predicts new T2L in CIS and RIS but also clinical attack in patients with CIS. We suggest adding the K-index in the further MS diagnosis criteria revisions as a dissemination-in-time biomarker.
Copyright © 2023 The Author(s). Published by Wolters Kluwer Health, Inc. on behalf of the American Academy of Neurology.
Conflict of interest statement
The authors report no relevant disclosures. Go to
Figures

References
MeSH terms
Substances
LinkOut - more resources
Full Text Sources
Medical