. 2023 Aug 28;14(1):5247.
doi: 10.1038/s41467-023-40937-z.

Translocator protein is a marker of activated microglia in rodent models but not human neurodegenerative diseases

Affiliations

Translocator protein is a marker of activated microglia in rodent models but not human neurodegenerative diseases

Erik Nutma et al. Nat Commun. .

Abstract

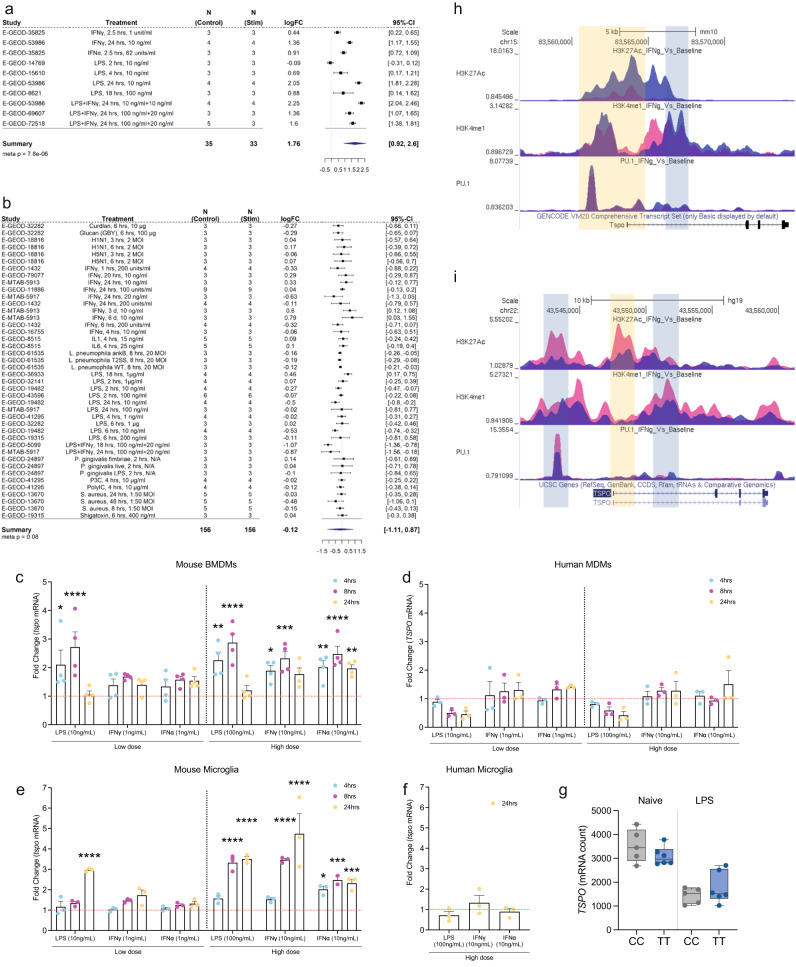
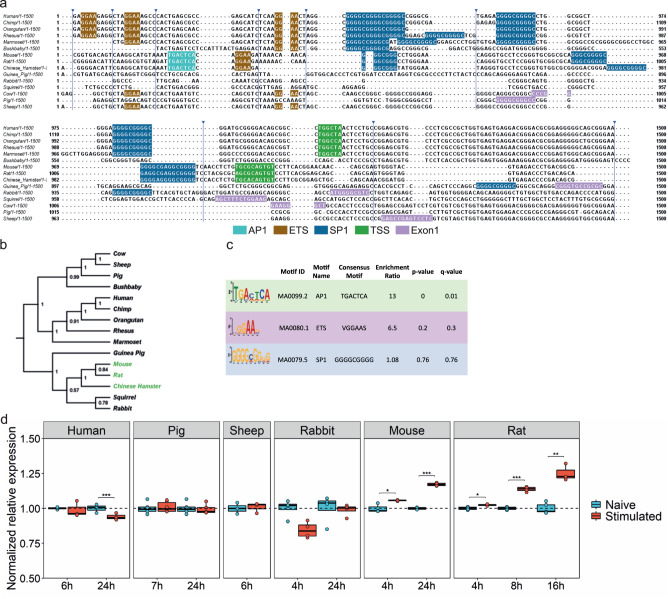
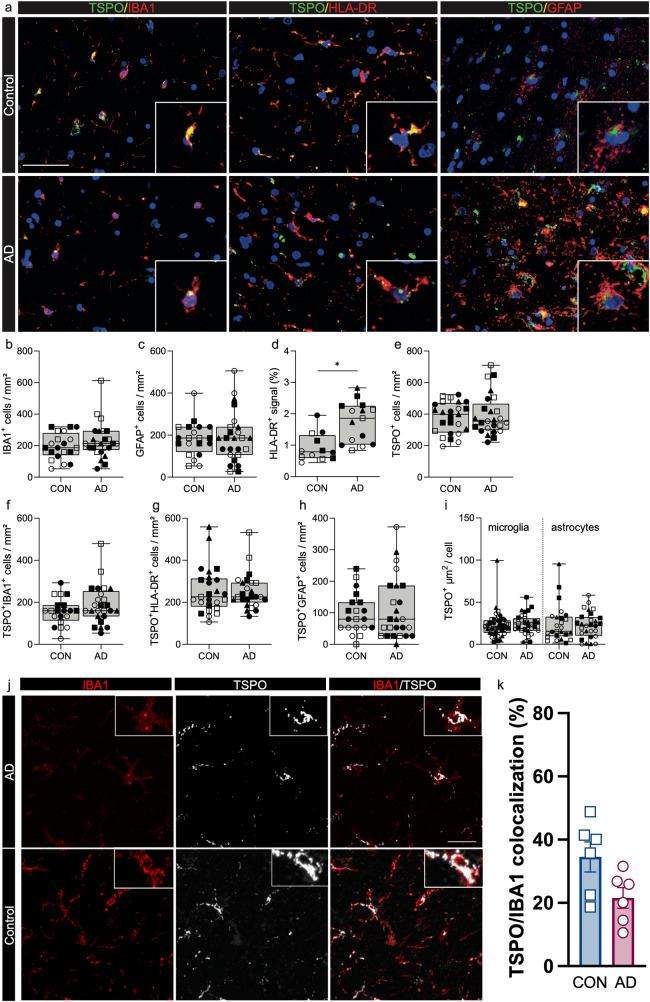
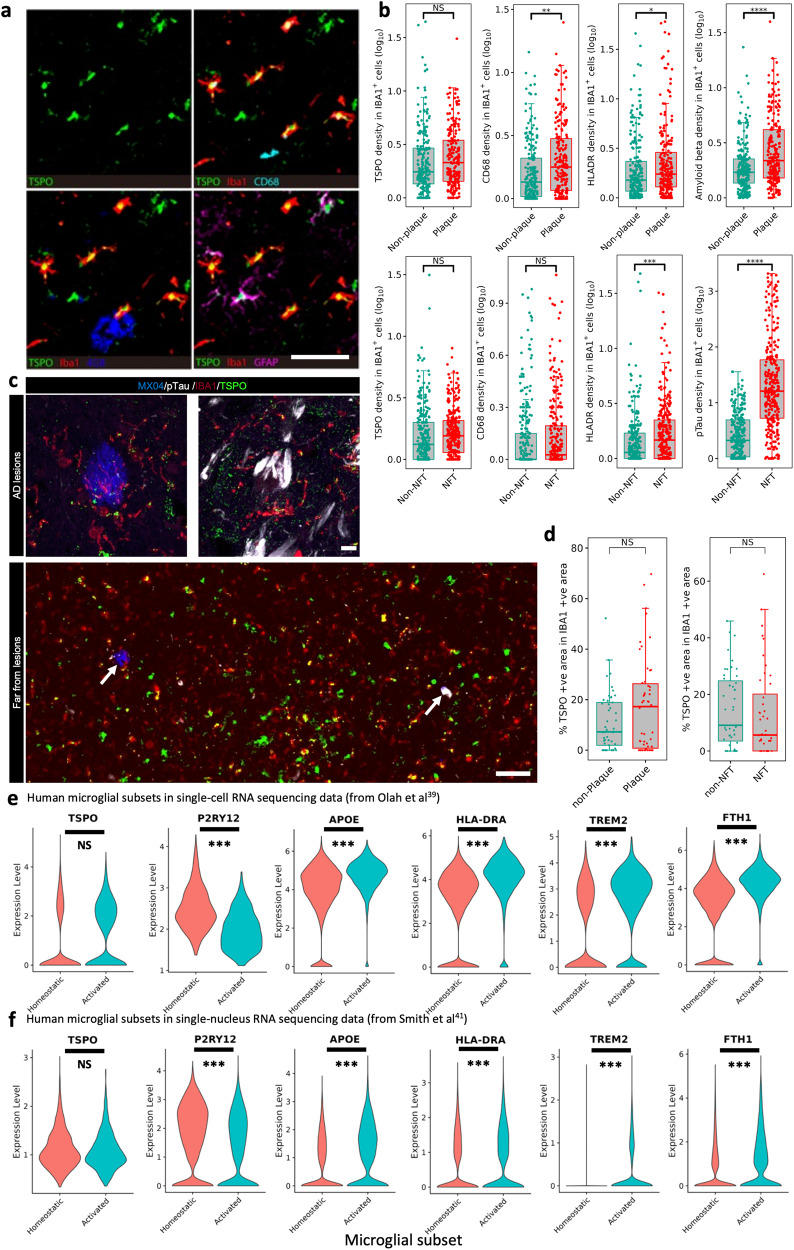
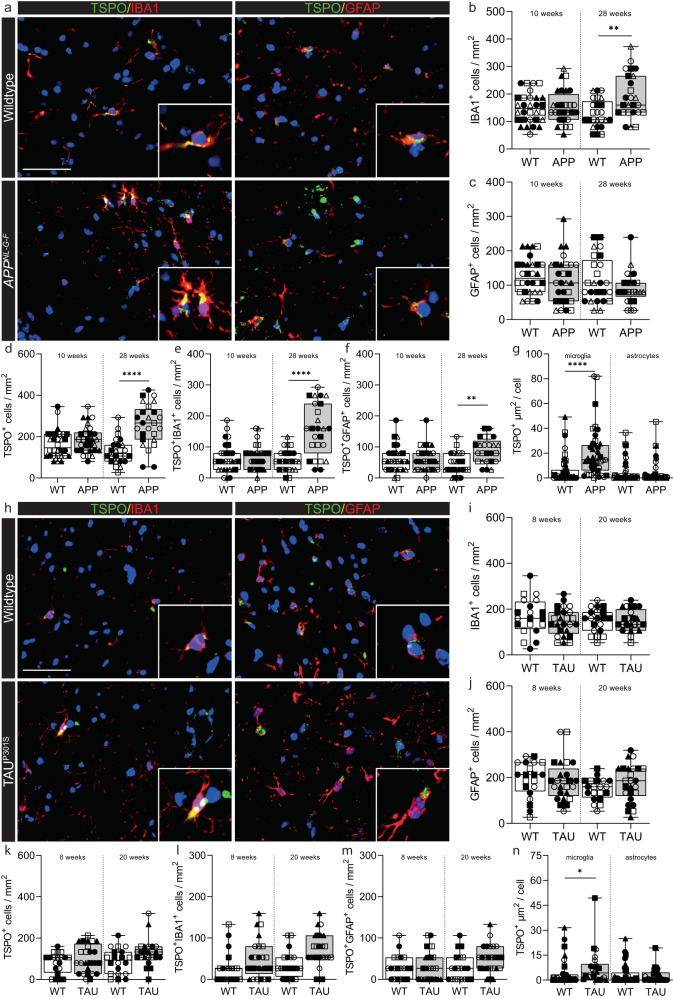
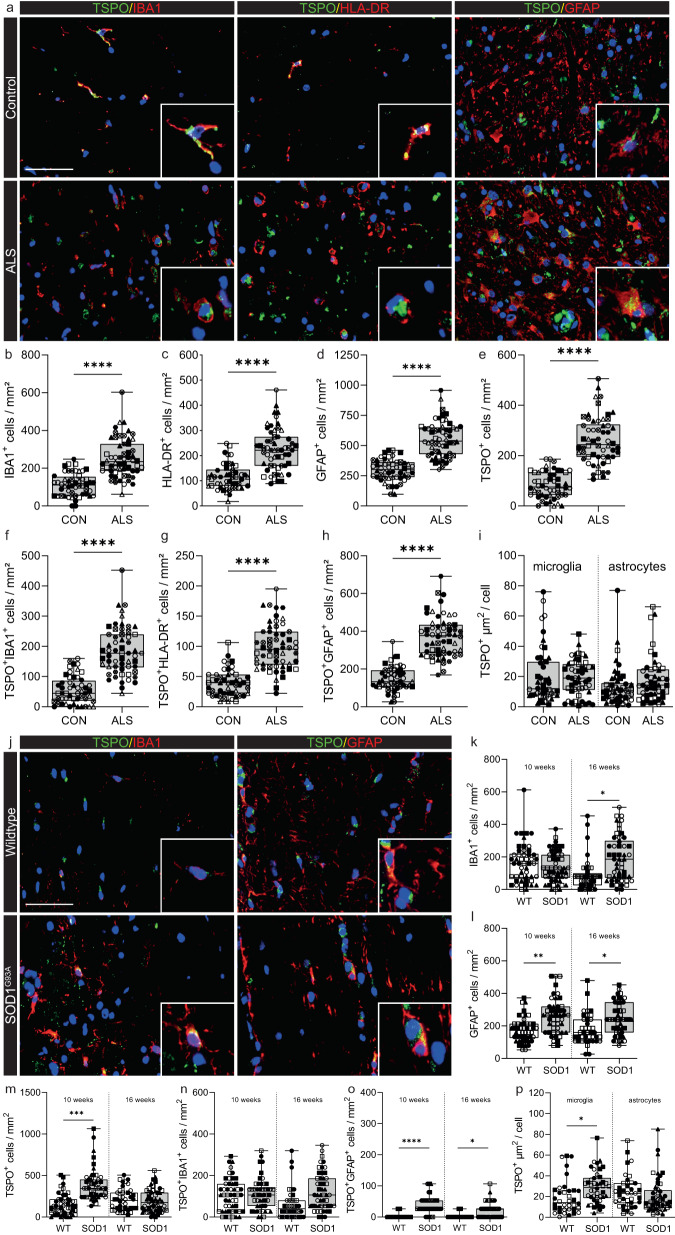
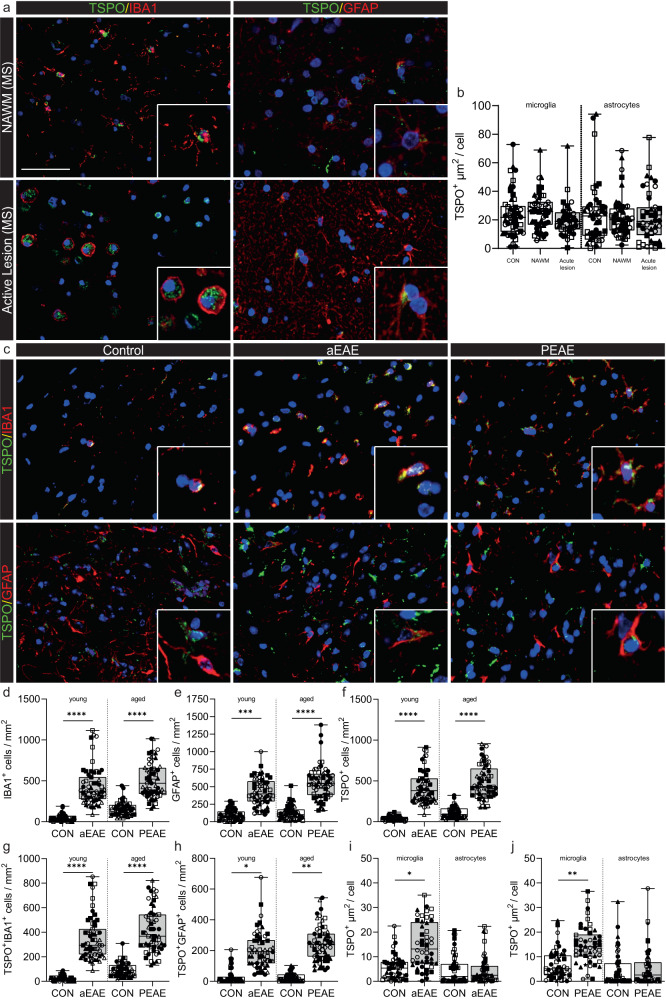
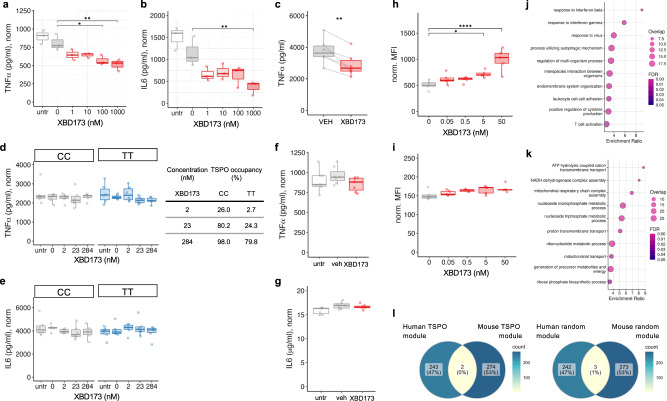
Microglial activation plays central roles in neuroinflammatory and neurodegenerative diseases. Positron emission tomography (PET) targeting 18 kDa Translocator Protein (TSPO) is widely used for localising inflammation in vivo, but its quantitative interpretation remains uncertain. We show that TSPO expression increases in activated microglia in mouse brain disease models but does not change in a non-human primate disease model or in common neurodegenerative and neuroinflammatory human diseases. We describe genetic divergence in the TSPO gene promoter, consistent with the hypothesis that the increase in TSPO expression in activated myeloid cells depends on the transcription factor AP1 and is unique to a subset of rodent species within the Muroidea superfamily. Finally, we identify LCP2 and TFEC as potential markers of microglial activation in humans. These data emphasise that TSPO expression in human myeloid cells is related to different phenomena than in mice, and that TSPO-PET signals in humans reflect the density of inflammatory cells rather than activation state.


Conflict of interest statement

The authors declare no competing interests.

Figures

Fig. 1
Fig. 1. TSPO gene expression and epigenetic profile in human and mouse macrophages.
a, b Forest plot of the meta-analysis for TSPO expression in a mouse and b human myeloid cells treated with a pro-inflammatory stimulus. Statistical significance for individual dataset was done using linear model, the meta-analysis was performed using random-effect model (black square; logFC, horizontal lines; 95% CI, diamond; pooled logFC). c, d Fold change of TSPO mRNA in macrophages after stimulation indicating increases in tspo expression in mice but not in TSPO expression in humans. e, f An increase is observed in tspo expression after stimulation of mouse microglia but not in TSPO in human microglia. g TSPO mRNA count data from RNA sequencing of human monocytes isolated from healthy volunteers (with C/C and T/T genotype at the rs6971 locus) exposed to 100 ng/mL LPS for 24 h shows no effect of genotype on TSPO mRNA. h, i ChIP-seq data, generated from h mouse and i human myeloid cells treated with IFNγ, visualisation of histone modification peaks (H3K27Ac, K4me1) and PU.1 binding peaks at TSPO loci in IFNγ-treated (blue) and baseline (pink) conditions. Yellow vertical shading corresponds to the TSS along with promoter and light blue shading corresponds to the enhancer region of the loci. Biologically independent samples were used for all experiments (cf n = 3 for all conditions, g n = 5 C/C and n = 6 T/T genotype). Statistical significance in (cg) was determined by one-way ANOVA or Kruskal–Wallis test when not normally distributed or by a two-tailed unpaired t-test or two-tailed Mann–Whitney U-test when not normally distributed. Bar graphs indicate the mean ± SEM. Box and whiskers mark the 25th to 75th percentiles and min to max values, respectively, with the median indicated. Source data are provided as a Source data file.
Fig. 2
Fig. 2. AP1 binding site in the TSPO promoter and LPS inducible TSPO expression is unique to the Muroidea superfamily of rodents.
a Multiple sequence alignment of TSPO promoter region of 15 species from primate, rodent, non-primate mammals. AP1 (cyan) and an adjacent ETS (brown) site is present in only a sub-group of rodent family which includes mouse, rat, and Chinese hamster. The ETS site which binds transcription factor PU.1 is present across species. SP1 (blue) site is found in the core promoter close to the TSS (green). For species where the TSS is not known Exon1 (pink) location is shown. Blue arrowhead indicates sequence without any motif hidden for visualization. b Phylogenetic tree is showing a clear branching of rat, mouse, and Chinese hamster TSPO promoter from the rest of the species from rodents. Primates including marmoset forms a separate clade while sheep, cow and pig are part for the same branch. Green highlights represent species that contain the AP1 site in TSPO promoter. Phylogenetic tree was generated using the Maximum Parsimony method in MEGA11. The most parsimonious tree with length = 4279 is shown. The consistency index (CI) is 0.760458 (0.697014) and the retention index is 0.656386 (RI) (0.656386) for all sites and parsimony-informative sites (in parentheses). The percentage of replicate trees in which the associated taxa clustered together in the bootstrap test (1000 replicates) are shown next to the branches. c Differential motif enrichment analysis between rodent vs non-rodent TSPO promoter region by SEA tools from MEME-suite confirms the significant enrichment of AP1 site in rodent promoter whereas SP1 site does not show any differential enrichment (Fisher’s exact test was used to determine enrichment ratio and p-value, q-value was calculated by Benjamini & Hochberg method). TSS; Transcription start site. d TSPO gene expression in macrophages or microglia isolated from multiple species after LPS stimulation. In line with the multiple sequence alignment of the TSPO promoter, species (mouse, rat) that contains an adjacent AP1 and ETS (PU.1) motif shows an upregulation of TSPO gene after LPS stimulation. Species lacking (human, pig, sheep, rabbit) those sites show a downregulation or no change in expression after stimulation. Biologically independent samples were used for all experiments (d rabbit, rat, pig n = 4 and human, mouse, sheep n = 3 for all conditions). Box and whiskers mark the 25th to 75th percentiles and min to max values, respectively, with the median indicated. Source data are provided as a Source data file.
Fig. 3
Fig. 3. TSPO expression is not altered in the AD hippocampus.
Scale bar = 50 µm unless indicated, inserts are digitally zoomed in (200%). a Representative images of TSPO expression in microglia and astrocytes in AD hippocampus. be no increases were observed in microglia (P = 0.5159, U = 7, ranks = 17, 28) and astrocytes (P = 0.8599, t = 0.1831, df = 7). An increase was observed in HLA-DR+ signal in AD hippocampus. No increase was observed in TSPO+ cells (P = 0.7329, t = 0.3534, df = 8) in the AD hippocampus. fh Concurrently no increases were observed in the number of TSPO + IBA1+ microglia (P = 0.3573, t = 0.9854, df = 7), TSPO + HLA-DR+ microglia (P = 0.7239, t = 0.3659, df = 8) and astrocytes (P = 0.7181, t = 0.3760, df = 7). i Even though microglia in the AD brain show signs of activation microglia do not upregulate TSPO expression in the hippocampus (P = 0.6717, t = 0.4398, df = 8), nor do astrocytes (P = 0.6475, t = 0.4750, df = 8). j Representative images of TSPO expression in microglia in AD and control using confocal microscopy. Scale bar = 20 μm. k No changes were observed in TSPO cellular expression in microglia in AD donors (n = 6) relative to control (n = 6) using confocal imaging (Mann–Whitney U = 7, P = 0.1775). Biologically independent samples were used for all experiments (b, c, f, h n = 4 CON and n = 5 AD) (d, e, g, i n = 5 CON and 5 AD) (k n = 6 CON and n = 6 AD). Statistical significance in (bk) was determined by a two-tailed unpaired t-test or two-tailed Mann–Whitney U-test when not normally distributed. Bar graphs mark the mean ± SEM. Box and whiskers mark the 25th to 75th percentiles and min to max values, respectively, with the median indicated. Each individual is represented by a different symbol.
Fig. 4
Fig. 4. TSPO is not upregulated in human pro-inflammatory activated microglia.
a Representative IMC images of HLA-DR, CD68, GFAP, 4G8 and TSPO. b Using IMC TSPO is unaltered in IBA1+ cells in close proximity to amyloid plaques (P = 0.86), whereas CD68 and HLA-DR and beta amyloid are significantly upregulated (upper row, P = 0.0037, P = 0.037 and P = 2.97E−11, respectively). Similarly, TSPO is not upregulated in IBA1+ cells in close proximity to NFT (P = 0.809), whereas HLA-DR and pTau are significantly upregulated (lower row, P = 0.0002 and P = 3.25E−60, respectively). c Representative confocal microscopy images from an immunofluorescence experiment staining for beta amyloid plaques (blue), TSPO (green), IBA1 (red) and pTau (white). d Results of the quantification of z-stacked images from the immunofluorescence experiment from (c) showing that TSPO is not altered in IBA1+ cells in close proximity to amyloid plaques (p = 0.30) or NFT (p = 0.094). e In the pro-inflammatory microglial subcluster of the Olah et al. single-cell RNA sequencing dataset, there is downregulation of P2RY12 (P = 2.29E−16) and upregulation of the pro-inflammatory APOE (P = 4.27E−104), HLA-DRA (P = 3.51E−77), TREM2 (P = 1.80E−61) and FTH1 (P = 6.51E−115) relative to the homeostatic microglial subcluster. However, TSPO expression is not upregulated (P = 0.99). f In the pro-inflammatory microglial subcluster of the Smith et al. single nucleus RNA sequencing dataset, there is downregulation of P2RY12 (P = 3.58E−9) and upregulation of the pro-inflammatory APOE (P = 5.42E−12), HLA-DRA (P = 8.15E−5), TREM2 (P = 1.18E−12) and FTH1 (P = 8.11E−21) relative to the homeostatic microglial subcluster. However, TSPO expression is not upregulated (P = 0.44). Scale bar = 120 µm unless indicated. Biologically independent samples were used for all experiments (b for Plaques n = 446 cells from 22 individual samples, for NFTs n = 561 cells from 16 individual samples) (d n = 50 regions of interest for all conditions). Statistical significance in (bd) was determined using a mixed-effects model and a zero-inflated Gamma distribution. Box and whiskers mark the 25th to 75th percentiles and the 95% confidence interval, respectively, with the median indicated. For demonstration purposes, the TSPO violin plot only contains the nuclei where TSPO is expressed, although as described in the methods the statistical analysis was performed on all nuclei. Source data are provided as a Source data file.
Fig. 5
Fig. 5. Microglia in the AppNL-G-F and TAUP301S model increase TSPO expression.
a Representative images of TSPO expression in microglia and astrocytes in AppNL-G-F hippocampus. b An increase was observed in IBA1+ microglia at 28 weeks (P = 0.0078, t = 3.522, df = 8) but not 10 weeks (P = 0.8788, t = 0.1565, df = 10) in AppNL-G-F hippocampus compared to control. c No increase in astrocytes was observed (10 weeks: P = 0.6266, t = 0.5019, df = 10; 28 weeks: P = 0.4425, t = 0.8080, df = 8). d TSPO+ cells were increased at 28 weeks (P = 0.0079, U = 0, ranks = 15, 40) but not at 10 weeks (P = 0.2375, t = 1.257, df = 10) in the AppNL-G-F mice. e, f Both TSPO+ microglia (P = 0.0005, t = 5.658, df = 8) and astrocytes (P = 0.0030, t = 4.207, df = 8) were increased at 28 weeks in the hippocampus of AppNL-G-F mice but not at 10 weeks (microglia: P = 0.7213, t = 0.3670, df = 10; astrocytes: P = 0.9561, t = 0.056, df = 10). g Activated microglia (P < 0.0001, t = 7.925, df = 8), but not astrocytes (P = 0.3095, U = 7, ranks = 33, 22), in the AppNL-G-F model have increased TSPO expression at 28 weeks. h Representative images of TSPO expression in microglia and astrocytes in TAUP301S hippocampus. ik No increases in microglia (8 weeks: P = 0.3687, t = 0.9608, df = 7; 20 weeks; P = 0.9647, t = 0.04580, df = 7), astrocytes (8 weeks: P = 0.7353, t = 0.3519, df = 7; 20 weeks; P = 0.0870, t = 1.989, df = 7) or TSPO+ cells (8 weeks: P = 0.8492, U = 9, ranks = 19, 26; 20 weeks; P = 0.0876, t = 1.985, df = 7) were observed in the hippocampus of TAUP301S mice. l, m No increase was observed in the number of TSPO+ microglia (8 weeks: P = 0.2787, t = 1.174, df = 7; 20 weeks; P = 0.0907, t = 1.961, df = 7) or astrocytes (8 weeks: P = 0.8684, t = 0.1718, df = 7; 20 weeks; P = 0.1984, U = 4.5, ranks = 14.5, 30.5). n Microglia in the TAUP301S increase TSPO expression (P = 0.0133, t = 3.471, df = 6) whereas astrocytes do not (P = 0.5800, t = 0.5849, df = 6). Biologically independent samples were used for all experiments (bg 10 weeks: n = 6 WT and n = 6 AppNL-G-F, 28 weeks: n = 5 WT and n = 5 AppNL-G-F) (in 8 and 20 weeks: n = 4 WT and n = 5 TAUP301S). Statistical significance in (bg) and (in) was determined by a two-tailed unpaired t-test or two-tailed Mann–Whitney U-test when not normally distributed. Box and whiskers mark the 25th to 75th percentiles and min to max values, respectively, with the median indicated. Scale bar = 50 µm, inserts are digitally zoomed in (200%). Each individual is represented by a different symbol. Source data are provided as a Source data file.
Fig. 6
Fig. 6. TSPO is increased in microglia in SOD1G93A mice but not in ALS spinal cord.
a Representative images of TSPO expression in microglia and astrocytes in ALS spinal cord. bd An increase was observed in microglia (P < 0.0001, t = 7.445, df = 19), HLA-DR+ microglia (P < 0.0001, t = 6.007, df = 19), and astrocytes (P < 0.0001, t = 9.024, df = 19) in ALS spinal cord when compared to controls. e A 2.5-fold increase of TSPO+ cells (P < 0.0001, t = 12.88, df = 19) was observed in the ALS spinal cord. f, g Up to a 3.4-fold increase in the density of TSPO+ microglia (TSPO + IBA1+ cell, P < 0.0001, t = 7.541, df = 19) (TSPO + HLA-DR+ cells, P < 0.0001, t = 3.368, df = 19) was observed. h TSPO+ astrocytes were significantly increased (P < 0.0001, t = 11.77, df = 19) in the spinal cord of ALS patients. i The increase in activated microglia and astrocytes was not associated with an increase in TSPO expression in microglia (P = 0.7684, t = 0.3046, df = 8) or in astrocytes (P = 0.5047, t = 0.6985, df = 8). j Representative images of TSPO expression in microglia and astrocytes in SOD1G93A spinal cord. k An increase was observed in microglia in SOD1G93A spinal cord when compared to controls at 16 weeks (P = 0.0115, t = 3.395, df = 7) but not at 10 weeks (P = 0.5334, t = 0.6509, df = 8). l An increase for astrocytes was observed for both 10 weeks (P = 0.0024, t = 4.362, df = 8) and 16 weeks (P = 0.0248, t = 2.848, df = 7). m An increase in TSPO+ cells was observed at 10 weeks (P = 0.0011, t = 4.931, df = 8) but not 16 weeks (P = 0.7299, t = 0.3594, df = 7). n No increase in the number of TSPO+ microglia was observed (10 weeks: P = 0.5244, t = 0.6656, df = 8; 16 weeks, P = 0.0930, t = 1.944, df = 7). o TSPO+ astrocytes were increased up to 15-fold in the spinal cord of SOD1G93A mice (10 weeks: P = 0.0003, t = 6.085, df = 8; 16 weeks: P = 0.382, t = 2.548, df = 7). p Despite no increase in the number of TSPO+ microglia, an increase in the amount of TSPO per cell was observed in microglia (P = 0.0451, t = 2.435, df = 7), but not astrocytes (P = 0.4052, t = 0.8856, df = 7) at 16 weeks. Biologically independent samples were used for all experiments (bh n = 10 CON and n = 11 ALS) (i n = 5 CON and n = 5 ALS) (kp 10 weeks: n = 5 WT and n = 5 SOD1G93A, 16 weeks: n = 4 WT and n = 5 SOD1G93A). Statistical significance in bi, and kp was determined by a two-tailed unpaired t-test. Box and whiskers mark the 25th to 75th percentiles and min to max values, respectively, with the median indicated. Scale bar = 50 µm, inserts are digitally zoomed in (200%). Source data are provided as a Source data file.
Fig. 7
Fig. 7. Microglia in mouse aEAE and PEAE, and marmoset EAE, but not MS, increase TSPO expression.
a Representative images of TSPO+ microglia and astrocytes in MS. b TSPO+ microglia (P = 0.2278, t = 1.306, df = 8) and astrocytes (P = 0.5476, U = 9, ranks = 31, 24) do not increase TSPO expression in MS. c Representative images of TSPO expression in microglia and astrocytes in EAE mice. df microglia (P < 0.0001, F(3,20) = 25.68), astrocyte (P < 0.0001, F(3,20) = 25.51), and TSPO+ cell numbers (P < 0.0001, F(3,20) = 44.53), are increased during disease in aEAE mice and PEAE. g, h An increase in both TSPO+ microglia (P < 0.0001, F(3,20) = 30.93) and TSPO+ astrocytes (P = 0.0005, K-W = 17.72) is observed during disease. i, j TSPO+ microglia increase TSPO expression in aEAE mice (P = 0.0136, t = 3.152, df = 8), and in PEAE mice (P = 0.0028, t = 4.248, df = 8). Astrocytes do not increase TSPO expression in aEAE (P = 0.0556, U = 3, ranks = 37, 18), and PEAE (P = 0.5918, t = 0.5584, df = 8). Biologically independent samples were used for all experiments (b n = 5 for all conditions) (dh n = 6 for all groups) (i, j n = 5 CON and n = 5 aEAE/PEAE) Statistical significance in (b), (dh) was determined by a one-way ANOVA or Kruskal–Wallis test when not normally distributed, and by a two-tailed unpaired t-test or two-tailed Mann–Whitney U-test when not normally distributed in (i) and (j). Holm–Sidak’s and Dunn’s multiple comparisons were performed. Box and whiskers mark the 25th to 75th percentiles and min to max values, respectively, with the median indicated. Scale bar = 50 µm, inserts are digitally zoomed in (200%). Each individual is represented by a different symbol. Source data are provided as a Source data file.
Fig. 8
Fig. 8. TSPO ligand XBD-173 modulates classical pro-inflammatory myeloid cell function in mouse but not human myeloid cells.
ac The specific TSPO ligand XBD-173 reduces LPS-induced cytokine secretion in mouse BV2 microglia (a, b) and primary bone marrow-derived macrophages (c; BMDM, XBD = 10 nM). (a P = 0.0007, F = 9.646, df = 5, padj(100) = 0.014, padj(1000) = 0.003; b P = 0.0008, F = 9.282, df = 5, padj(1000) = 0.006; c P = 0.005). dg XBD-173 does not reduce LPS-induced cytokine secretion in human primary monocyte-derived macrophages from rs6971 C/C or T/T individuals (d, e) or in hiPSC derived microglia-like cells (f, g) C/C: P = 0.833, K-W = 1.46, df = 4; T/T: P = 0.210, K-W = 5.862, df = 4, n = 6; e C/C: P = 0.10, K-W = 7.780, df = 4, T/T: P = 0.637, K-W = 2.545, df = 4, n = 6; f P = 0.057, two-tailed t-test, XBD = 200 nM; g P = 0.423, XBD = 200 nM). h, i XBD-173 enhances phagocytosis in mouse BMDM (h) but not human monocytes (i) (h P < 0.0001, F = 12.07, df = 4; i P = 0.173, K-W = 6.38, df = 4). j, k TSPO gene co-expression modules from naïve and pro-inflammatory primary macrophages in mouse and human. Gene ontology biological processes for the mouse TSPO module is enriched in classical pro-inflammatory pathways (j) and the human TSPO module is enriched for bioenergetic pathways (k). 2 genes overlap between mouse and human TSPO modules (l, left panel), compared to 3 genes overlapping between human and mouse random modules of the same size (l, right panel). Biologically independent samples were used for all experiments (a, b n = 3, ce n = 6, f, g n = 7, h, i n = 5 for all conditions). Statistical significance in (a), (b), (d), (e), (i) and (j) was determined by one-way ANOVA or Kruskal–Wallis test when not normally distributed and by a two-tailed t-test in (c) (paired), (f) and (g) (both unpaired). Box and whiskers mark the 25th to 75th percentiles and min to max values, respectively, with the median indicated. Source data are provided as a Source data file.

References

    1. Cunningham C. Microglia and neurodegeneration: the role of systemic inflammation. Glia. 2013;61:71–90. doi: 10.1002/glia.22350. - DOI - PubMed
    1. Heneka MT, et al. Locus ceruleus controls Alzheimer’s disease pathology by modulating microglial functions through norepinephrine. Proc. Natl Acad. Sci. USA. 2010;107:6058–6063. doi: 10.1073/pnas.0909586107. - DOI - PMC - PubMed
    1. O’Sullivan JB, Ryan KM, Curtin NM, Harkin A, Connor TJ. Noradrenaline reuptake inhibitors limit neuroinflammation in rat cortex following a systemic inflammatory challenge: implications for depression and neurodegeneration. Int. J. Neuropsychopharmacol. 2009;12:687–699. doi: 10.1017/S146114570800967X. - DOI - PubMed
    1. Brown GC, Vilalta A. How microglia kill neurons. Brain Res. 2015;1628:288–297. doi: 10.1016/j.brainres.2015.08.031. - DOI - PubMed
    1. Brown GC, Neher JJ. Inflammatory neurodegeneration and mechanisms of microglial killing of neurons. Mol. Neurobiol. 2010;41:242–247. doi: 10.1007/s12035-010-8105-9. - DOI - PubMed

Publication types