Randomized Controlled Trial
. 2023 Aug 28;13(1):14051.
doi: 10.1038/s41598-023-39359-0.

Perceived gender and political persuasion: a social media field experiment during the 2020 US Democratic presidential primary election

Affiliations
Randomized Controlled Trial

Perceived gender and political persuasion: a social media field experiment during the 2020 US Democratic presidential primary election

Aidan Combs et al. Sci Rep. .

Abstract

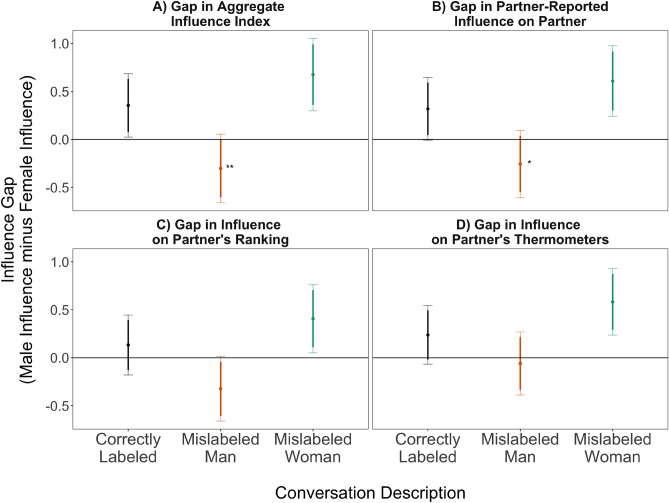
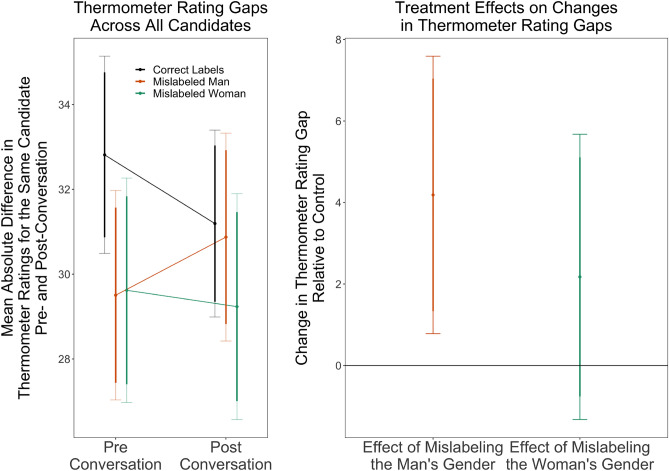
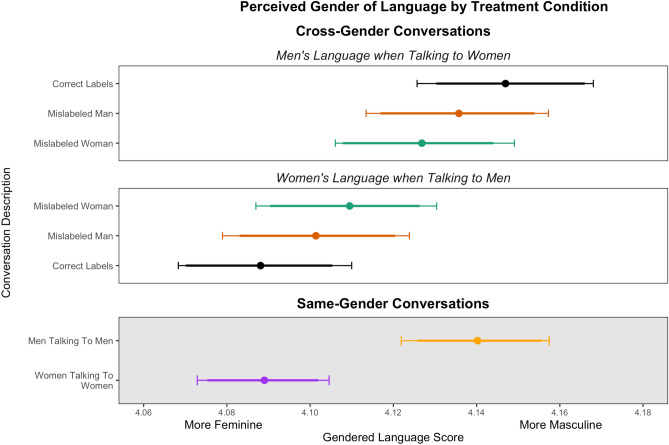
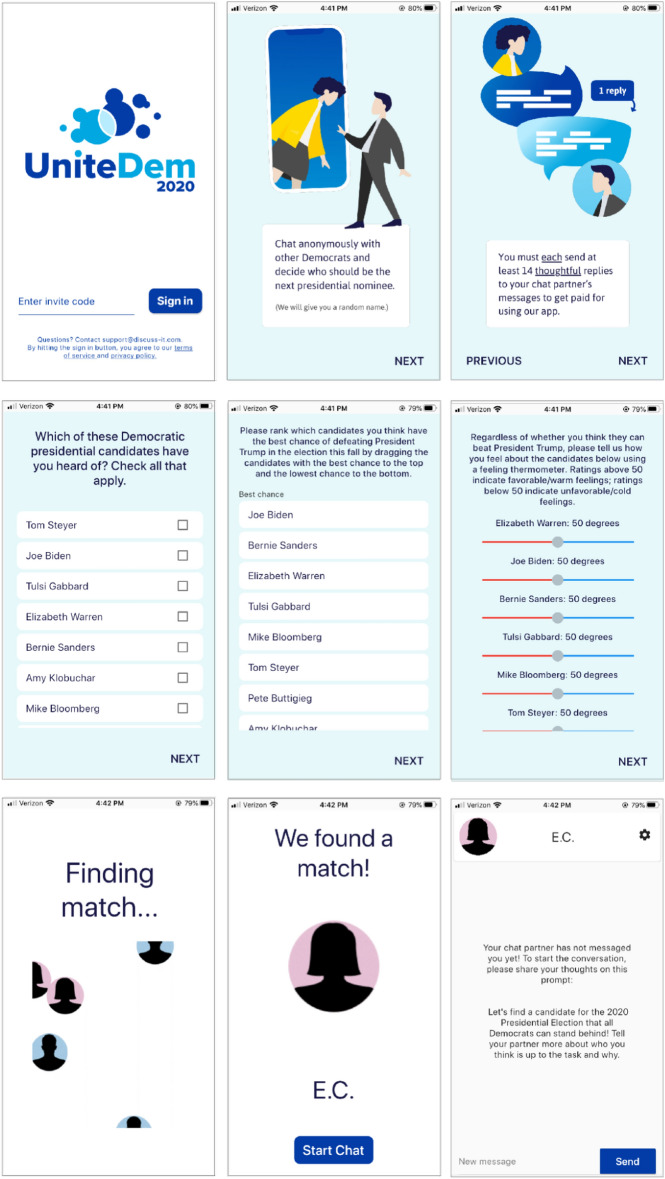
Women have less influence than men in a variety of settings. Does this result from stereotypes that depict women as less capable, or biased interpretations of gender differences in behavior? We present a field experiment that-unbeknownst to the participants-randomized the gender of avatars assigned to Democrats using a social media platform we created to facilitate discussion about the 2020 Primary Election. We find that misrepresenting a man as a woman undermines his influence, but misrepresenting a woman as a man does not increase hers. We demonstrate that men's higher resistance to being influenced-and gendered word use patterns-both contribute to this outcome. These findings challenge prevailing wisdom that women simply need to behave more like men to overcome gender discrimination and suggest that narrowing the gap will require simultaneous attention to the behavior of people who identify as women and as men.


Conflict of interest statement

The authors declare no competing interests.

Figures

Figure 1
Figure 1
Research design. In the control condition, one man talks to one woman, and both discussants are represented by an avatar associated with their self-reported gender. The treatment conditions also pair one man and one woman, but the treated discussion partner views an avatar that does not match the self-identified gender of their mislabeled discussion partner. The same-gender conditions pair men to converse with another man and women to converse with another woman, and both discussants are represented by an avatar associated with their self-reported gender. Note that contrasting the same-gender and any cross-gender conversations does not identify the causal effect of gender because only partners were randomized, not partner gender (holding other partner characteristics fixed). Men and women differ on many unobserved characteristics, so changing someone’s discussion partner from a man to a woman changes more than just the partner’s gender. See Supplementary Appendix Sect. 11.4 for more details.
Figure 2
Figure 2
Effects of gender mislabeling on the influence gap in cross-gender conversations about the 2020 Democratic Primary Election. The influence gap measures the difference between the influence of the man and woman on the given measure. Positive values indicate that the man is more influential. Dots are point estimates of the gap with 90% and 95% confidence intervals. Stars indicate significant differences between mislabeled conversations (orange for mislabeled men or green for mislabeled women) and correctly labeled conversations (black) using two-tailed t-tests. One star indicates significance at the 5% level, two indicates significance at the 1% level. In correctly labeled conversations, men are more influential on all metrics—and significantly so for the aggregate index (p=0.036, standard error 0.168, t-statistic 2.11 with 147 degrees of freedom). The orange and green bars show the influence gap in discussions where one partner was mislabeled. Mislabeling men as women reverses the gap such that women are on average the more influential partner in those conversations (p=0.009, standard error 0.247, t-statistic − 2.664 with 147 degrees of freedom). Mislabeling women as men increases men’s relative influence, widening the gap, though these effects are not statistically significant. The figure shows unadjusted means because the levels are interpretable and meaningful, consequently statistical significance is reported with t-tests that do not adjust for demographic covariates. Our randomization produced treatment and control groups balanced on these covariates, and statistical significance is identical with adjusting for them. See Table S13 for full statistical results and Table S14 for results with demographic covariates.
Figure 3
Figure 3
Mislabeling effects on attitude convergence. The left panel shows the magnitude of disagreements in feelings towards candidates pre- and post-conversation by treatment condition and the right panel explicitly shows treatment effects on the within-conversation changes in feelings towards candidates. This visualization depicts the absolute difference in thermometer rating for the same candidate across conversation partners within either the pre- or post-conversation survey. Conversations where the man is mislabeled exhibit increases in disagreement that are significantly larger (shown in the right panel, two-tailed p=0.016, standard error 1.73, t-statistic 2.43 with 182 degrees of freedom) than the decreases in disagreement in correctly labeled conversations. Mislabeling the woman increases disagreement relative to control but not at statistically significant levels. 95% and 90% confidence intervals are shown. The figure shows unadjusted means because the levels are interpretable and meaningful, consequently statistical significance is reported with t-tests that do not adjust for demographic covariates. Our randomization produced treatment and control groups balanced on these covariates, and statistical significance is identical with adjusting for them. See Table S17 for full statistical results and results adding demographic covariates.
Figure 4
Figure 4
Average influence on partners by partner’s gender and treatment condition. Point estimates and error bars indicate average level of influence exerted by the subject. Influence is measured with the aggregate influence index (panel A in Fig. 2); effects are the same direction for all component measures. Mislabeling men’s gender significantly increases women’s influence on men (p=0.014, standard error 0.134, t-statistic 2.46 with 277 degrees of freedom), relative to women’s influence in a correctly-labeled conversation. Thicker lines are 90% confidence intervals, the error bars extend to make 95% intervals. Stars indicate statistically significant (p < 0.05) differences between the indicated influence and influence in the control condition, correctly-labeled conversations between men and women. All statistical tests are two-tailed. Standard errors are clustered at the conversation level. The same-gender conversations are shaded grey to indicate that they do not identify causal effects of gender. The figure shows unadjusted means because the levels are interpretable and meaningful, consequently statistical significance is reported with t-tests that do not adjust for demographic covariates. Our randomization produced treatment and control groups balanced on these covariates, and statistical significance is identical with adjusting for them. See Table S18 for full statistical results and Table S19 for results with demographic covariates.
Figure 5
Figure 5
Patterns of gendered language usage in chats on the social media platform by treatment condition. X axis describes average gender connotation of words, based on the Roberts and Utych dictionary database. Higher scores indicate the overall pattern of word usage is more male. Across all treatment conditions, men used more male-sounding language, and women used more female-sounding language. Mislabeling changes the average gendered language score for both the treated partner and the mislabeled partner. The “Same-Gender Conversations” panel is greyed out to emphasize the fact that comparisons involving these estimates cannot be interpreted causally.
Figure 6
Figure 6
Screenshots of the Social Media Platform Used in Study. 596 Democrats were recruited to download an app. They completed a survey about their views about presidential candidates and were instructed to discuss which one was best positioned to defeat Trump in the 2020 Democratic Primary election. After completing the in-app survey, some respondents were randomly assigned an avatar (seen only by their discussion partner) that was inconsistent with their self-reported gender. After a 14 exchange chat with another Democrat in the study, respondents completed a post-survey of their attitudes.

References

    1. Sterling JS, Reichman N. Overlooked and undervalued: Women in private law practice. Annu. Rev. Law Soc. Sci. 2016;12:373. doi: 10.1146/annurev-lawsocsci-120814-121705. - DOI
    1. Tannen D. The power of talk: Who gets heard and why. Harvard Bus. Rev. 1995;73:138.
    1. McClean EJ, Martin SR, Emich KJ, Woodruff CT. The social consequences of voice: An examination of voice type and gender on status and subsequent leader emergence. Acad. Manag. J. 2018;61:1869. doi: 10.5465/amj.2016.0148. - DOI
    1. Rosenthal CS, Jones J, Rosenthal JA. Gendered discourse in the political behavior of adolescents. Polit. Res. Q. 2003;56:97. doi: 10.1177/106591290305600110. - DOI
    1. Lee JJ, Mccabe JM. Who speaks and who listens: Revisiting the chilly climate in college classrooms. Gender Soc. 2021;35:32. doi: 10.1177/0891243220977141. - DOI

Publication types