

Hippocampal subfield vulnerability to α-synuclein pathology precedes neurodegeneration and cognitive dysfunction
- PMID: 37640722
- PMCID: PMC10462636
- DOI: 10.1038/s41531-023-00574-1
Hippocampal subfield vulnerability to α-synuclein pathology precedes neurodegeneration and cognitive dysfunction
Abstract
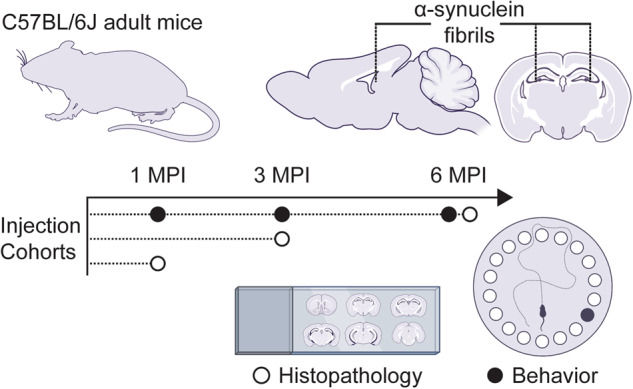
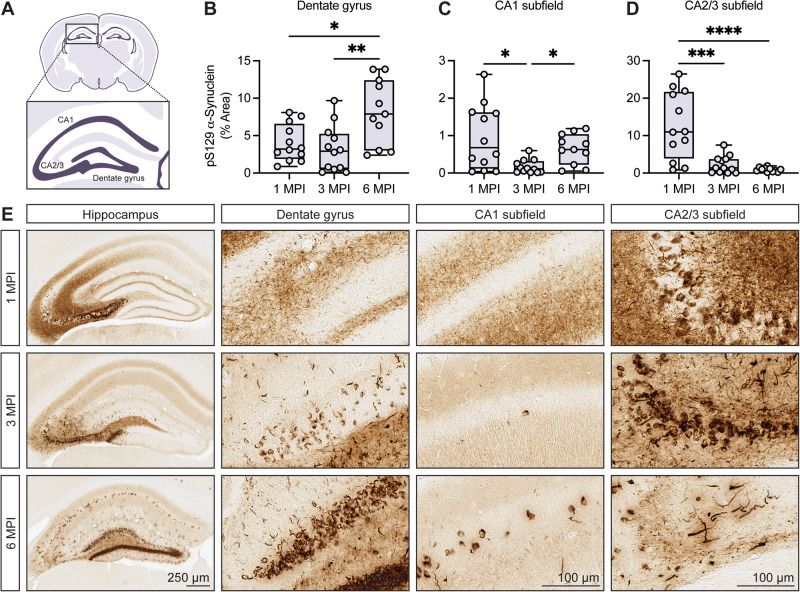
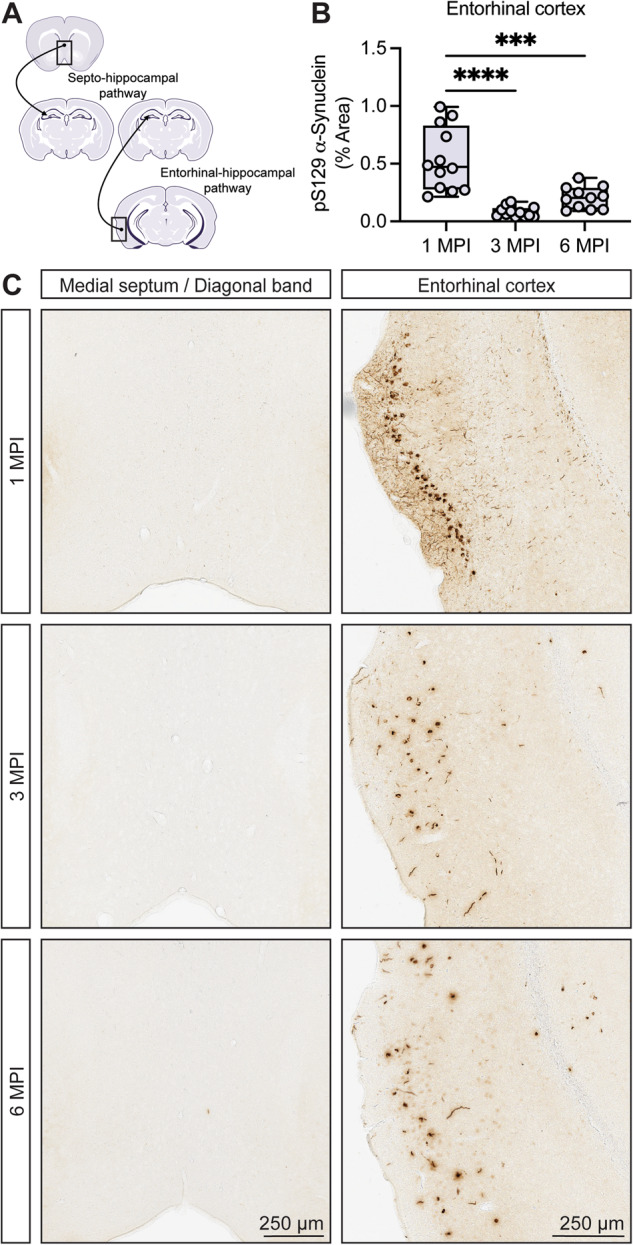
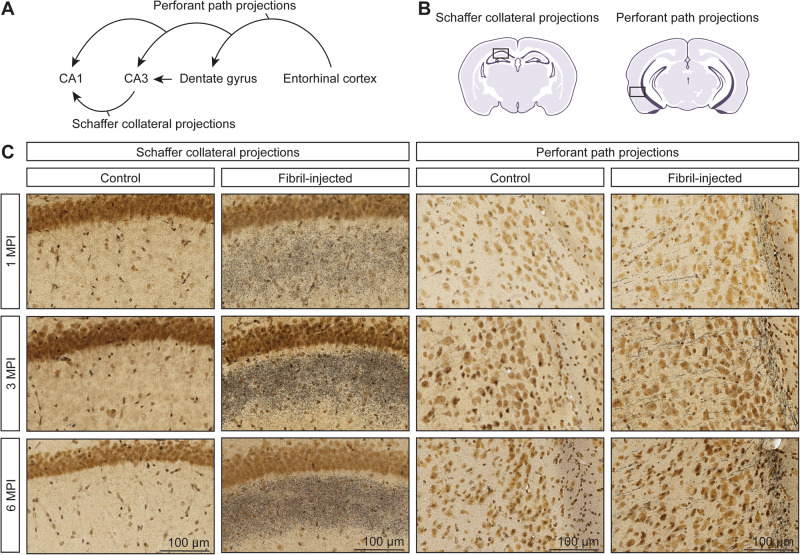
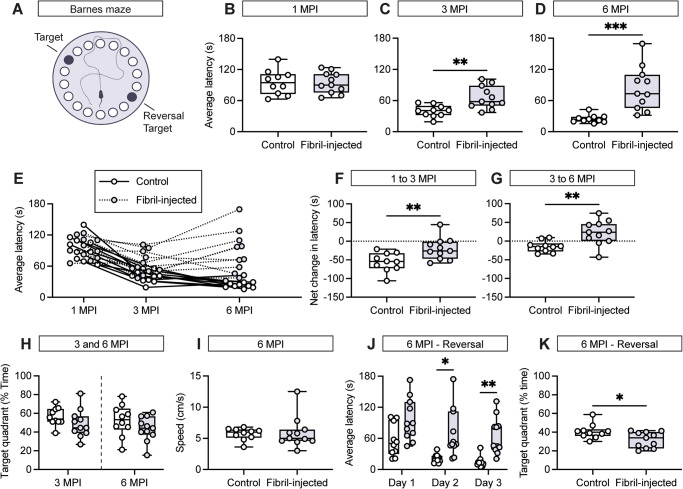
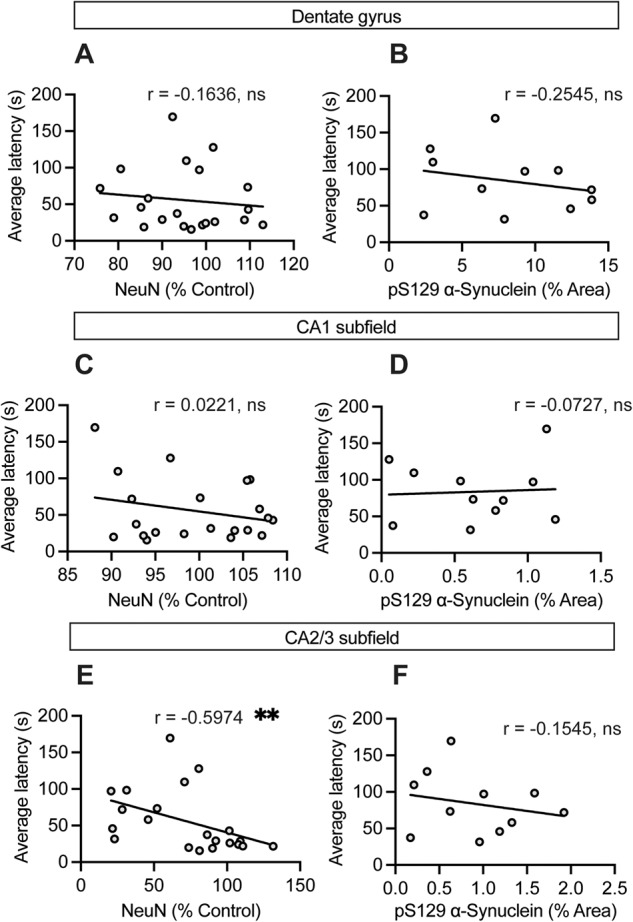
Cognitive dysfunction is a salient feature of Parkinson's disease (PD) and Dementia with Lewy bodies (DLB). The onset of dementia reflects the spread of Lewy pathology throughout forebrain structures. The mere presence of Lewy pathology, however, provides limited indication of cognitive status. Thus, it remains unclear whether Lewy pathology is the de facto substrate driving cognitive dysfunction in PD and DLB. Through application of α-synuclein fibrils in vivo, we sought to examine the influence of pathologic inclusions on cognition. Following stereotactic injection of α-synuclein fibrils within the mouse forebrain, we measured the burden of α-synuclein pathology at 1-, 3-, and 6-months post-injection within subregions of the hippocampus and cortex. Under this paradigm, the hippocampal CA2/3 subfield was especially susceptible to α-synuclein pathology. Strikingly, we observed a drastic reduction of pathology in the CA2/3 subfield across time-points, consistent with the consolidation of α-synuclein pathology into dense somatic inclusions followed by neurodegeneration. Silver-positive degenerating neurites were observed prior to neuronal loss, suggesting that this might be an early feature of fibril-induced neurotoxicity and a precursor to neurodegeneration. Critically, mice injected with α-synuclein fibrils developed progressive deficits in spatial learning and memory. These findings support that the formation of α-synuclein inclusions in the mouse forebrain precipitate neurodegenerative changes that recapitulate features of Lewy-related cognitive dysfunction.
© 2023. Springer Nature Limited.
Conflict of interest statement
The authors declare no competing interests.
Figures

Update of
-
Hippocampal subfield vulnerability to α-synuclein pathology precedes neurodegeneration and cognitive dysfunction.bioRxiv [Preprint]. 2023 Apr 12:2023.04.12.536572. doi: 10.1101/2023.04.12.536572. bioRxiv. 2023. Update in: NPJ Parkinsons Dis. 2023 Aug 29;9(1):125. doi: 10.1038/s41531-023-00574-1. PMID: 37090590 Free PMC article. Updated. Preprint.
Similar articles
-
Hippocampal subfield vulnerability to α-synuclein pathology precedes neurodegeneration and cognitive dysfunction.bioRxiv [Preprint]. 2023 Apr 12:2023.04.12.536572. doi: 10.1101/2023.04.12.536572. bioRxiv. 2023. Update in: NPJ Parkinsons Dis. 2023 Aug 29;9(1):125. doi: 10.1038/s41531-023-00574-1. PMID: 37090590 Free PMC article. Updated. Preprint.
-
Hippocampal α-Synuclein in Dementia with Lewy Bodies Contributes to Memory Impairment and Is Consistent with Spread of Pathology.J Neurosci. 2017 Feb 15;37(7):1675-1684. doi: 10.1523/JNEUROSCI.3047-16.2016. Epub 2016 Dec 30. J Neurosci. 2017. PMID: 28039370 Free PMC article.
-
Critical appraisal of pathology transmission in the α-synuclein fibril model of Lewy body disorders.Exp Neurol. 2018 Jan;299(Pt A):172-196. doi: 10.1016/j.expneurol.2017.10.017. Epub 2017 Oct 19. Exp Neurol. 2018. PMID: 29056362 Free PMC article.
-
Dementia with Lewy bodies and Parkinson's disease-dementia: current concepts and controversies.J Neural Transm (Vienna). 2018 Apr;125(4):615-650. doi: 10.1007/s00702-017-1821-9. Epub 2017 Dec 8. J Neural Transm (Vienna). 2018. PMID: 29222591 Review.
-
How can rAAV-α-synuclein and the fibril α-synuclein models advance our understanding of Parkinson's disease?J Neurochem. 2016 Oct;139 Suppl 1(Suppl 1):131-155. doi: 10.1111/jnc.13627. Epub 2016 May 4. J Neurochem. 2016. PMID: 27018978 Free PMC article. Review.
Cited by
-
Current insights and assumptions on α-synuclein in Lewy body disease.Acta Neuropathol. 2024 Aug 14;148(1):18. doi: 10.1007/s00401-024-02781-3. Acta Neuropathol. 2024. PMID: 39141121 Free PMC article. Review.
-
Amygdala-predominant α-synuclein pathology is associated with exacerbated hippocampal neuron loss in Alzheimer's disease.Brain Commun. 2024 Dec 5;6(6):fcae442. doi: 10.1093/braincomms/fcae442. eCollection 2024. Brain Commun. 2024. PMID: 39659977 Free PMC article.
-
TREM2 deficiency exacerbates cognitive impairment by aggravating α-Synuclein-induced lysosomal dysfunction in Parkinson's disease.Cell Death Discov. 2025 May 20;11(1):243. doi: 10.1038/s41420-025-02538-1. Cell Death Discov. 2025. PMID: 40393958 Free PMC article.
-
Imaging spatial transcriptomics reveals molecular patterns of vulnerability to pathology in a transgenic α-synucleinopathy model.bioRxiv [Preprint]. 2024 Dec 14:2024.07.31.606032. doi: 10.1101/2024.07.31.606032. bioRxiv. 2024. PMID: 39372781 Free PMC article. Preprint.
-
Pathological α-synuclein elicits granulovacuolar degeneration independent of tau.Transl Neurodegener. 2025 Jun 19;14(1):31. doi: 10.1186/s40035-025-00494-5. Transl Neurodegener. 2025. PMID: 40537859 Free PMC article.
References
-
- Goedert M, Spillantini MG, Tredici KD, Braak H. 100 years of Lewy pathology. Nat. Rev. Neurol. 2013;9:13. - PubMed
-
- Spillantini MG, et al. α-Synuclein in Lewy bodies. Nature. 1997;388:839–840. - PubMed
-
- Langston JW. The parkinson’s complex: Parkinsonism is just the tip of the iceberg. Ann. Neurol. 2006;59:591–596. - PubMed
-
- Goedert M, Clavaguera F, Tolnay M. The propagation of prion-like protein inclusions in neurodegenerative diseases. Trends Neurosci. 2010;33:317–325. - PubMed
-
- Braak H, et al. Staging of brain pathology related to sporadic Parkinson’s disease. Neurobiol. Aging. 2003;24:197–211. - PubMed
Grants and funding
LinkOut - more resources
Full Text Sources
Miscellaneous
