. 2023 Aug 28;14(8):570.
doi: 10.1038/s41419-023-06087-2.

Knockdown of Porf-2 restores visual function after optic nerve crush injury

Affiliations

Knockdown of Porf-2 restores visual function after optic nerve crush injury

Di Chen et al. Cell Death Dis. .

Abstract

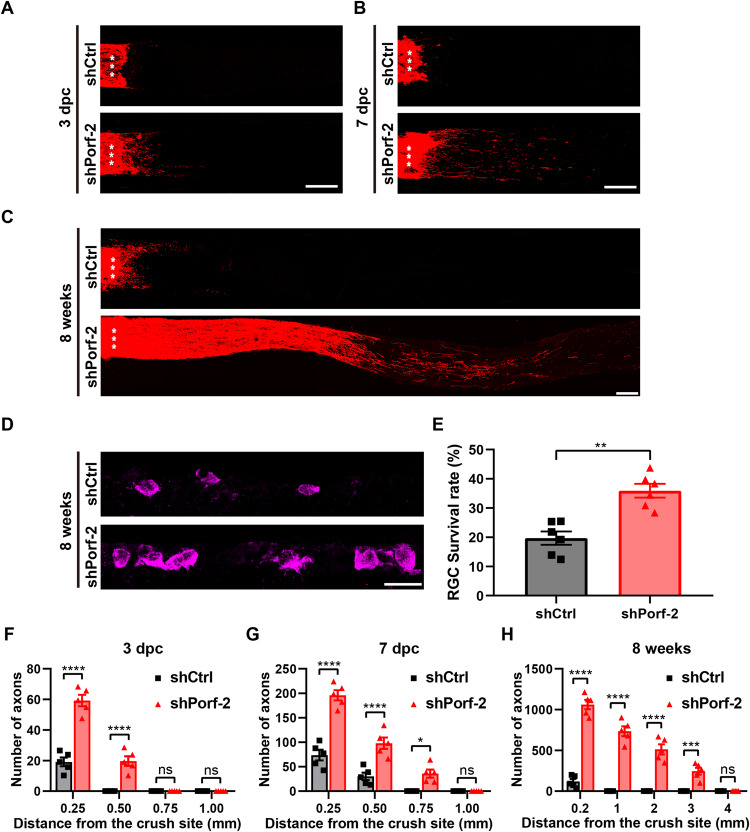
Retinal ganglion cells (RGCs), the sole output neurons in the eyes, are vulnerable to diverse insults in many pathological conditions, which can lead to permanent vision dysfunction. However, the molecular and cellular mechanisms that contribute to protecting RGCs and their axons from injuries are not completely known. Here, we identify that Porf-2, a member of the Rho GTPase activating protein gene group, is upregulated in RGCs after optic nerve crush. Knockdown of Porf-2 protects RGCs from apoptosis and promotes long-distance optic nerve regeneration after crush injury in both young and aged mice in vivo. In vitro, we find that inhibition of Porf-2 induces axon growth and growth cone formation in retinal explants. Inhibition of Porf-2 provides long-term and post-injury protection to RGCs and eventually promotes the recovery of visual function after crush injury in mice. These findings reveal a neuroprotective impact of the inhibition of Porf-2 on RGC survival and axon regeneration after optic nerve injury, providing a potential therapeutic strategy for vision restoration in patients with traumatic optic neuropathy.


Conflict of interest statement

The authors declare no competing interests.

Figures

Fig. 1
Fig. 1. Knockdown of Porf-2 promotes RGC survival and axon regeneration after ONC injury.
A Diagram of the experimental design. B Confocal images of optic nerves in young mice injected with AAV2-shPorf-2 (shPorf-2-RNA1 and shPorf-2-RNA2) or AAV2-shCtrl two weeks after ONC injury. Asterisks indicate the optic nerve crush site. Scale bar, 200 μm. C Quantification of optic nerve regeneration in (B) (two-way ANOVA followed by Bonferroni’s multiple-comparisons test, p < 0.0001 at 0.2, 0.50, and 1.00 mm from the crush site; n = 8 mice in each group). D Representative confocal images of retinal sections showing RBPMS+ RGCs (magenta) in young Porf-2-knockdown and control mice two weeks after ONC injury. Scale bar, 20 μm. E Quantification of the RGC survival rate in (D) (Mann–Whitney test, n = 6 mice in each group, at least eight non-adjacent retinal sections were analyzed for each mouse). F Confocal images of optic nerves in 12-month-old mice injected with AAV2-shPorf-2 (shPorf-2-RNA2) or AAV2-shCtrl two weeks after ONC injury. Asterisks indicate the optic nerve crush site. Scale bar, 200 μm. G Quantification of optic nerve regeneration in (F) (two-way ANOVA followed by Bonferroni’s multiple-comparisons test, p < 0.0001 at 0.2, 0.50, and 1.00 mm from the crush site; p < 0.01 at 1.5 mm from the crush site; n = 8 mice in each group). H Representative confocal images of retinal sections showing RBPMS+ RGCs (magenta) in 12-month-old Porf-2-knockdown (shPorf-2-RNA2) and control mice two weeks after ONC injury. Scale bar, 20 μm. I Quantification of the RGC survival rate in (H) (Mann–Whitney test, n = 6 mice in each group, at least eight non-adjacent retinal sections were analyzed for each mouse). Data are presented as the mean ± SEM. **p < 0.01,***p < 0.001, ****p < 0.0001. ns, not significant.
Fig. 2
Fig. 2. Knockdown of Porf-2 induces axon initiation and long-term axon regeneration after ONC injury.
A–C Representative confocal images of optic nerves in Porf-2-knockdown and control RGCs at 3 days, 7 days and 8 weeks post-ONC injury. Asterisks indicate the optic nerve crush site. Scale bar, 200 μm. D Representative confocal images of retinal sections showing RBPMS+ RGCs (magenta) from Porf-2 knockdown and control mice eight weeks after ONC injury. Scale bar, 20 μm. E Quantification of the RGC survival rate in D (Mann–Whitney test, p < 0.01; n = 6 mice in each group, at least eight non-adjacent retinal sections were analyzed for each retina). FH Quantification of optic nerve regeneration at 3 days, 7 days and 8 weeks post-ONC (two-way ANOVA followed by Bonferroni’s multiple-comparisons test, n = 5 mice in each group). Data are presented as the mean±SEM. *p < 0.05, **p < 0.01, ***p < 0.001,****p < 0.0001. ns, not significant.
Fig. 3
Fig. 3. Knockdown of Porf-2 accelerates axon growth and growth cone formation in retinal explants.
A Diagram of the experimental design. B Representative microphotographs of retinal explants stained with anti-beta III tubulin (Tuj1) showing neurite growth in AAV2-shCtrl and AAV2-shPorf-2 groups. Scale bar, 100 μm. C Quantification of neurites counted at different distances from the edges of the explants in (B) (two-way ANOVA followed by Bonferroni’s multiple-comparisons test, p < 0.0001 at 50, 100, 200, and 300 μm from the edges of the explants; p < 0.05 at 400 μm from the edges of the explants; n = 5 mice in each group). D Representative confocal images of neurites at the end of an axon in retinal explants from AAV2-shCtrl and AAV2-shPorf-2 groups stained with AAV2-EGFP (green), phalloidin (red), and Tuj1 (gray). Scale bar, 5 μm. E Percentage of growth cone-forming neurites in retinal explants in D (Mann–Whitney test, p < 0.01; n = 6 mice in each group, six to eight growth cones were analyzed for each retinal explant). Data are presented as the mean ± SEM. *p < 0.05, **p < 0.01, ****p < 0.0001. ns, not significant.
Fig. 4
Fig. 4. Porf-2 affects axon regeneration and growth cone formation by altering the activity of Rac1.
A Experimental timeline. Vehicle (Veh) or NSC23766 (NSC) was administered intraperitoneally once every two days after AAV2-shPorf-2 injection. B Confocal images of optic nerves from mice injected with AAV2-shPorf-2 14 days before ONC injury and treated with either Veh or NSC intraperitoneally. Asterisks indicate the optic nerve crush site. Scale bar, 200 μm. C Quantification of optic nerve regeneration in B (two-way ANOVA followed by Bonferroni’s multiple-comparisons test, p < 0.0001 at 0.20, 0.50, and 1.00 mm from the crush site; p < 0.05 at 1.50 mm from the crush site; n = 8 mice in each group). D Representative confocal images of retinal sections showing surviving RBPMS+ RGCs in the NSC-injected and control mouse groups. Scale bar, 20 μm. E Quantification of the RGC survival rate in D (Mann–Whitney test, p < 0.01; n = 6 mice in each group, at least eight non-adjacent retinal sections per mouse). F Experimental timeline. For in vivo studies, Veh or NSC was administered intraperitoneally once every two days after the AAV2-shPorf-2 injection. For in vitro experiments, Veh or NSC was added to the retinal explant medium, with the medium being changed once every two days. G Representative microphotographs of retinal explants stained with anti-beta III tubulin (Tuj1) showing neurite growth in Veh- or NSC-treated explants. Scale bar, 100 μm. H Quantification of neurites at different distances from the edges of the explants in (G) (two-way ANOVA followed by Bonferroni’s multiple-comparisons test, p < 0.0001 at 50, 100, 200, and 300 μm from the edges of the explants; p < 0.05 at 400 μm from the edges of the explants; n = 5 mice in each group). I Representative confocal images of neurites at the end of an axon in retinal explants from Veh- or NSC-treated groups stained with AAV2-EGFP (green), phalloidin (red), and Tuj1 (gray). Scale bar, 5 μm. J Percentage of growth cone-forming neurites in retinal explants in I (Mann–Whitney test, p < 0.01; n = 6 mice in each group, six to eight growth cones were analyzed for each retinal explant). Data are presented as the mean ± SEM. *p < 0.05, **p < 0.01, ****p < 0.0001. ns, not significant.
Fig. 5
Fig. 5. Knockdown of Porf-2 facilitates the recovery of visual function after ONC injury.
A Representative individual B-scan images (scan 1 at 0° in en face images) from AAV2-shCtrl-injected and AAV2-shPorf-2-injected mice before ONC injury and 3 weeks after ONC injury. A vertical caliper was placed on each side of the optic nerve head, 500 µm away from the center of the optic nerve head. The caliper was used to determine the thickness of the ganglion cell complex (GCC), comprising the three innermost retinal layers: the nerve fiber layer (NFL), the ganglion cell layer (GCL), and the inner plexiform layer (IPL). Scale bar, 200 µm. B Representative pSTR amplitudes from mice injected with AAV2-shCtrl or AAV2-shPorf-2 before ONC injury and 3 weeks after ONC injury. The pSTR amplitudes were assessed at a flash intensity of 3 × 10-5cd.sm-2. The pSTR was measured from the baseline to the positive peak of the waveform. Scale bar, 10 μV, 100 ms. C Representative pupil changes from mice injected with AAV2-shCtrl or AAV2-shPorf-2 before ONC injury and 8 weeks after ONC injury. The contraction of the pupil is the area of the pupil before light exposure minus the area of the pupil after light exposure, divided by the area of the pupil before light exposure. D Quantification of the thickness of the GCC in (A) (Mann Whitney test, p < 0.01; n = 6 mice in each group). E Quantification of the pSTR amplitudes in (B) (Mann–Whitney test, p < 0.01; n = 6 mice in each group). F Quantification of the pupil changes in (C) (Mann–Whitney test, p < 0.0001; n = 6 mice in each group). Data are presented as the mean ± SEM. **p < 0.01, ****p < 0.0001.
Fig. 6
Fig. 6. Knockdown of Porf-2 after ONC injury boosts RGC survival and axon regeneration.
A Diagram of the experimental design. B Representative confocal images of optic nerves from Porf-2-knockdown and control RGCs two weeks after ONC injury. Asterisks indicate the optic nerve crush site. Scale bar, 200 μm. C Quantification of optic nerve regeneration in (B) (two-way ANOVA followed by Bonferroni’s multiple-comparisons test, p < 0.0001 at 0.2, 0.5, and 1.0 mm from the crush site; p < 0.01 at 1.5 mm from the crush site; n = 8 mice in each group). D Representative confocal images of retinal sections showing RBPMS+ RGCs (magenta) from Porf-2 knockdown and control mice two weeks after ONC injury. Scale bar, 20 μm. E Quantification of the RGC survival rate in (D) (Mann–Whitney test, p < 0.01; n = 6 mice in each group, at least eight non-adjacent retinal sections were analyzed for each retina). Data are presented as the mean ± SEM. **p < 0.01, ****p < 0.0001. ns, not significant.

References

    1. Guo X, Zhou J, Starr C, Mohns EJ, Li Y, Chen EP, et al. Preservation of vision after CaMKII-mediated protection of retinal ganglion cells. Cell. 2021;184:1–16. doi: 10.1016/j.cell.2021.06.031. - DOI - PMC - PubMed
    1. Chen D, Sun YY, Zhou LY, Yang S, Hong FY, Liu XD, et al. Maf1 regulates axonal regeneration of retinal ganglion cells after injury. Exp Neurol. 2022;348:113948. doi: 10.1016/j.expneurol.2021.113948. - DOI - PubMed
    1. Jacobi A, Tran NM, Yan W, Benhar I, Tian F, Schaffer R, et al. Overlapping transcriptional programs promote survival and axonal regeneration of injured retinal ganglion cells. Neuron. 2022;110:2625–45.e7. doi: 10.1016/j.neuron.2022.06.002. - DOI - PMC - PubMed
    1. Lu Y, Brommer B, Tian X. Reprogramming to recover youthful epigenetic information and restore vision. Nature. 2020;588:124–9. doi: 10.1038/s41586-020-2975-4. - DOI - PMC - PubMed
    1. Benowitz LI, He Z, Goldberg JL. Reaching the brain: Advances in optic nerve regeneration. Exp Neurol. 2017;287:365–73. doi: 10.1016/j.expneurol.2015.12.015. - DOI - PubMed

Publication types