. 2023 Oct;4(10):1437-1454.
doi: 10.1038/s43018-023-00624-w. Epub 2023 Aug 28.

Tumor-specific cholinergic CD4+ T lymphocytes guide immunosurveillance of hepatocellular carcinoma

Affiliations

Tumor-specific cholinergic CD4+ T lymphocytes guide immunosurveillance of hepatocellular carcinoma

Chunxing Zheng et al. Nat Cancer. 2023 Oct.

Abstract

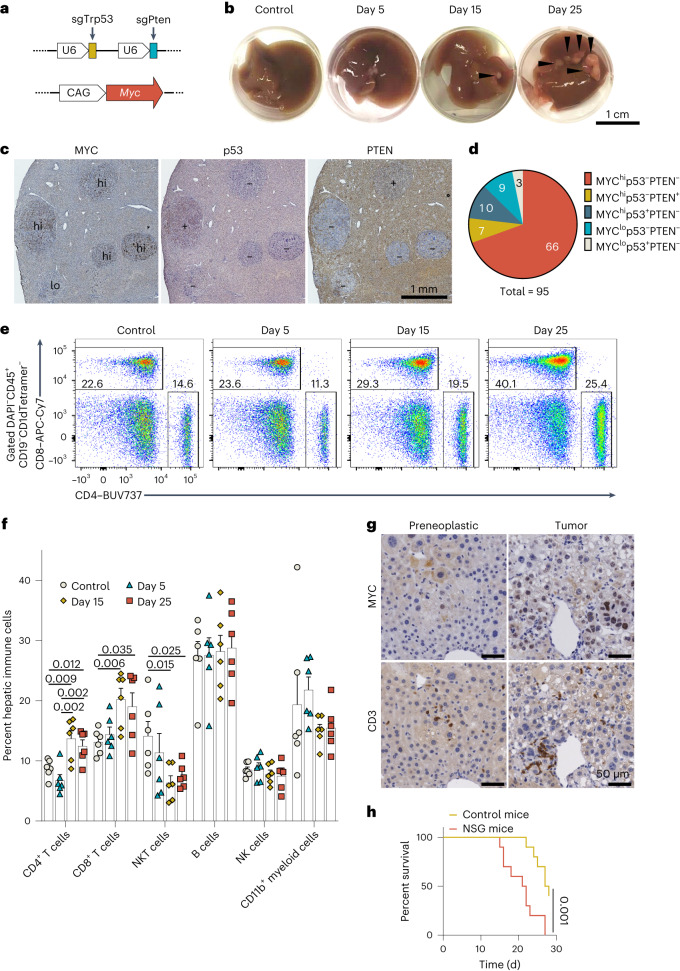
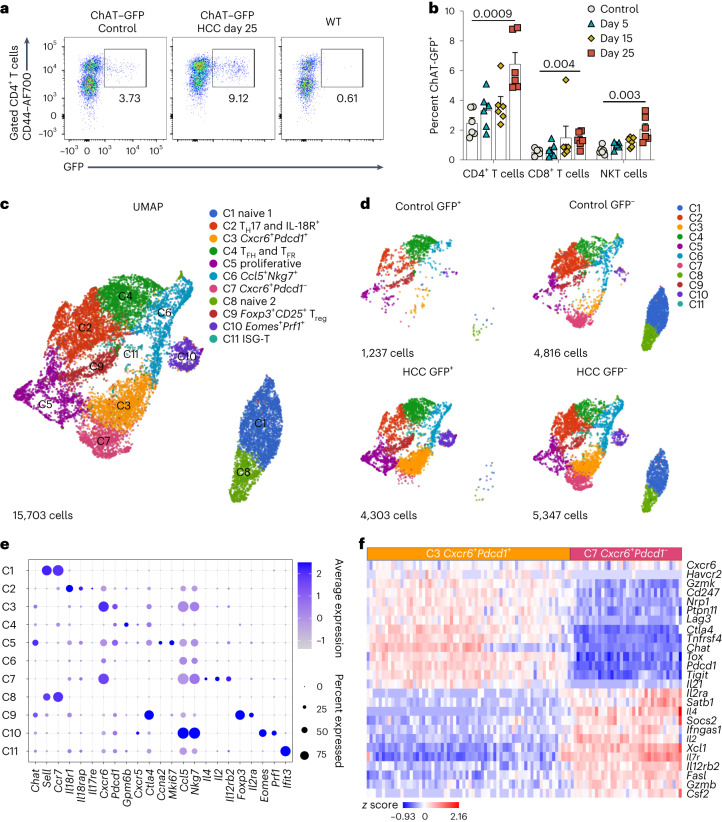
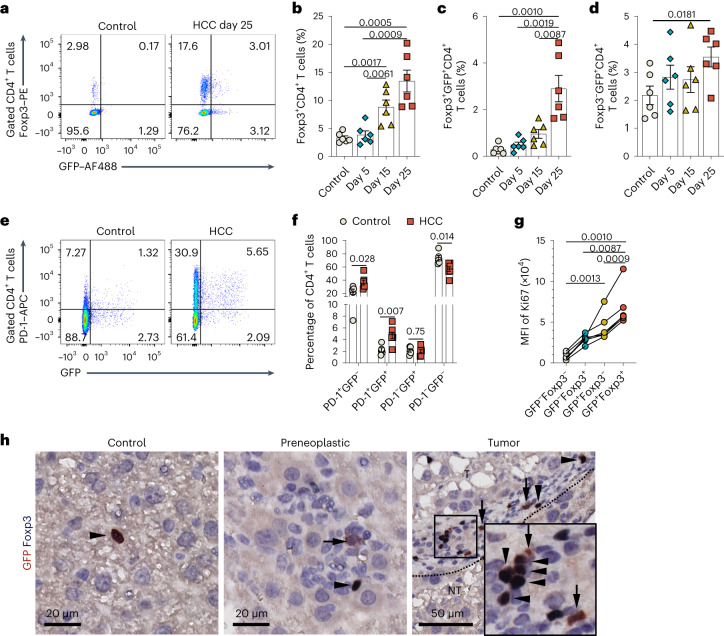
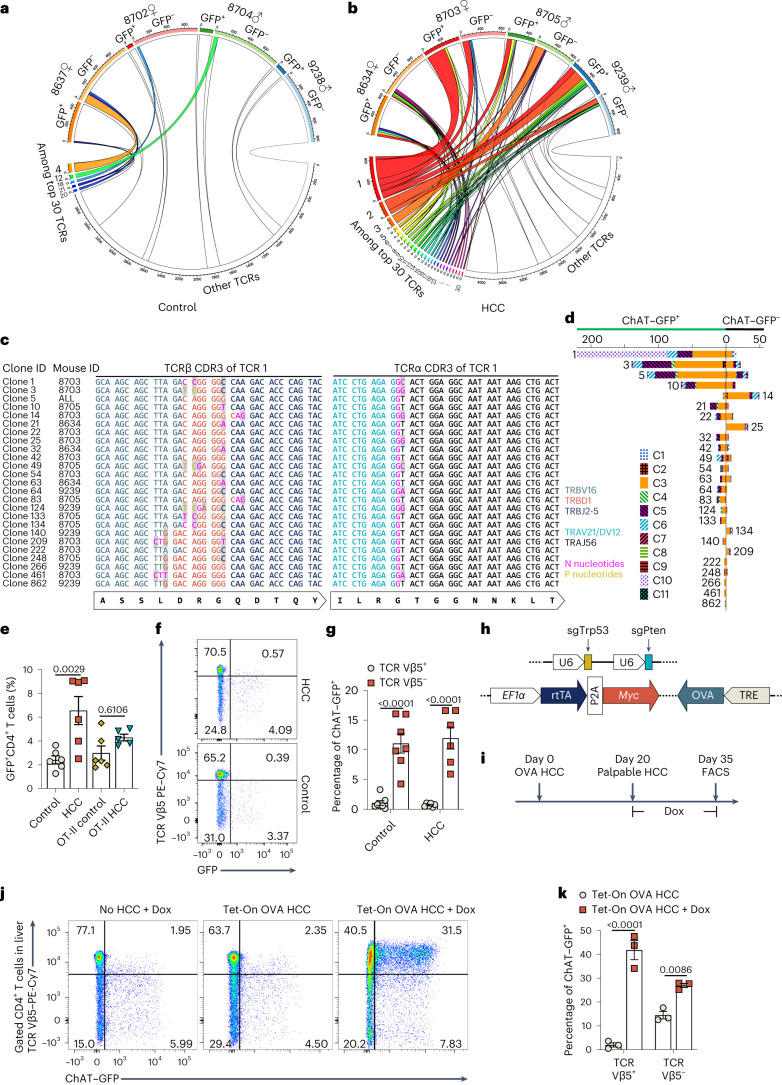
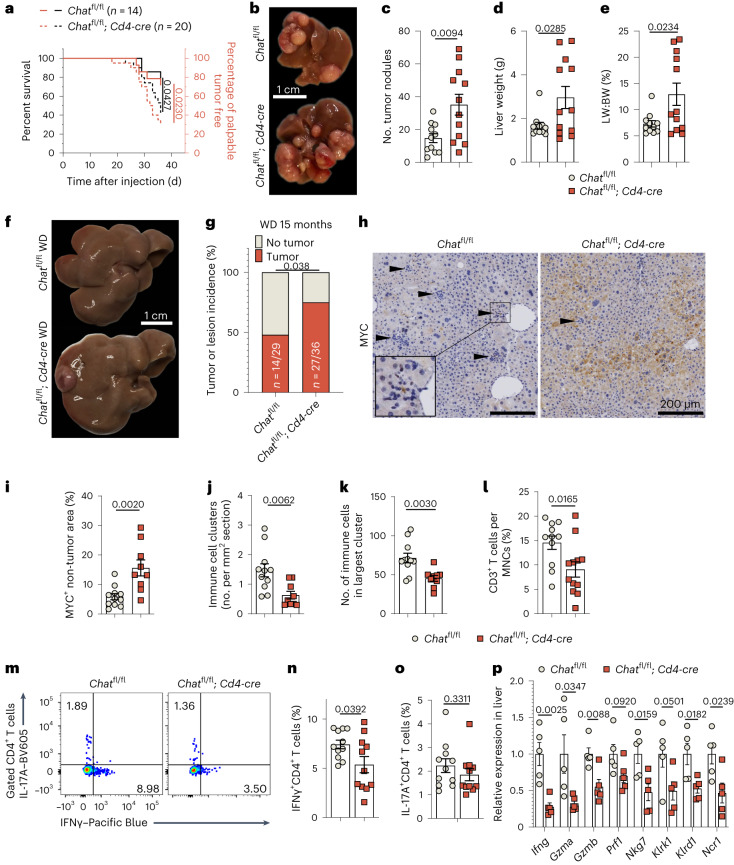
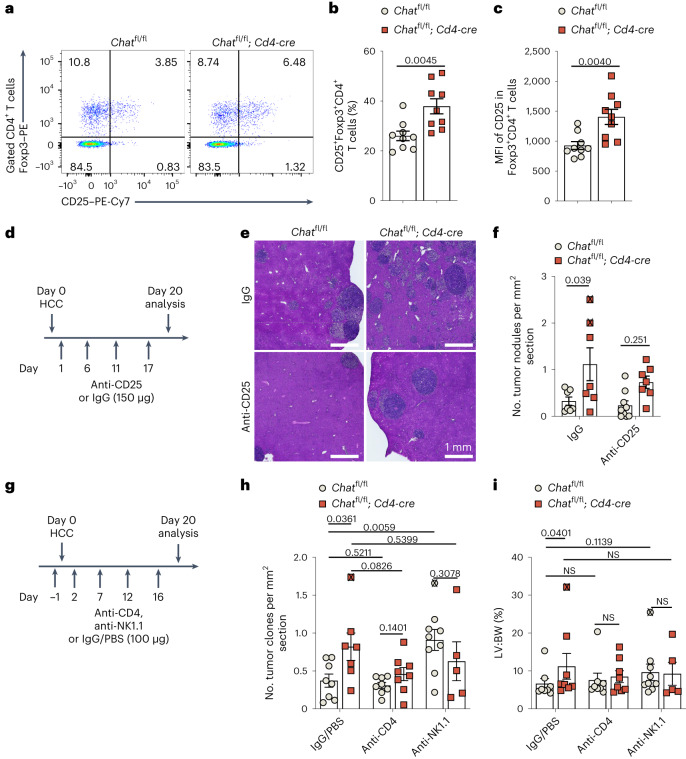
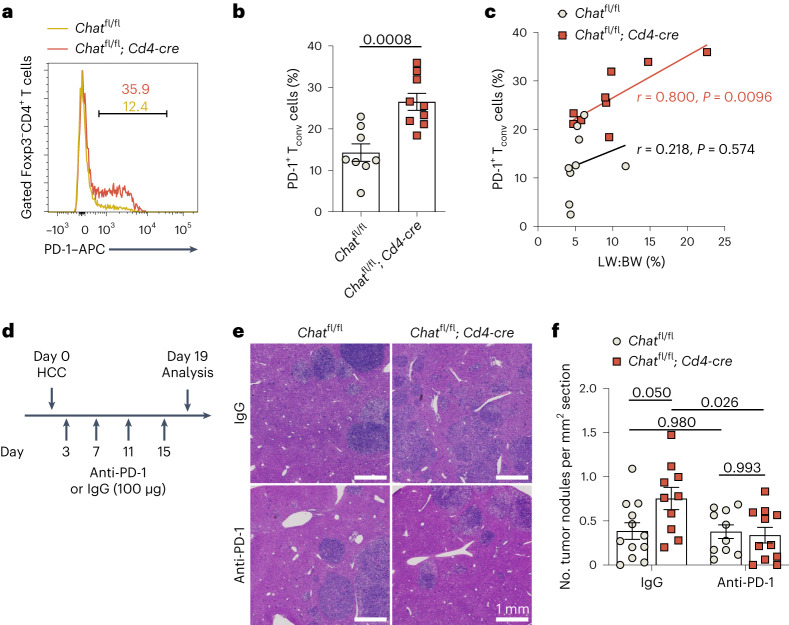
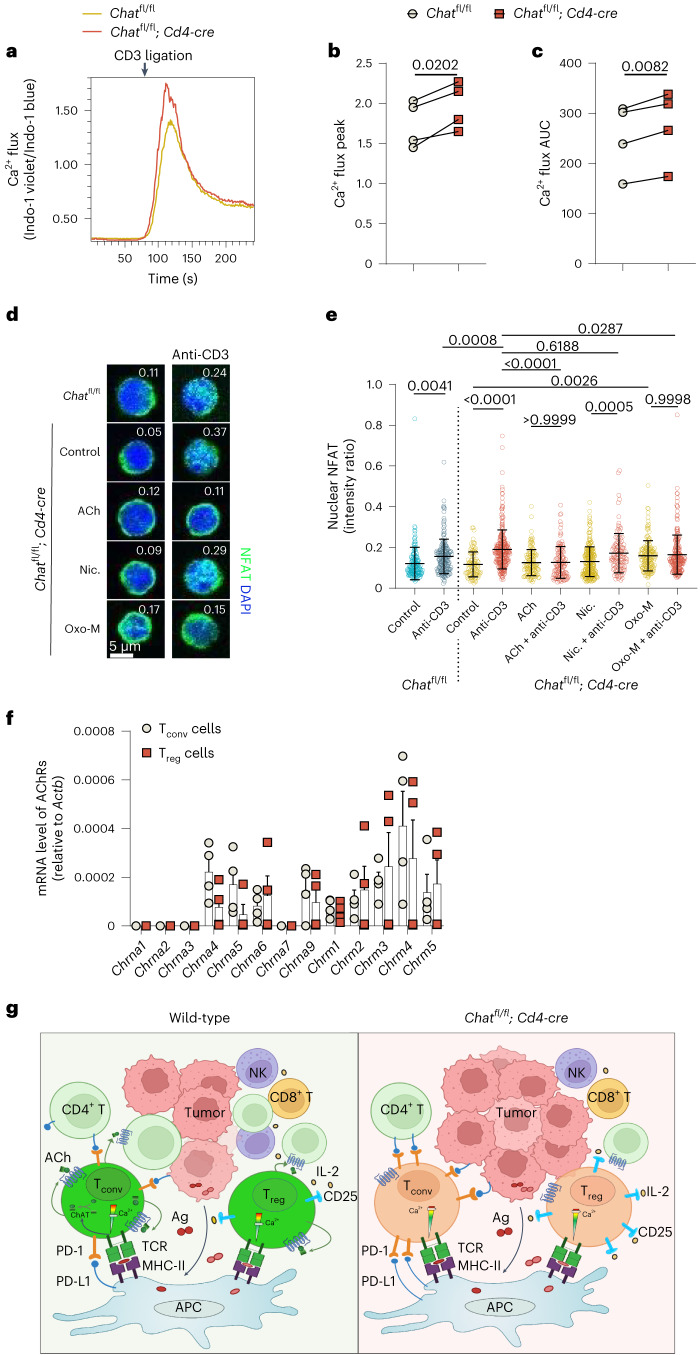
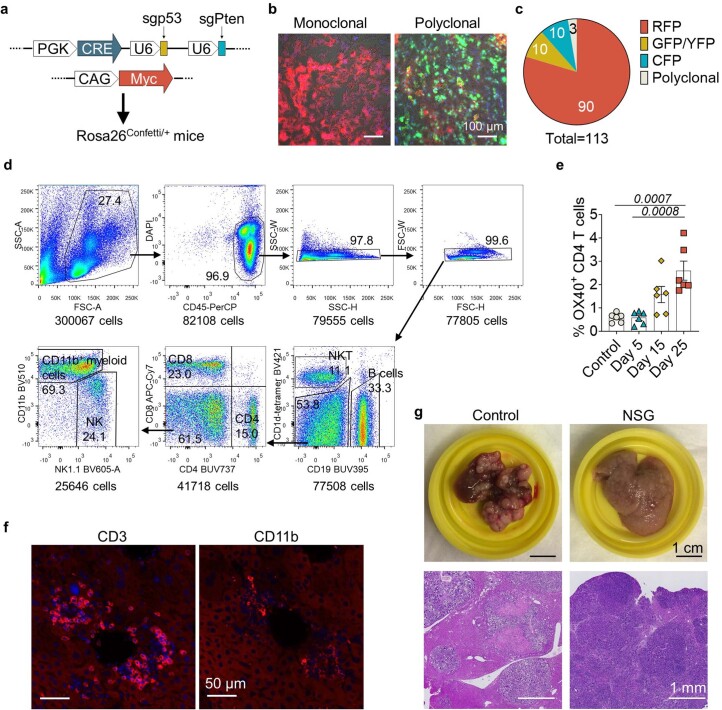
Cholinergic nerves are involved in tumor progression and dissemination. In contrast to other visceral tissues, cholinergic innervation in the hepatic parenchyma is poorly detected. It remains unclear whether there is any form of cholinergic regulation of liver cancer. Here, we show that cholinergic T cells curtail the development of liver cancer by supporting antitumor immune responses. In a mouse multihit model of hepatocellular carcinoma (HCC), we observed activation of the adaptive immune response and induction of two populations of CD4+ T cells expressing choline acetyltransferase (ChAT), including regulatory T cells and dysfunctional PD-1+ T cells. Tumor antigens drove the clonal expansion of these cholinergic T cells in HCC. Genetic ablation of Chat in T cells led to an increased prevalence of preneoplastic cells and exacerbated liver cancer due to compromised antitumor immunity. Mechanistically, the cholinergic activity intrinsic in T cells constrained Ca2+-NFAT signaling induced by T cell antigen receptor engagement. Without this cholinergic modulation, hyperactivated CD25+ T regulatory cells and dysregulated PD-1+ T cells impaired HCC immunosurveillance. Our results unveil a previously unappreciated role for cholinergic T cells in liver cancer immunobiology.


Conflict of interest statement

T.M. owns equity in Treadwell Therapeutics, Inc., and Agios Pharmaceuticals and is a consultant for AstraZeneca. All other authors have no competing interests.

Figures

Fig. 1
Fig. 1. Immunosurveillance is present in CRISPR- and transposon-induced HCC in mice.
a, Schematic diagrams of the plasmids used to induce CRISPR–Cas9-mediated deletion of Trp53 and Pten (top) and transposon-mediated overexpression of Myc in mouse livers (bottom). b, Representative macroscopic views of livers from mice injected with the combination of plasmids shown in a at the indicated days after injection. Control mice received transposase vector only. Arrowheads indicate tumor nodules. c, Representative histological sections of tumor-burdened livers immunostained to detect MYC, p53 and PTEN. Images are representative of two independent experiments. d, Distribution of immunostained liver tumor nodules from the livers in c. Numbers of tumor nodules with the indicated immunostaining patterns are labeled in the pie plot, which is a summary of two independent experiments. Sections were resected from three mice per group on day 25 of HCC induction. e,f, Representative flow cytometry plots (e) and quantification (f) showing changes in the percentages of the indicated immune cell populations during the development of liver cancer in mice. In f, each dot represents an individual mouse (n = 6 mice per condition). Data are shown as mean ± s.e.m. Significance was assessed by unpaired, two-tailed t-test, and data are representative of three independent experiments. Control mice received transposase vector only. g, Representative histological sections from HCC-bearing livers that were immunostained to detect MYC or CD3 in areas of either preneoplastic cells (left) or HCC cells (right). Images represent immunostaining of liver sections from ten mice in one experiment. h, Survival of immunodeficient (NSG) and control wild-type (WT) mice (n = 10 per group) following injection of Trp53/Pten CRISPR and Myc overexpression plasmids to induce HCC development. P = 0.001 by log-rank test. Source data
Fig. 2
Fig. 2. ChAT-expressing T cells are induced during HCC development.
a,b, Representative flow cytometry plots (a) and quantification (b) of GFP expression in the indicated T cell subsets during HCC progression in Chat-GFP reporter mice. In b, each dot represents an individual mouse (n = 6 mice per condition). Data are shown as mean ± s.e.m. P values were determined by unpaired, two-tailed t-test, and data are representative of three independent experiments. c,d, Transcriptional landscape of ChAT–GFP+ and ChAT–GFP CD4+ T cells in livers from control mice and mice with HCC. Uniform manifold approximation and projection (UMAP) representation of total hepatic CD4+ T cells (a total of 15,703 cells; c) and CD4+ T cells split according to GFP expression and HCC conditions (d) based on scRNA-seq analysis. ChAT–GFP+ and ChAT–GFP CD4+ T cells were sorted from four mice with HCC and from four control mice. Cells from each mouse were stained with unique barcoded antibodies; ISG-T, interferon-stimulated gene-expressing T cells. e, Bubble plot comparing expression of Chat and the indicated marker genes across the 11 clusters in c and d. f, Heat map depicting the relative expression of the indicated genes in cluster C3 (Cxcr6+Pdcd1+) and cluster C7 (Cxcr6+Pdcd1). Source data
Fig. 3
Fig. 3. Treg cells and PD-1+CD4+ T cells are overrepresented among HCC-induced ChAT-expressing T cells.
ad, Representative flow cytometric plots (a) and quantification (bd) of the percentages of the indicated CD4+ T cell subsets expressing Foxp3 and/or GFP in livers that were isolated on the indicated days from control or HCC-bearing Chat-GFP reporter mice. In bd, each dot represents an individual mouse (n = 6 per condition). Data are shown as mean ± s.e.m. P values were determined by unpaired, two-tailed t-test, and data are representative of three independent experiments. e,f, Representative flow cytometric plots (e) and quantification (f) of the percentages of the indicated CD4+ T cell subsets expressing PD-1 and/or GFP in livers from control (n = 5) or HCC-bearing (n = 7) Chat-GFP reporter mice. In f, each dot represents an individual mouse (n = 5 mice in control and n = 7 mice in HCC). Data are shown as mean ± s.e.m. P values were determined by unpaired, two-tailed t-test. Data represent the summary of three independent experiments. g, Quantitation of flow cytometric determination of Ki67 expression in ChAT–GFP+ and ChAT–GFP Tconv cells (Foxp3) and Treg cells (Foxp3+) in livers from HCC-bearing Chat-GFP mice. Each set of dots represents an individual mouse. P values were determined by paired two-tailed t-tests, and data are representative of three independent experiments. For ag, the control group received transposase vector only. h, Representative histological sections of livers from the mice in af immunostained to detect Foxp3 and GFP in normal liver tissue (control; left), liver areas containing preneoplastic cells (middle) or HCC cells (right). Images are representative of three independent experiments. The inset box on the right shows a higher magnification view of the smaller boxed area. Arrowheads denote cells with dual Foxp3 and GFP immunoreactivity, and arrows denote cells with GFP immunoreactivity only; T, tumor tissue; NT, non-tumor tissue. Source data
Fig. 4
Fig. 4. Tumor antigens drive clonal expansion of ChAT-expressing CD4+ T cells in HCC-bearing livers.
a,b, Circos plots showing the distribution of TCR types among GFP+ and GFP T cells from control (a) and HCC-bearing (b) mice. T cells of the same TCR type share TCRα and TCRβ chains of the same amino acid sequences. The top 30 TCRs are numbered and highlighted with different colors. c, CDR3 sequences of clonotypes encoding TCR 1. V, D and J segments and N nucleotides and P nucleotides at V(D)J junctions are denoted with different colors. Nucleotides that are mismatched between clonotypes are shaded. d, Composition of ChAT–GFP+ and ChAT–GFP cells among T cells bearing the indicated TCR 1 clonotypes color-coded by cell clusters. Each bar represents an individual clonotype and is labeled with the clone ID as shown in c. Horizontal axis labels indicate cell numbers. e, Percentage of ChAT–GFP+ cells among CD4+ T cells from normal or HCC-bearing livers of Chat-GFP or Chat-GFP; OT-II mice (n = 6 in the control, HCC and OT-II control groups; n = 5 in the OT-II HCC group). Statistical significance was assessed by one-way analysis of variance (ANOVA) with Tukey’s multiple comparisons test, and data are representative of three independent experiments. f,g, Representative flow cytometry plots (f) and quantification (g) of percentages of ChAT–GFP+ cells among CD4+ T cells expressing TCR Vβ5+ (transgenic TCR) or TCR Vβ5 (natural TCRs) in livers of Chat-GFP; OT-II mice (n = 7 in control; n = 6 in HCC). h, Plasmids for simultaneous CRISPR–Cas9-mediated deletion of Trp53/Pten plus overexpression of Myc and tetracycline-on (Tet-On) inducible OVA. i, Experimental protocol for inducing OVA expression. Dox was added to drinking water following palpable HCC onset; FACS, fluorescence-activated cell sorting. j,k, Representative flow cytometry plots (j) and quantification (k) of percentages of ChAT–GFP+ cells among CD4+ T cells expressing TCR Vβ5+ or TCR Vβ5 in livers of mice that were left untreated or treated with Dox-containing drinking water following HCC onset. Data are the summary of two independent experiments (n = 3 mice per group). In e, g and k, each dot represents an individual mouse. Data are shown as mean ± s.e.m. In g and k, P values were determined by two-way ANOVA with Sidak’s multiple comparisons test. Source data
Fig. 5
Fig. 5. Ablation of Chat in T cells inhibits the immunosurveillance of liver cancer in mice.
a, Curves showing latency to palpable HCC development (left, black lines) and survival to humane endpoint (right, red lines) of Chatfl/fl (n = 14) and Chatfl/fl; Cd4-cre (n = 20) mice. P values were determined by log-rank (Mantel–Cox) test, and data are representative of two independent experiments. be, Representative images (b), numbers of tumor nodules (c), liver weights (d) and ratios of liver weight (LW) to body weight (BW; e) of mice on day 35 of HCC induction. For ce, n = 11 mice in the Chatfl/fl group and n = 12 mice in Chatfl/fl; Cd4-cre group; data are representative of five independent experiments. f,g, Representative images (f) and quantification (g) of tumor incidence in mice fed for 15 months on a Western diet (WD). P values were determined by Fisher’s exact test. h,i, Representative histological sections (h) and quantification (i) of immunostaining to detect MYC+ preneoplastic cells in non-tumor areas of liver sections from the mice in be. In i, n = 11 Chatfl/fl mice and n = 9 Chatfl/fl; Cd4-cre mice. The inset box in h shows a higher-magnification view of the smaller boxed area. Arrowheads indicate immune cell clusters. j,k, Quantification of the number (j) and size (k) of immune cell clusters in hematoxylin and eosin (H&E)-stained sections of livers from the mice in be (n = 11 Chatfl/fl mice and n = 9 Chatfl/fl; Cd4-cre mice). l, Percentage of CD3+ T cells among MNCs isolated from HCC-bearing livers as assessed by flow cytometry (n = 11 Chatfl/fl mice and n = 12 Chatfl/fl; Cd4-cre mice); data are representative of three independent experiments. mo, Representative flow cytometry plots (m) and quantification of IFNγ+CD4+ (n) and IL-17A+CD4+ T cells (o) in HCC-bearing livers (n = 11 mice per group); data are representative of two independent experiments. p, Quantitative PCR (qPCR) determination of mRNA levels (relative to Actb) of the indicated cytotoxicity genes and NK cell marker genes in HCC-bearing livers (n = 5 mice per group); data are representative of two independent experiments. For ce, il and np, each dot represents an individual mouse. Data are shown as mean ± s.e.m., and P values were determined by unpaired, two-tailed t-tests. Source data
Fig. 6
Fig. 6. T cell-specific loss of Chat causes alterations to Treg cells that are linked to compromised antitumor immunity.
ac, Representative flow cytometry plots (a), quantification of the percentages of Foxp3+CD4+ T cells expressing CD25 (b) and the CD25 mean fluorescent intensity (MFI; c) in HCC-bearing livers from Chatfl/fl and Chatfl/fl; Cd4-cre mice on day 35 of HCC induction (n = 9 mice per group). P values were determined by unpaired, two-tailed t-test; data are representative of two independent experiments. d, Experimental protocol used to deplete CD25-expressing Treg cells during HCC induction. e,f, Representative low-magnification histological images of H&E-stained sections (e) and quantification of numbers of tumor nodules per mm2 in these sections (f) of livers from Chatfl/fl and Chatfl/fl; Cd4-cre mice treated as in d. In f, n = 7 mice in the Chatfl/fl + IgG, Chatfl/fl + anti-CD25 and Chatfl/fl; Cd4-cre + anti-CD25 groups, and n = 9 mice in the Chatfl/fl + anti-CD25 group. P values were determined by two-way ANOVA with Tukey’s multiple comparisons tests. The ‘X’ symbols indicate animals that reached the humane endpoint before day 20. g, Experimental protocol used to deplete CD4+ T cells and NK cells during HCC induction. Each mouse received 100 μg of depleting antibody per injection. Mice in the control group received either 100 μg of rat IgG or PBS. h,i, Quantification of numbers of tumor nodules per mm2 in H&E-stained sections (h) and ratios of liver weight to body weight (i) of Chatfl/fl and Chatfl/fl; Cd4-cre mice treated as in g. The ‘X’ symbols indicate animals that reached the humane endpoint before day 20. In h, n = 8 mice in the Chatfl/fl + IgG/PBS and anti-CD4 groups; n = 7 mice in the Chatfl/fl; Cd4-cre + IgG/PBS group; n = 9 mice in the Chatfl/fl + anti-NK1.1 group; and n = 5 mice in the Chatfl/fl; Cd4-cre + anti-NK1.1 group. In i, n = 8 mice in the IgG/PBS and anti-CD4 groups; n = 9 mice in the Chatfl/fl + anti-NK1.1 group; and n = 5 mice in the Chatfl/fl; Cd4-cre + anti-NK1.1 group. In b, c, f, h and i, each dot represents an individual mouse. Data are shown as means ± s.e.m. P values in h were determined by paired, two-tailed t-tests. P values in i were determined by two-tailed Mann–Whitney test because the Chatfl/fl group did not pass the normality test; NS, not significant. Source data
Fig. 7
Fig. 7. PD-1 inhibitory activity is unleashed in the absence of Chat in T cells in HCC.
a,b, Representative flow cytometry histogram overlay plot (a) and quantification of the percentages of Foxp3CD4+ Tconv cells expressing PD-1 (b) in HCC-bearing livers from Chatfl/fl and Chatfl/fl; Cd4-cre mice. Each dot represents an individual mouse (n = 8 Chatfl/fl mice and n = 9 Chatfl/fl; Cd4-cre mice). Data are shown as mean ± s.e.m. The P value was determined by unpaired, two-tailed t-test. c, Correlation of PD-1 expression in Tconv cells with HCC grade in Chatfl/fl and Chatfl/fl; Cd4-cre mice. HCC grade is represented by the ratio of liver weight to body weight. P values were determined by two-tailed Pearson correlation. d, Experimental protocol used for PD-1 blockade in vivo in Chatfl/fl and Chatfl/fl; Cd4-cre mice subjected to standard HCC induction. e,f, Representative low-magnification histological images of H&E-stained sections (e) and quantification of numbers of tumor nodules per mm2 in these sections (f) of livers from Chatfl/fl and Chatfl/fl; Cd4-cre mice treated as in d. In f, each dot represents an individual mouse (n = 12 mice in the Chatfl/fl + IgG group, n = 10 mice in the Chatfl/fl + anti-PD-1 and Chatfl/fl; Cd4-cre + IgG groups, and n = 11 mice in the Chatfl/fl + anit-PD-1 group). Data are shown as mean ± s.e.m. P values were determined by two-way ANOVA with Tukey’s multiple comparisons test. Source data
Fig. 8
Fig. 8. TCR-induced Ca2+–NFAT signaling is restrained by cholinergic activity in T cells.
ac, Representative overlaid kinetics plots of flow cytometry curves (a), quantification of Ca2+ influx peaks (b) and ‘area under curve’ (AUC; c) for the Ca2+ flux occurring in Chatfl/fl and Chatfl/fl; Cd4-cre CD4+ T cells. In b and c, each dot represents T cells from an individual mouse. Chatfl/fl and Chatfl/fl; Cd4-cre littermates of both sexes across various ages were paired for analysis, with at least two measurements taken per mouse. P values were determined by paired, two-tailed t-test; data are a summary of two independent experiments. d,e, Representative fluorescence micrographs (d) and quantification (e) of NFAT immunofluorescent staining of splenic CD4+ T cells purified from Chatfl/fl and Chatfl/fl; Cd4-cre mice. Ratios of nuclear NFAT to cytoplasmic NFAT are displayed in each image in d and are statistically compared in e. Each dot in e represents one cell (n = 160 control Chatfl/fl T cells; n = 180 anti-CD3-treated Chatfl/fl T cells; n = 101 control Chatfl/fl; Cd4-cre T cells; and n = 269, 128, 119, 246, 114, 157 and 212 Chatfl/fl; Cd4-cre T cells treated with anti-CD3, ACh, ACh + anti-CD3, nicotine (Nic), nicotine + anti-CD3, Oxo-M or Oxo-M + anti-CD3). Data are shown as mean ± s.e.m. P values were determined by one-way ANOVA with Tukey’s multiple comparisons test and are representative of two independent experiments. f, qPCR determination of mRNA levels (relative to Actb) of the indicated nAChR (Chrna1Chrna9) and mAChR (Chrm1Chrm5) genes in Tconv and Treg CD4+ T cells sorted from livers of HCC-bearing Foxp3-YFP mice (n = 4); data are representative of three independent experiments. g, Diagram summarizing our proposed model of ChAT function in T cells during HCC. In wild-type mice, HCC antigens induce the expression of ChAT in T cells. Autocrine/paracrine cholinergic signaling by ChAT-expressing T cells influences T cell Ca2+ homeostasis and regulates TCR-induced Ca2+ signaling. Without such cholinergic modulation (as occurs in Chatfl/fl; Cd4-cre mice), TCR-induced Ca2+ signaling is hyperactivated, leading to T cell exhaustion, overexpression of PD-1 in Tconv cells and increased CD25 in Treg cells. The inhibitory activity of PD-1 is unleashed, and Treg-mediated suppression is enhanced, compromising antitumor responses mounted by NK cells and Tconv cells. In the absence of ChAT, HCC progression proceeds unabated; Ag, antigen; MHC-II, major histocompatibility complex class II. Source data
Extended Data Fig. 1
Extended Data Fig. 1. The immunosurveillance of murine liver cancer.
a Schematic diagrams of the plasmids used to simultaneously induce CRISPR/Cas9-mediated deletion of Trp53 and Pten, Cre expression, and Myc overexpression in Rosa26Confetti/+ reporter mice. b Representative fluorescence microscopy images depicting (left) a monoclonal and (right) a polyclonal tumor from the livers of the mice in (a). Clonality was determined based on the expression of one or multiple fluorescent markers encoded by the Rosa26Confetti reporter, representative of one experiment. c Quantification of monoclonal and polyclonal tumors expressing the indicated fluorescent markers in livers from the mice in (a). Numbers of tumor nodules expressing the indicated fluorescent marker(s) are labeled in the pie plot. Data are from examination of 113 tumor nodules in liver sections from 10 Rosa26Confetti reporter mice. d Gating strategy used for flow cytometric analysis of murine hepatic immune cells. e Percentage of OX40+ CD4+ T cells in livers on the indicated days of liver cancer development. Each dot represents an individual mouse (n=6 mice per group). Data are the mean ± SEM. P values were determined by unpaired, two-tailed t-test. f Representative immunofluorescence images showing CD3 and CD11b expression in adjacent sections of an HCC-bearing liver, representative of one experiment. g Representative macroscopic images (upper) and microscopic images (lower) of tumor-bearing livers resected at the humane endpoint from NSG and control mice subjected to HCC induction, representative of one experiment. Related to Fig. 1. Source data
Extended Data Fig. 2
Extended Data Fig. 2. Identification of cholinergic cells in liver cancer.
a Representative histological sections showing GFP immunoreactivity in (left) small intestine, (middle) normal liver, and (right) HCC-bearing liver resected from Chat-GFP mice. Arrowheads, cells with GFP immunoreactivity. Inset boxes show higher magnification views of the GFP+ cells in the small boxes. Scale bars, 100 μm. T, tumor tissue. NT, non-tumor tissue. The micrographs displayed are representative of sections obtained from three independent experiments. b Percentage of GFP+ cells among the indicated cell subsets in livers of Chat-GFP mice at the indicated time points following HCC induction. Each dot represents an individual mouse (n=6 mice per group). Data are the mean ± SEM. n.s., not significant by unpaired, two-tailed t-test was performed. Results are representative of three independent experiments. c qPCR determinations of Chat mRNA levels (relative to Actb) in hepatic mononuclear cells of Chat-GFP mice at the indicated time points following standard HCC induction. Each dot represents an individual mouse. P values were determined by unpaired, two-tailed t-test. d Expression of Foxp3 in CD4+ T cells from control and HCC-bearing livers as determined in the scRNAseq UMAP plot shown in Fig. 2c. e Volcano plot comparing transcripts between Foxp3 mRNA-expressing cells from cluster 4 and those from cluster 9. Gene-set analysis (GSA) was performed to identify sets of differentially expressed genes. f Percentages of Foxp3 mRNA+ cells among Chat mRNA+ CD4+ T cells and Chat mRNA- CD4+ T cells from HCC-bearing livers as determined from scRNAseq data. Cells from each mouse were identified using antibody barcodes. Each dot represents an individual mouse (n=4 mice per group). Data are the mean ± SEM. P values were determined by unpaired, two-tailed t-test. g Representative flow cytometry plots showing the expression of PD-L1 by CD4+ T cells, CD45+CD3- immune cells and CD45- cells from HCC-bearing liver. Related to Fig. 2. Source data
Extended Data Fig. 3
Extended Data Fig. 3. Identification of CHAT-expressing T cells in human HCC.
a,b Violin plots showing the expression of CHAT in the indicated clusters of T cells that were isolated from tumor tissue (a) and adjacent liver tissue (b) of HCC patients. Data are from a published single-cell RNAseq dataset on immune cells of HCC patients (GSE140228). Related to Fig. 2. Source data
Extended Data Fig. 4
Extended Data Fig. 4. Expression of Chat by clonally expanded PD-1+ Tconvs and Foxp3+ Tregs in HCC.
a UMAP representation of Chat-GFP+ and Chat-GFP- CD4+ T cells bearing TCR #1 induced in HCC, color-coded by cell clusters and shape-coded by mouse ID. b UMAP representation of Chat-GFP+ and Chat-GFP- CD4+ T cells bearing TCR #22 induced in HCC, color-coded by expression level of Foxp3 and shape-coded by mouse ID. c UMAP representation of Chat-GFP+ and Chat-GFP- CD4+ T cells bearing TCR #3 induced in HCC, color-coded by cell clusters (upper) and expression levels of Cxcr6, Pdcd1, and Foxp3 (lower), and shape-coded by mouse ID. Related to Fig. 4.
Extended Data Fig. 5
Extended Data Fig. 5. Induction of OVA specific Chat-GFP+ Tregs and PD-1+ Tconvs in HCC with inducible OVA expression.
a Representative flow cytometry plots showing the expression of Foxp3 and PD-1 in OVA-specific Chat-GFP+CD4+ T cells in livers of mice that were left untreated or treated with Dox-containing drinking water to induce OVA expression following HCC onset, representing two independent experiments. Related to Fig. 4.
Extended Data Fig. 6
Extended Data Fig. 6. Analysis of the efficiency of vector delivery and T cell activities in HCC.
a,b Representative fluorescence microscopy images (a), and quantification of the proportion of hepatocytes positive for the Rosa26Confetti RFP marker (b), in liver sections from Rosa26Confetti/+;Chatfl/fl and Rosa26Confetti/+;Chatfl/fl;CD4-Cre mice on the indicated days following plasmid injection. In (b), each dot represents a microscopy image (n=6, 11, and 9 acquired on days 1, 3, and 10 from Rosa26Confetti/+;Chatfl/fl mice; n=5, 12, and 11 acquired on days 1, 3, and 10 from Rosa26Confetti/+;Chatfl/fl;CD4-Cre mice. Images were collected from 2-4 mice/group). Data are the mean ± SEM. P values were determined by two-way ANOVA with Tukey’s multiple comparisons test. c qPCR determination of transposon-derived Myc mRNA expression (relative to Actb) in livers of Chatfl/fl and CD4-Cre;Chatfl/fl mice at the indicated time points following HCC induction. The forward primer used was within the Myc ORF, with the reverse primer in the transposon vector. Each dot represents an individual mouse (n=6 Chatfl/fl mice in Control group, and n=2, 4, 3 and 5 Chatfl/fl mice on days 1, 3, 10, and 23; n=2, 4, 4, and 5 Chatfl/fl;CD4-Cre mice on days 1, 3, 10 and 23). Data are the mean ± SEM. P values were determined by two-way ANOVA with Sidak’s multiple comparisons test. d,e Percentages of CD4+ T cells (d) and CD8+ T cells (e) among mononuclear cells (MNCs) isolated from HCC-bearing livers of Chatfl/fl and CD4-Cre;Chatfl/fl mice as assessed by flow cytometry, representative of three independent experiments. Each dot represents an individual mouse (n=11 mice in Chatfl/fl and n=12 mice in Chatfl/fl;CD4-Cre). Data are the mean ± SEM. P values were determined by unpaired, two-tailed t-test. f Percentage of IFN-γ+ CD8+ T cells in HCC-bearing livers of Chatfl/fl and Chatfl/fl;CD4-Cre mice as analyzed by flow cytometry. Each dot represents an individual mouse. Each dot represents an individual mouse (n=11 mice in each group). Data are the mean ± SEM. P values were determined by unpaired, two-tailed t-test. Related to Fig. 5. Source data
Extended Data Fig. 7
Extended Data Fig. 7. Delineating the role of the adaptive immune response in HCC development.
a Schematic diagrams of (left) the plasmids used to induce simultaneous CRISPR/Cas9-mediated deletion of Trp53 and Pten plus overexpression of Myc and chicken ovalbumin (OVA), and (right) the experimental protocol for OVA immunization and OVA-HCC induction in mice. See main text for details. b,c Curves showing the latency to palpable HCC development (b), and survival to humane endpoint (c), of Chatfl/fl and Chatfl/fl;CD4-Cre mice that were left unimmunized, or immunized as depicted in panel (a), and subjected to OVA-HCC induction (n=14, 13, 21, and 21 mice in the Chatfl/fl, Chatfl/fl;CD4-Cre, Chatfl/fl immunized and Chatfl/fl;CD4-Cre immunized groups, respectively). P values were determined by log-rank test. d,e Percentage of CD8+ T cells among MNCs (d), and number of tumor nodules observed in histological sections (e), in HCC-bearing livers of mice treated with anti-CD8 antibodies (α-CD8) or IgG control. Each dot represents an individual mouse (n=8 mice per group). Data are the mean ± SEM. In (d), P value was determined by unpaired, two-tailed t-test. f,g Number of HCC tumor nodules (f), and weights (g) of livers from mice of the indicated genotypes on day 23 of HCC induction. Each dot represents an individual mouse (n=4, 5, 5, and 6 mice in the Rag1+/-, Rag1-/-, Chatfl/fl and Chatfl/fl;CD4-Cre groups, respectively). Data are the mean ± SEM. P values were determined by paired, two-tailed t-test. Related to Fig. 6. Source data
Extended Data Fig. 8
Extended Data Fig. 8. Delineating the effects of Chat on Tregs in HCC.
a Percentage of Foxp3+ Tregs among CD4+ T cells in HCC-bearing livers of Chatfl/fl and CD4-Cre;Chatfl/fl mice, representative of three independent experiments. Each dot represents an individual animal (n=11 mice in Chatfl/fl and n=12 mice in Chatfl/fl;CD4-Cre). b-d Representative flow cytometry plots (b), and quantification of the percentages of CTLA-4+ cells among Tregs (c) and Tconvs (d), in HCC-bearing livers from Chatfl/fl and Chatfl/fl;CD4-Cre mice on day 16 of HCC induction. In (c) and (d), each dot represents an individual mouse (n=6 mice per group). e Quantification of the percentages of induced CD25+ cells among Foxp3+CD4+ Tregs and Foxp3-CD4+ Tconvs isolated from purified splenic CD4+CD25- T cells of Chatfl/fl and Chatfl/fl;CD4-Cre mice. CD4+CD25- T cells were enriched with negative selection microbeads and stimulated with the indicated ratios of anti-CD3/28 microbeads. CD25 expression was analyzed by flow cytometry at the indicated time points. P values were determined by unpaired, two-tailed t-test, three replicates for each condition, representative of two independent experiments. f Representative flow cytometric plots of CD25+ Foxp3+ CD4+ Tregs in blood of Foxp3-YFP mice that were treated with either anti-CD25 antibody (α-CD25) or control IgG. Data are representative of 2 mice/group analyzed on day 18 of antibody treatment. g,h Percentage of CD4+ T cells (g) and NK cells (h) among MNCs from HCC-bearing livers of mice treated with anti-CD4 antibodies (α-CD4), anti-NK1.1 antibodies (α-NK1.1) or IgG/PBS control. Each dot represents an individual mouse (n=8 mice in the IgG/PBS group; n=9 mice in α-CD4 and α-NK1.1 groups). i,j Quantification of numbers of tumor nodules/mm2 in H&E-stained sections (i), and percentages of CD25+ Tregs in HCC-bearing livers (j), of Foxp3Cre and Chatfl/fl;Foxp3Cre mice on day 22 of HCC induction. Each dot represents an individual mouse. In (i), n=8 mice in the Foxp3Cre group and n=7 mice in the Chatfl/fl;Foxp3Cre group. In (j), n=8 mice in Foxp3Cre and n=6 mice in Chatfl/fl;Foxp3Cre. In (a), (c), (d), and (g-j), data are the mean ± SEM. P values were determined by unpaired, two-tailed t-test. Related to Figs. 6 and 7. Source data
Extended Data Fig. 9
Extended Data Fig. 9. Elucidating the effects of Chat on inhibitory immunoreceptor expression by T cells in HCC.
a-f Expression levels of the immune inhibitory receptors PD-1, Tim-3 and Lag-3 in CD4+ T cells (a-c), and in CD8+ T cells (d-f), from HCC-bearing livers of Chatfl/fl and Chatfl/fl;CD4-Cre mice on day 35 of HCC induction. Each dot represents an individual mouse (n=11 mice in Chatfl/fl and n=12 mice in Chatfl/fl;CD4-Cre). Data are the mean ± SEM. P values were determined by unpaired, two-tailed t-test. Related to Fig. 7. Source data
Extended Data Fig. 10
Extended Data Fig. 10. Cholinergic signaling is associated with human HCC.
a Violin plots showing the expression of CHAT and the indicated muscarinic acetylcholine receptors and nicotinic acetylcholine receptors (alpha subunits) in T cells isolated from patient HCC samples (GSE98638). b-d Survival of HCC patients with high expression of CHRM3 (b), CHRM5 (c), or both CHRM3 and CHRM5 (d). Data are from the TCGA database. e,f Ratios of liver weight to body weight (e) and numbers of tumor nodules (f) of Chatfl/fl and Chatfl/fl;CD4-Cre mice on day 20 of HCC induction with standard vectors or plus vectors carrying gRNAs for Chrm3 and Chrm5. Each dot represents an individual mouse (n=7 mice per group). Data are the mean ± SEM. n.s., not significant, determined by unpaired, two-tailed t-test. Source data

References

    1. Sung H, et al. Global Cancer Statistics 2020: GLOBOCAN estimates of incidence and mortality worldwide for 36 cancers in 185 countries. CA Cancer J. Clin. 2021;71:209–249. doi: 10.3322/caac.21660. - DOI - PubMed
    1. Mittal S, El-Serag HB. Epidemiology of hepatocellular carcinoma: consider the population. J. Clin. Gastroenterol. 2013;47:S2–S6. doi: 10.1097/MCG.0b013e3182872f29. - DOI - PMC - PubMed
    1. Yu L-X, Ling Y, Wang H-Y. Role of nonresolving inflammation in hepatocellular carcinoma development and progression. NPJ Precis. Oncol. 2018;2:6. doi: 10.1038/s41698-018-0048-z. - DOI - PMC - PubMed
    1. Cancer Genome Atlas Research Network. Comprehensive and integrative genomic characterization of hepatocellular carcinoma. Cell. 2017;169:1327–1341. doi: 10.1016/j.cell.2017.05.046. - DOI - PMC - PubMed
    1. Kang T-W, et al. Senescence surveillance of pre-malignant hepatocytes limits liver cancer development. Nature. 2011;479:547–551. doi: 10.1038/nature10599. - DOI - PubMed

Publication types

MeSH terms

Substances