. 2023 Sep;4(9):1326-1344.
doi: 10.1038/s43018-023-00614-y. Epub 2023 Aug 28.

A first-in-class pan-lysyl oxidase inhibitor impairs stromal remodeling and enhances gemcitabine response and survival in pancreatic cancer

Collaborators, Affiliations

A first-in-class pan-lysyl oxidase inhibitor impairs stromal remodeling and enhances gemcitabine response and survival in pancreatic cancer

Jessica L Chitty et al. Nat Cancer. 2023 Sep.

Abstract

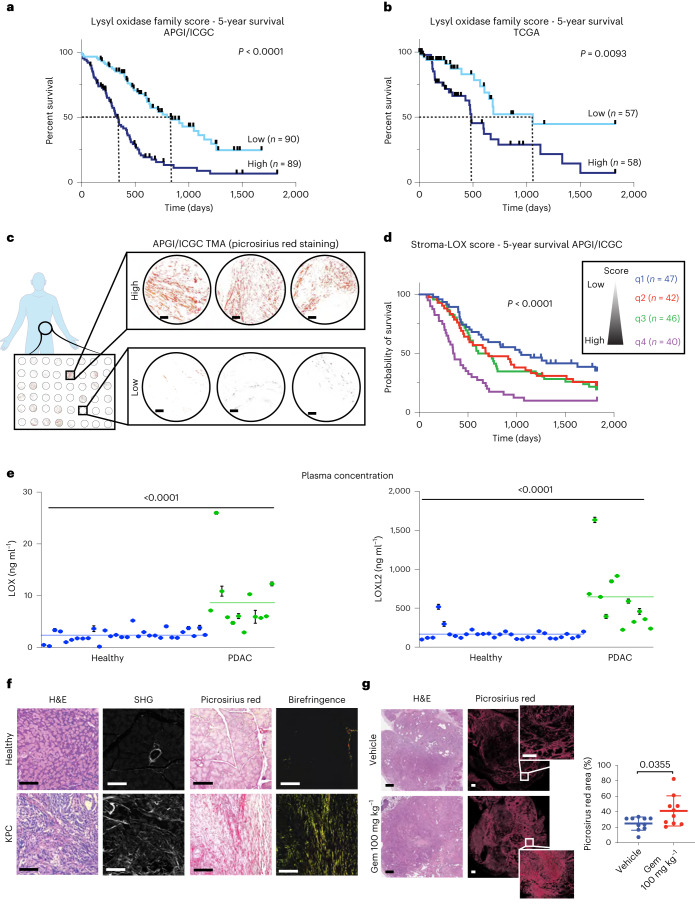
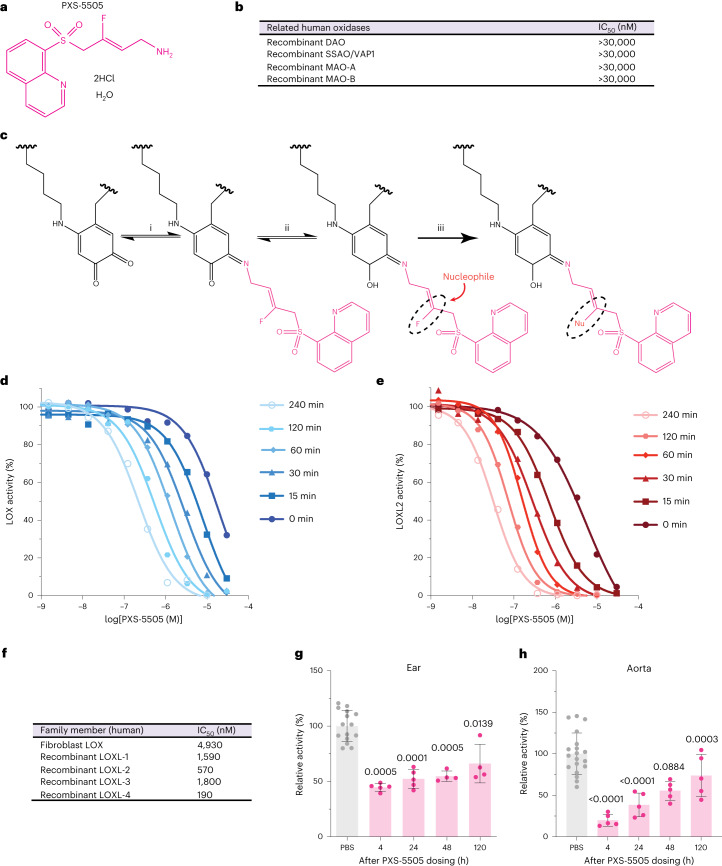
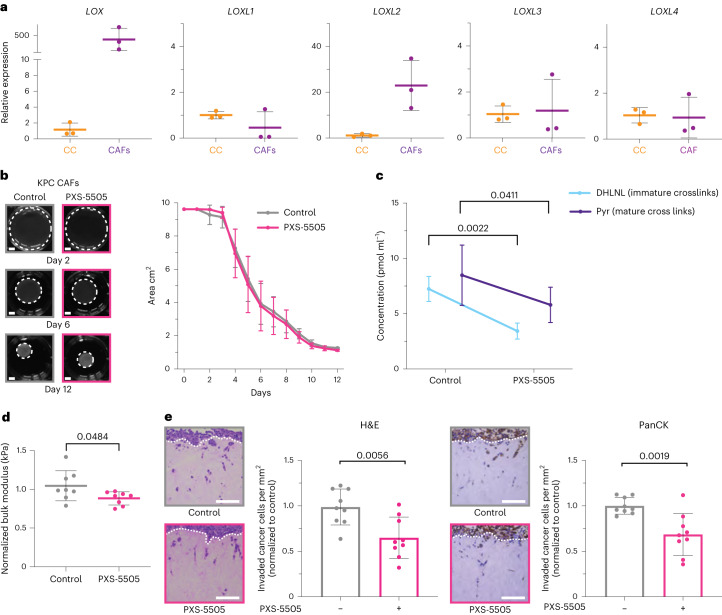
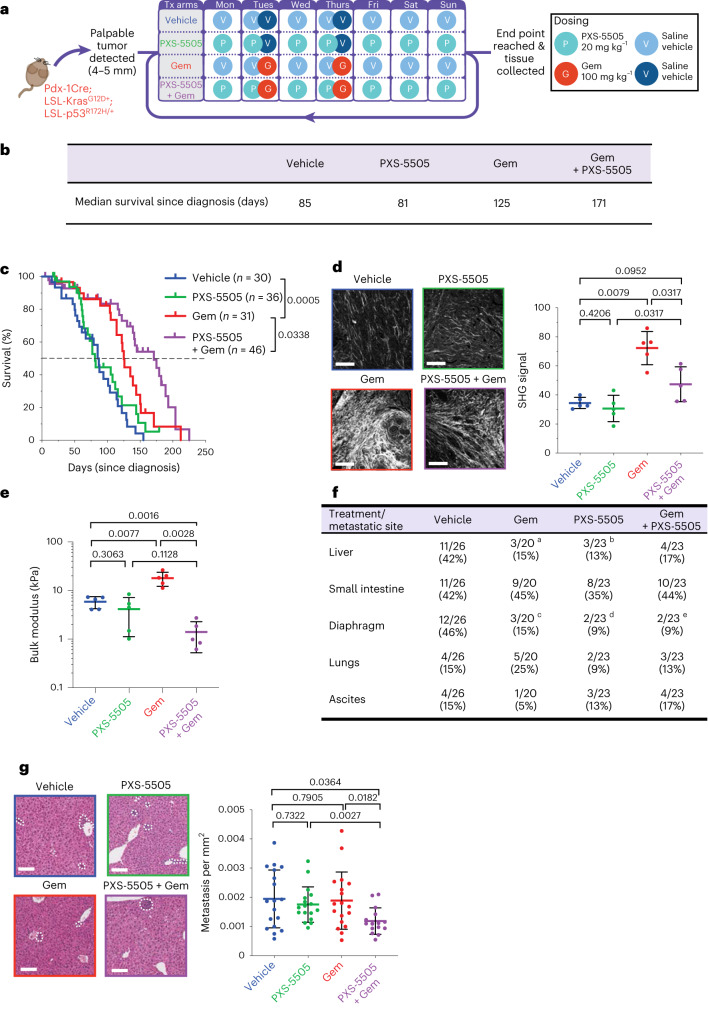
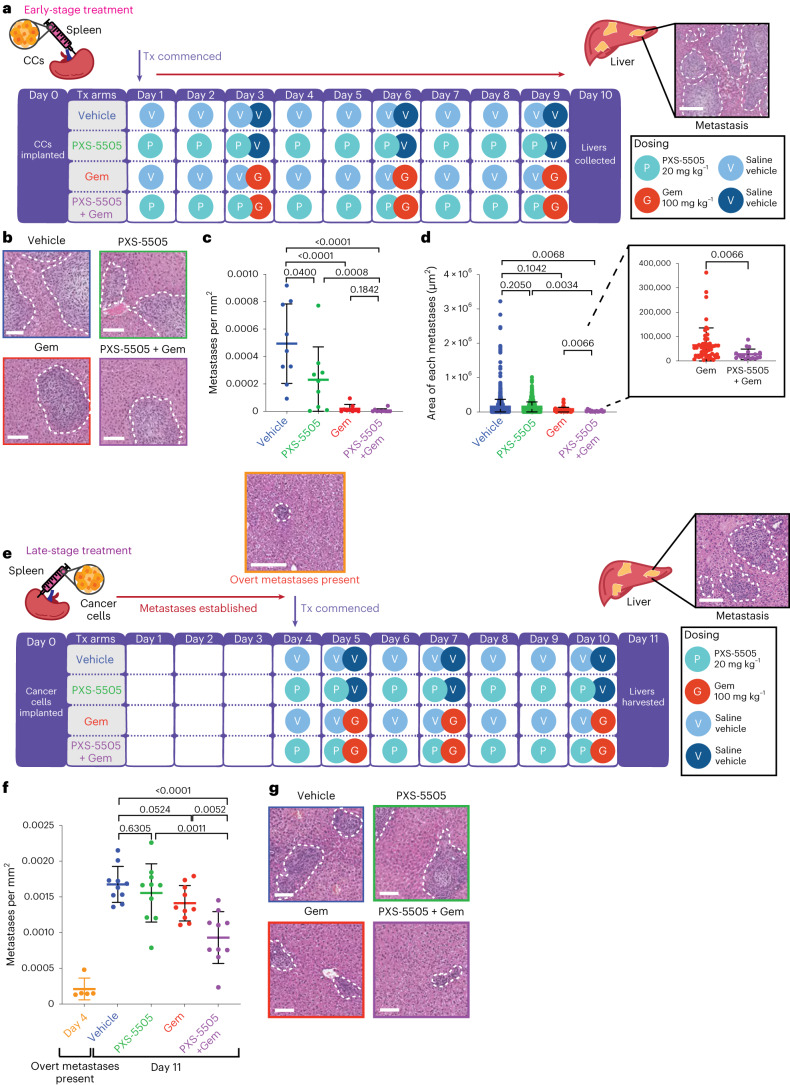
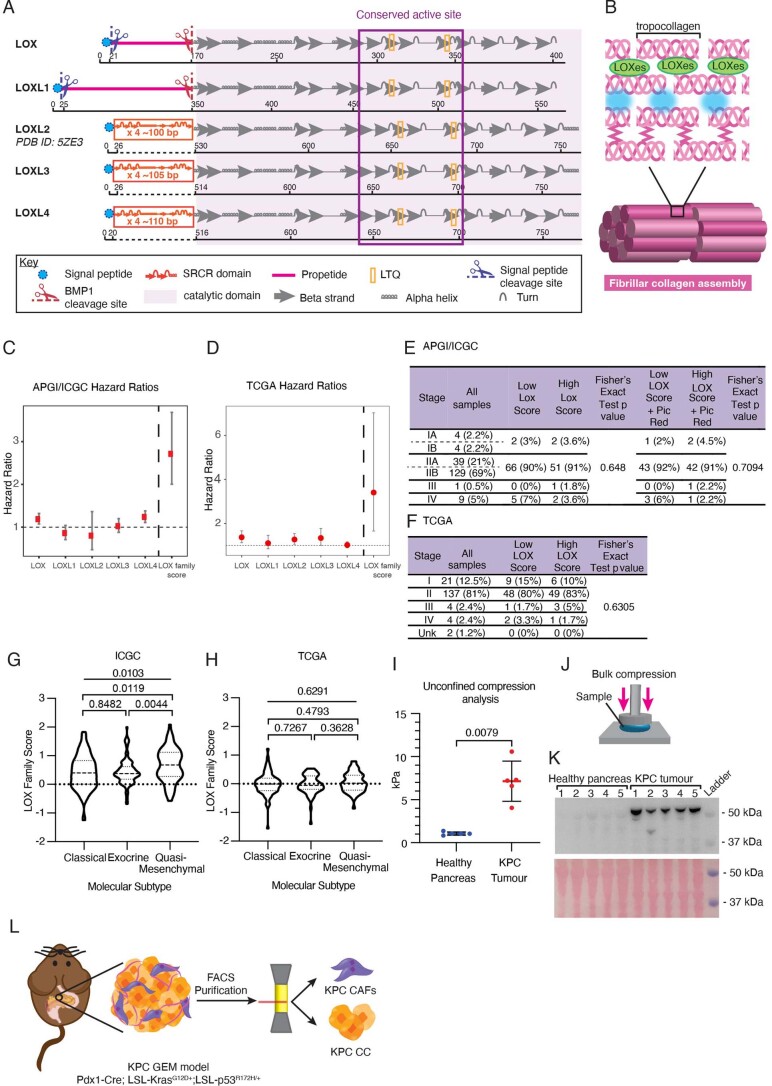
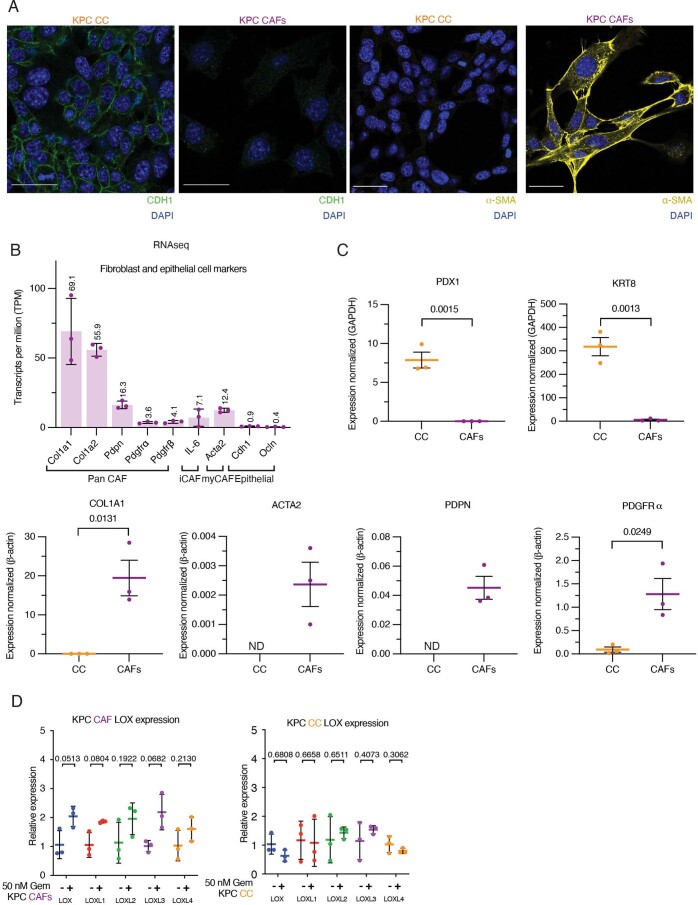
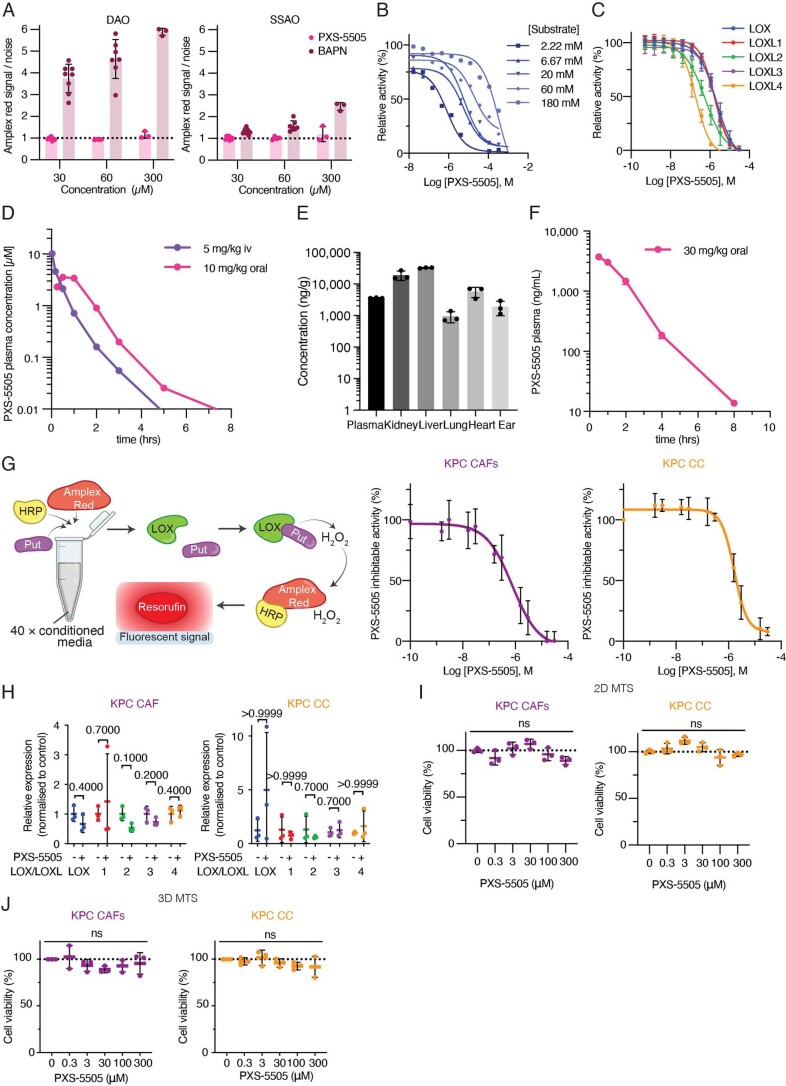
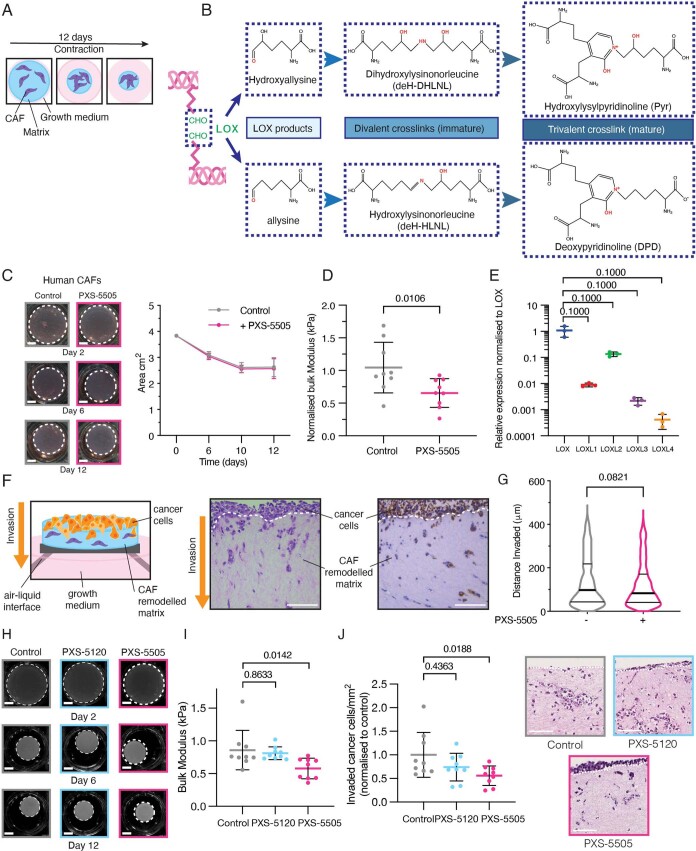
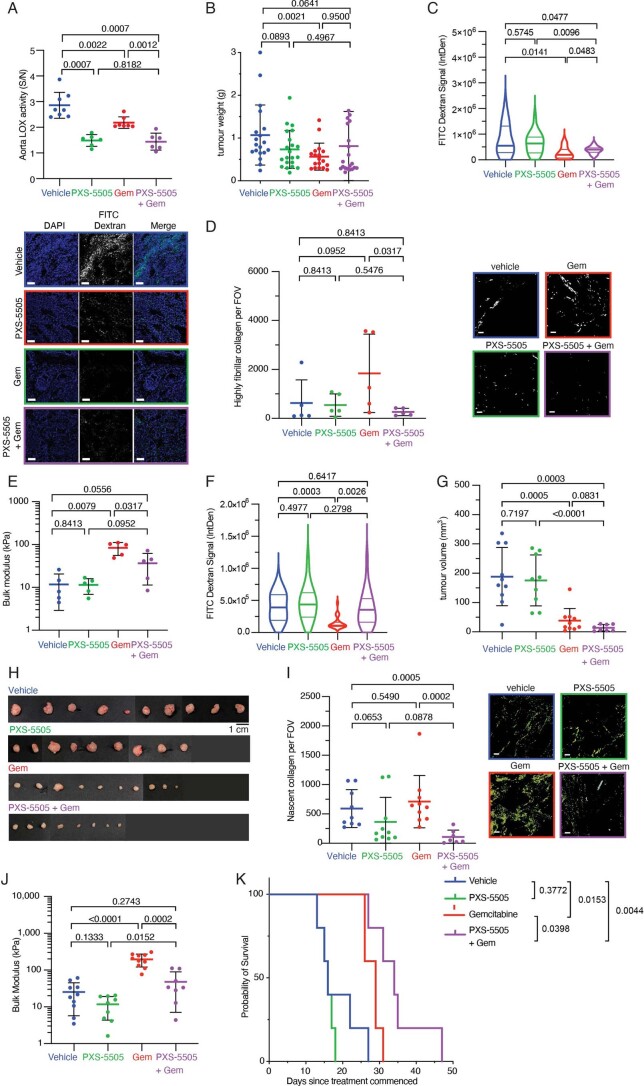
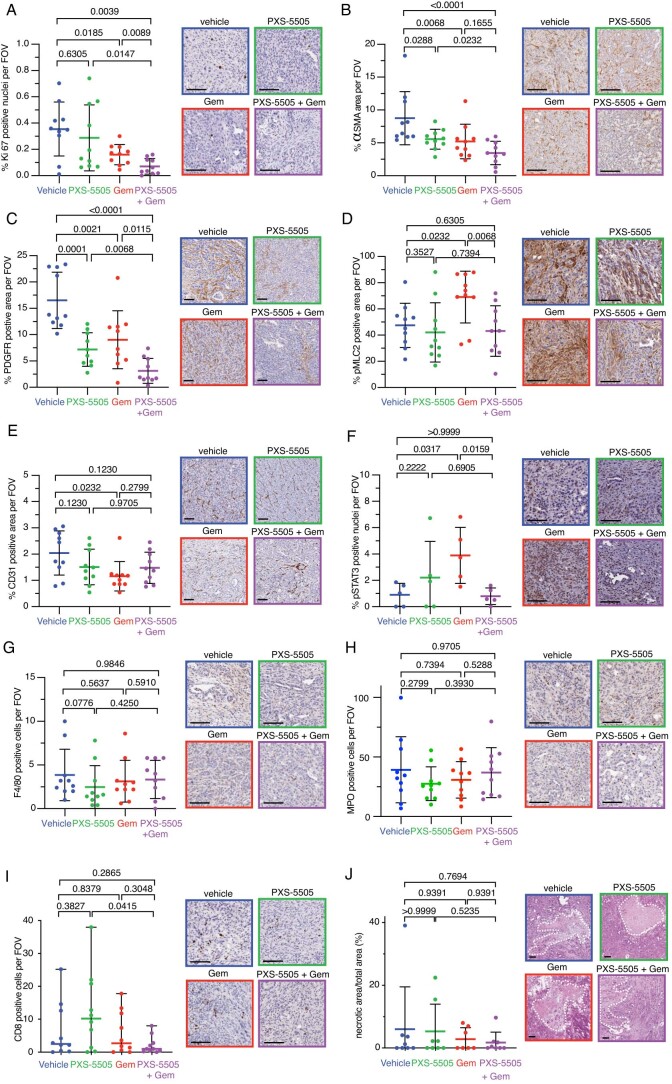
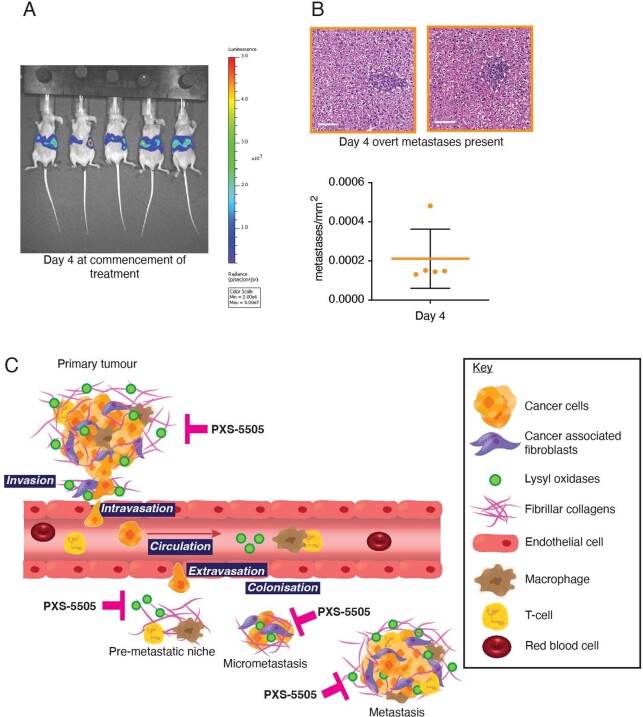
The lysyl oxidase family represents a promising target in stromal targeting of solid tumors due to the importance of this family in crosslinking and stabilizing fibrillar collagens and its known role in tumor desmoplasia. Using small-molecule drug-design approaches, we generated and validated PXS-5505, a first-in-class highly selective and potent pan-lysyl oxidase inhibitor. We demonstrate in vitro and in vivo that pan-lysyl oxidase inhibition decreases chemotherapy-induced pancreatic tumor desmoplasia and stiffness, reduces cancer cell invasion and metastasis, improves tumor perfusion and enhances the efficacy of chemotherapy in the autochthonous genetically engineered KPC model, while also demonstrating antifibrotic effects in human patient-derived xenograft models of pancreatic cancer. PXS-5505 is orally bioavailable, safe and effective at inhibiting lysyl oxidase activity in tissues. Our findings present the rationale for progression of a pan-lysyl oxidase inhibitor aimed at eliciting a reduction in stromal matrix to potentiate chemotherapy in pancreatic ductal adenocarcinoma.


Conflict of interest statement

L.P., A.D.F., B.C. and W.J. are employees of Pharmaxis, a company with ownership of PXS-5505 described in the paper. Pharmaxis provided PXS-5505 free of charge for the work presented herein. The remaining authors declare no competing interests.

Figures

Fig. 1
Fig. 1. Characterization of LOX family in PDAC.
a,b, Kaplan–Meier curves for 5-year overall survival for lysyl oxidase family scores in the APGI/ICGC (low, n = 90 patients; high, n = 89 patients) (a) and TCGA (low, n = 57 patients; high, n = 58 patients) (b) PDAC datasets. Lines represent upper and lower tertiles. The lysyl oxidase family expression score is weighted by the Cox proportional hazards model coefficients for each family member. P values determined by log-rank (Mantel–Cox) test. c, Representative images of picrosirius red stained tumor cores from APGI/ICGC tumor microarrays. Scale bar, 100 μm. d, Lysyl oxidase family score was integrated with the picrosirius red score to create a combined ‘stroma-lysyl oxidase family’ score (representing tumor fibrosis and lysyl oxidase family expression) and Kaplan–Meier curves for 5-year overall survival plotted. P value refers to q1 versus q4. P values determined by log-rank (Mantel–Cox) test. e, Human LOX and LOXL2 plasma concentrations in healthy (n = 30 patient samples) and patients with PDAC (n = 12 patient samples) determined by SiMoA. Data are presented as mean values and error bars represent %CV of three technical replicates from each patient. Two-tailed P value determined by unpaired, nonparametric t-test with a Mann–Whitney U-test correction (comparison between two groups). f, Representative images for comparison of age-matched healthy pancreas (taken from one of five biologically independent animals) and KPC PDAC tumor (taken from one of eighteen biologically independent animals) stained for H&E (left), imaged by multiphoton SHG imaging for collagen I (center left), picrosirius red staining viewed by transmitted light (center-right) and by polarized light (right). Scale bars, 100 μm. g, Quantitative comparison of picrosirius red staining in tumors from KPC tumor-bearing mice treated with either saline vehicle or gemcitabine (n = 10 biologically independent animals per group). Data presented as mean values ± s.d. Scale bars, 500 μm. Two-tailed P values determined by unpaired, nonparametric t-tests with a Mann–Whitney U-test correction (comparison between two groups). Source data
Fig. 2
Fig. 2. PXS-5505 is a first-in-class pan-LOX inhibitor.
a, Chemical structure of PXS-5505. b, IC50 determination of PXS-5505 against other human amine oxidases: DAO, SSAO/VAP-1 and MAO-A and MAO-B. c, Proposed mechanism of lysyl oxidase inhibition by PXS-5505 through (i) initial binding to the LTQ complex in the enzymatic pocket to form a Schiff base, which then undergoes oxidation (ii) substitution of the fluorine with a nucleophilic amino acid (iii) formation of a covalently bound enzyme-inhibitor complex, resulting in irreversible loss of enzymatic activity. d, Representative plot of time-dependent inhibition of LOX specific activity showing increased potency with increased pre-incubation time, 0–240 min (n = 3 biologically independent samples). e, Representative plot of time-dependent inhibition of LOXL2 specific activity showing increased potency with increased pre-incubation time, 0–240 min (n = 3 biologically independent samples). f, IC50 values of PXS-5505 for each of the five lysyl oxidase family members. g, Lysyl oxidase family activity measured in the ear of rats following a single 30 mg kg−1 oral dosing of PXS-5505 n = 15 (PBS), 5 (4, 24 h), 4 (48, 120 h) biological independent samples. Data are presented as mean ± s.d. Two-tailed P value determined by unpaired, nonparametric t-test with a Mann–Whitney U-test correction (comparison to PBS control). h, Lysyl oxidase family activity measured in freshly excised aorta determined by fluorometric activity assay n = 19 (PBS), 5 (4–120 h) biological independent samples. Data presented as mean ± s.d. Two-tailed P value determined by unpaired, nonparametric t-test with a Mann–Whitney U-test correction (comparison to PBS control). Source data
Fig. 3
Fig. 3. PXS-5505 inhibition of CAF remodeling in vitro.
a, Quantitative PCR with reverse transcription (qRT–PCR) showing in vitro comparison of KPC CAF relative expression of lysyl oxidase family members compared to KPC CCs from the same model (n = 3 biologically independent samples). Comparisons were determined by 2–∆∆Ct approach. b, Representative images of 3D organotypic matrix contraction assay at days 2, 6 and 12 in the absence (gray) or presence (pink) of PXS-5505 (30 µM). Scale bars, 5 mm. Comparison of measured area of matrices between control and PXS-5505 treatment groups over time (n = 3 technical samples examined over three biologically independent samples). Data are mean ± s.d. c, Concentration of immature divalent DHLNL and mature trivalent Pyr collagen crosslinks determined by LC–MS from control and PXS-5505-treated organotypic matrices at day 12 (n = 3 technical samples examined over two biologically independent samples). Data are mean ± s.d. Two-tailed P value determined by unpaired, nonparametric t-test with a Mann–Whitney U-test correction (comparison between two groups). d, Comparison of matrix stiffness by unconfined compression testing of PXS-5505 and control treated matrices at day 12 (n = 8 biologically independent samples). Data are presented as mean ± s.d. Two-tailed P value determined by unpaired, nonparametric t-test with a Mann–Whitney U-test correction (comparison between two groups). e, Representative images taken from one biologically independently contracted matrix representative of the three biological replicates) of invasion of KPC CCs into a contracted organotypic matrix as determined by H&E and PanCK staining (±PXS-5505 at 30 µM during contraction phase only). Comparison of number of CCs invaded per field of view (FOV) as determined by H&E and PanCK staining (nine images taken from three technical samples from each of three biologically independent contracted matrices), normalized to control. Data are mean ± s.d. Scale bars, 100 μm. Two-tailed P value determined by unpaired, nonparametric t-test with a Mann–Whitney U-test correction (comparison between two groups). Source data
Fig. 4
Fig. 4. PXS-5505 administered in a KPC in vivo survival study.
a, Schematic of the KPC in vivo survival study. Presence of a primary tumor in KPC mice was confirmed by two independent researchers (positive diagnosis) before commencement of daily treatment (Tx) on one of four treatment arms as follows: vehicle, 0.9% saline; Gem, twice-weekly gemcitabine (100 mg kg−1 i.p.); PXS-5505, daily PXS-5505 at 20 mg kg−1 i.p.; and PXS-5505 + Gem, daily PXS-5505 at 20 mg kg−1 i.p. + twice-weekly gemcitabine (100 mg kg−1 i.p.). b, Table of median survival (since diagnosis/commencement of treatment) across the four treatment groups (n = 30 biologically independent animals (vehicle), n = 31 biologically independent animals (Gem), n = 36 biologically independent animals (PXS-5505), n = 46 biologically independent animals (PXS-5505 + Gem)). c, Kaplan–Meier curves for overall survival across treatment arms (n = 30 biologically independent animals (vehicle), n = 31 biologically independent animals (Gem), n = 36 biologically independent animals (PXS-5505), n = 46 biologically independent animals (PXS-5505 + Gem)). P values determined by log-rank (Mantel–Cox) test. d, Representative maximum intensity projections of SHG multiphoton imaging for tumors from each treatment group (n = 1 FOV taken from one biologically independent animal per group) at end point (scale bars, 100 μm) and quantification of SHG peak signal intensity (n = 5 biologically independent animals per group and five FOV per animal). Data are mean ± s.d. Two-tailed P values determined by unpaired, nonparametric t-test with a Mann–Whitney U-test correction (comparison between two groups) e, Quantification of bulk modulus (stiffness) by unconfined compression testing of end-point PDAC tumors from each treatment group (n = 5 biologically independent animals per group; individual tumors shown), data are mean ± s.d. Two-tailed P value determined by unpaired, nonparametric t-test with a Mann–Whitney U-test correction (comparison between two groups). f, Presence of overt metastatic lesions observed during necropsy (number of mice). Two-tailed P values determined by chi-squared test. aLiver (vehicle versus Gem, P = 0.046, chi-squared); bLiver (vehicle versus PXS-5505, P = 0.023, chi-squared); cDiaphragm (vehicle versus Gem, P = 0.026, chi-squared); dDiaphragm (vehicle versus PXS-5505, P = 0.004, chi-squared); and eDiaphragm (vehicle versus Gem + PXS-5505, P = 0.004, chi-squared). g, Representative images of H&E-stained livers from each treatment group (n = 1 FOV taken from one biologically independent animal per group) (scale bars, 100 μm). Quantification of metastases (n = 18 biologically independent animals (vehicle), n = 18 biologically independent animals (Gem), n = 17 biologically independent animals (PXS-5505), n = 15 biologically independent animals (PXS-5505 + Gem)). Data are mean ± s.d. Two-tailed P values were determined by unpaired, nonparametric t-test with a Mann–Whitney U-test correction (comparison between two groups). Source data
Fig. 5
Fig. 5. PXS-5505 administered in intrasplenic models of liver colonization.
a, Schematic of the intrasplenic model of liver colonization with early administration of treatment. CCs were implanted into the spleen of BALB/c-Fox1nuAusb mice under anesthesia on day 0. Treatment with 0.9% saline (vehicle); twice-weekly Gem (100 mg kg−1 i.p.) (Gem); daily PXS-5505 at 20 mg kg−1 i.p. (PXS-5505) or daily PXS-5505 at 20 mg kg−1 i.p. + twice-weekly Gem at 100 mg kg−1 i.p. (PXS-5505 + Gem) was administered from day 1. At the end point (day 10) livers were collected and H&E-stained for scoring. Representative images of H&E-stained liver (taken from one biologically independent animal). Scale bar, 100 μm. b, Representative images of H&E-stained livers from each treatment group (n = 1 FOV taken from one biologically independent animal per group). Scale bars, 100 μm. c, Quantification of metastases per mm2 (n = 9 biologically independent animals per group). Data are mean ± s.d. Two-tailed P values were determined by unpaired, nonparametric t-test with a Mann–Whitney U-test correction (comparison between two groups). d, Quantification of the area of each metastasis in treatment groups (n = 9 biologically independent animals per group). Data are mean ± s.d. Two-tailed P values were determined by an unpaired, nonparametric t-test with a Mann–Whitney U-test correction (comparison between two groups). e, Schematic of intrasplenic model of liver colonization with late administration of treatment. CCs were implanted into the spleen of BALB/c-Fox1nuAusb mice under anesthesia on day 0. Treatment with 0.9% saline (vehicle); twice-weekly Gem (100 mg kg−1 i.p.) (Gem); daily PXS-5505 at 20 mg kg−1 i.p. (PXS-5505); or daily PXS-5505 at 20 mg kg−1 i.p. + three doses of Gem (100 mg kg−1 i.p. (PXS-5505 + Gem) was administered from day 4. Representative images of H&E-stained liver (taken from one biologically independent animal). Scale bar, 100 μm. f, Quantification of metastases at endpoint (n = 10 biologically independent animals per treatment group, n = 5 biologically independent animals at day 4 for confirmation of overt metastases). Data are mean ± s.d. P values were determined by an unpaired, nonparametric t-test with a Mann–Whitney U-test correction (comparison between two groups). g, Representative images of H&E-stained livers from each treatment group. Scale bars, 100 μm. Source data
Extended Data Fig. 1
Extended Data Fig. 1. The role of the LOX family in PDAC.
a. Prediction of LOX, LOXL1, 3 and 4 secondary structures based on the previously published secondary structure of LOXL2 (PDB ID: 5ZE3). Each family member contains a highly conserved catalytic domain critical to the formation of the active enzymatic site. LOXL2-4 contain four repeat scavenger receptor cysteine-rich (SRCR) domains (not identical sequences). LOX and LOXL1 contain additional cleavage sites and propeptide domains. b. Lysyl oxidases catalyze the oxidative deamination of lysine residues in the telopeptide regions of tropocollagen molecules resulting in the formation of reactive aldehydes which undergo spontaneous (blue) condensation to yield crosslinks. Further assembly of these tropocollagen molecules results in fibrillar collagen. c, d. Forest plots for lysyl oxidase family members showing hazard ratios for each individual family member and combined ‘lysyl oxidase family’ scores in the APGI/ICGC n = 269 patients (C) and TCGA n = 178 patients (D) cohorts. Cox proportional hazards model; dots indicate the hazard ratio and whiskers the 95% confidence interval. e, f. Distribution of lysyl oxidase family scores according to tumor stage in the APGI/ICGC (E) and TCGA (F) cohorts. g, h. Patient stratification by molecular subtype according to lysyl oxidase family score in the APGI/ICGC (G) and TGCA (H) cohorts. p value determined by Kruskal-Wallis (Nonparametric One-Way ANOVA) and unpaired, nonparametric t-test with a Mann–Whitney U correction (comparison between two groups) i. Quantification of bulk modulus (stiffness) by unconfined compression testing in age-matched healthy pancreas and KPC PDAC tumors (n = 5 animals per group), p value determined by unpaired, nonparametric t-test with a Mann–Whitney U correction (comparison between two groups). Data presented as mean values +/− SD. j. Schematic of bulk compression testing on cross-sectional slices of samples k. Immunoblot analysis of LOX from corresponding age-matched healthy pancreas and PDAC tumors (n = 5 animals per group) and corresponding ponceau stain as loading control. l. CAFs and CCs derived from the Pdx1-Cre; LSL-KrasG12D/+; LSL-p53R172H/+ (KPC) model (sorted by FACs) as previously described. Source data
Extended Data Fig. 2
Extended Data Fig. 2. Characterization of cells derived from the KPC autochthonous model.
a. Immunofluorescence staining of KPC CCs and KPC CAFs for the pancreatic epithelial cell marker CDH1 (green), DAPI (blue) and for the CAF marker α-SMA (yellow), DAPI (blue). Representative images from n = 3 biological independent samples. Scale bar = 30 μm. b. RNAseq reads for CAF and epithelial cell makers in KPC CAFs n = 3 biological independent samples. Data presented as mean values +/− SD c. qRT-PCR of select pancreatic epithelial cell markers and CAF markers in KPC CCs and KPC CAFs, n = 3 biological repeats with 3 technical replicates per biological repeat. p value determined by unpaired, parametric t-test. Data is presented as mean values ± SEM. (ND = not detected) d. qRT-PCR for lysyl oxidase family members in KPC CAFs and KPC CCs treated with 50 nM gemcitabine or vehicle control for 48 hours, n = 3 biological repeats with 3 technical replicates per biological repeat. Data presented as mean values +/− SD. Relative fold expression of LOX family members from gemcitabine treated samples compared to control were determined by 2–∆∆Ct approach. p-values were determined by unpaired, nonparametric t-test with a Mann–Whitney U correction (comparison between two groups). Source data
Extended Data Fig. 3
Extended Data Fig. 3. PXS-5505 is a LOX family specific inhibitor.
a. Turnover of ßAPN by DAO (n = 8 (30 μM), 7 (60 μM), 3 (300 μM) and SSAO (n = 9 (30 μM), 7 (60 μM), 3 (300 μM) as measured by H2O2 release using an amplex red coupled fluorometric activity assay. Data presented as mean values +/− SD b. Substrate competition assay whereby PXS-5505 concentrations versus putrescine dihydrochloride is performed in an amplex red assay using bovine aorta extracted LOX (n = 3). c. Determination of IC50 of each lysyl oxidase family member by PXS-5505 n = 20 (LOX), 3 (LOXL1), 10 (LOXL2), 3 (LOXL3), 4 (LOXL4). Data presented as mean values +/− SD. d. Plasma concentration profile over time in rats following administration of a single dose of PXS-5505 orally (10 mg/kg) or intravenously (5 mg/kg) e. PXS-5505 concentration, as measured by LC–MS/MS, in rat plasma, kidney, liver, lung, heart and ear samples following a single oral dose of 30 mg/kg (n = 3 independent animals). Data presented as mean values +/− SD. f. Plasma concentration profile over time in mice following oral administration of PXS-5505 (30 mg/kg) (n = 3 independent animals) g. Schematic of amplex red coupled fluorometric lysyl oxidase family activity assay whereby putrescine (put) is used as a substrate resulting in the release of H2O2 and its subsequent catalysis by horseradish peroxidase (HRP) to reduce amplex red to resorufin resulting in a fluorescently detectable signal. Using this assay, the concentration dependent PXS-5505 inhibition of lysyl oxidase family activity in conditioned media (CM) from KPC CAFs and cancer cells was measured (n = 3 biological repeats with 3 technical replicates per biological repeat). Data presented as mean values +/− SD. h. qRT-PCR showing in vitro 48 hour treatment of KPC CAFs or cancer cells with 30 μM PXS-5505 or vehicle control (n = 3 biological repeats with 3 technical replicates per biological repeat). Data presented as mean values +/− SD. Relative fold expression of lysyl oxidase family members from PXS-5505 treated samples compared to control were determined by the 2–∆∆Ct approach. p-values determined by unpaired, nonparametric t-test with a Mann–Whitney U correction (comparison between two groups). i. 2D in vitro cell viability assay (MTS assay) for KPC CAFs and CCs (n = 3 biological repeats with 3 technical replicates per biological repeat) in response to PXS-5505. Data presented as mean values +/− SD. Ordinary one-way ANOVA for multiple comparison test performed. j. 3D in vitro cell viability assay (MTS assay) for KPC CAFs and CCs (n = 3 biological repeats with 3 technical replicates per biological repeat) in response to PXS-5505. Data presented as mean values +/− SD. Ordinary one-way ANOVA for multiple comparison test performed. Source data
Extended Data Fig. 4
Extended Data Fig. 4. PXS-5505 inhibits collagen cross-linking by PDAC CAFs in vitro resulting in decreased cancer cell invasion.
a. Schematic of organotypic matrix remodeling assay whereby CAFs are embedded into a 3D collagen matrix and growth media supplemented with or without PXS-5505 to inhibit lysyl oxidase family activity b. Chemical structures of lysyl oxidase family catalyzed hydroxyallysine or allysine residues and the subsequent divalent and trivalent bonds that are formed that can be quantified by mass spectrometry. c. Representative images of 3D organotypic matrix contraction by human pancreatic cancer CAFs at days 2, 6 and 12 in the absence (gray) and presence (pink) of PXS-5505 (30 µM). Scale bars = 5 mm. Comparison of area of matrices between control and PXS-5505 treatment groups (n = 3 biological repeats with 3 technical replicates per biological repeat) over time showing no effect on CAF ability to contract matrices. p-value determined by unpaired, nonparametric t-test with a Mann–Whitney U correction (comparison between two groups). Data presented as mean values +/− SD. d. Treatment with PXS-5505 during remodeling leads to a decrease in stiffness (bulk modulus) of remodeled organotypic matrices. p-value determined by unpaired, nonparametric t-test with a Mann–Whitney U correction (comparison between two groups). Data presented as mean values +/− SD. e. qRT-PCR confirming expression of lysyl oxidase family members from human PDAC CAFs (n = 3 biological repeats with 3 technical replicates per biological repeat). p-value determined by unpaired, nonparametric t-test with a Mann–Whitney U correction (comparison between two groups). Data presented as mean values +/− SD. Relative fold expression of LOXL family members compared to LOX were determined by 2–∆∆Ct approach. f. Schematic of cancer cell invasion in a 3D organotypic matrix assay whereby cancer cells are seeded to the surface of a remodeled collagen plug and placed at an air–liquid interface and allowed to invade into the remodeled matrix. Example ROIs from H&E and panCK stained sections showing cancer cell invasion in the remodeled organotypic plug (3 biological repeats with 3 technical replicates per biological repeat). Scale bars = 100 μm. g. Comparison of invasion depth of cancer cells into 3D organotypic matrices as determined by PanCK staining n = -PXS-5505: 695 cells; +PXS-5505: 568 cells (taken from 3 technical replicates from 3 separate biological replicates), Data show distance invaded from the top of contracted matrix. p-value determined by unpaired, nonparametric t-test with a Mann–Whitney U correction (comparison between two groups). h. Representative images of 3D organotypic matrix contraction assay at days 2, 6 and 12 of control (gray) and presence of PXS-5120 (blue) and PXS-5505 (pink). Scale bars = 5 mm. Comparison of measured area of matrices between control, PXS-5120 and PXS-5505 treatment groups (n = 3) over time. i. Comparison of matrix stiffness by unconfined compression testing of PXS-5120, PXS-5505 and control treated matrices at day 12 (n = 3 biological repeats with 3 technical replicates per biological repeat). Data presented as mean values +/− SD. p-value determined by unpaired, nonparametric t-test with a Mann–Whitney U correction (comparison between two groups) j. Representative images of invasion of KPC cancer cells into a contracted organotypic matrix as determined by H&E staining. Comparison of number of cancer cells invaded per FOV as determined by H&E (9 images from 3 biological repeats with 3 technical replicates per biological repeat), shown as cells/mm2 and normalized to control (n = 9). Data presented as mean values +/− SD. p-value determined by unpaired, nonparametric t-test with a Mann–Whitney U correction (comparison between two groups). Source data
Extended Data Fig. 5
Extended Data Fig. 5. PXS-5505 in combination with gemcitabine in vivo.
a. Lysyl oxidase family activity measured in the aorta of KPC tumor bearing mice at end point, measured by fluorometric activity assay confirming lysyl oxidase family inhibition. Signal is defined as the enzyme activity in the aorta, while noise is measured in the presence of a high concentration (300 µM) BAPN to abolish any lysyl oxidase family activity. Signal over noise equal to 1 indicates complete inhibition. p-value determined by unpaired, nonparametric t-test with a Mann–Whitney U correction (comparison to vehicle control) (vehicle n = 8 biologically independent animals, Gem n = 7 biologically independent animals, PXS-5505 n = 6 biologically independent animals, PXS-5505 + Gem n = 6 biologically independent animals). Data presented as mean values +/− SD b. Tumor weight (grams) at end point from each treatment group (vehicle n = 19 biologically independent animals, Gem n = 18 biologically independent animals, PXS-5505 n = 21 biologically independent animals, PXS-5505 + Gem n = 21 biologically independent animals). p-value determined by unpaired, nonparametric t-test with a Mann–Whitney U correction (comparison between two groups). Data presented as mean values +/− SD. c. FITC-dextran (molecular weight: 10 kDa) signal quantification from KPC tumor end point from each treatment group (vehicle n = 3 biologically independent animals, PXS-5505 n = 5 biologically independent animals, Gem n = 5 biologically independent animals, PXS-5505 + Gem n = 5 biologically independent animals). 4 ROIs taken per mouse. P-values determined by Welchs t-test. Data presented as mean values +/− SD. Scale bars = 100 μm d. Quantification of red birefringent (mature) collagen fibers from human PDXs at end point after 3 cycles of treatment, treated as indicated. 5 fields of view (500 μm × 500 μm) per mouse. p-values determined by unpaired, nonparametric t-test with a Mann–Whitney U correction (vehicle n = 5 biologically independent animals, Gem n = 5 biologically independent animals, PXS-5505 n = 5 biologically independent animals, PXS-5505 + Gem n = 5 biologically independent animals). Data presented as mean values +/− SD. Scale bars = 100 μm e. Quantification of bulk modulus (stiffness) by unconfined compression testing of end point human PDX tumors from each treatment group (vehicle n = 5 biologically independent animals, Gem n = 5 biologically independent animals, PXS-5505 n = 5 biologically independent animals, PXS-5505 + Gem n = 5 biologically independent animals) [individual tumors shown]). Data presented as mean values +/− SD. p-value determined by unpaired, nonparametric t-test with a Mann–Whitney U correction (comparison between two groups) f. FITC-dextran (molecular weight 10 kDa) signal quantification from human PDXs from each treatment group (vehicle n = 4 biologically independent animals, PXS-5505 n = 5 biologically independent animals, Gem n = 5 biologically independent animals, PXS-5505 + Gem n = 5 biologically independent animals). 4 ROIs taken per mouse. P values determined by Welchs t-test. g. A second human PDX model at end point after 3 cycles of treatment. Tumor volumes (mm3) at end point from each treatment group (vehicle n = 9 biologically independent animals, Gem n = 10 biologically independent animals, PXS-5505 n = 10 biologically independent animals, PXS-5505 + Gem n = 7 biologically independent animals). p-value determined by unpaired, nonparametric t-test with a Mann–Whitney U correction (comparison between two groups). Data presented as mean values +/− SD. h. Image of human PDX tumors after 3 cycles of treatment i. Quantification of green birefringent (nascent) collagen fibers from human PDXs at end point, treated as indicated. 3 fields of view (750 μm × 750 μm) per mouse. p-values determined by unpaired, nonparametric t-test with a Mann–Whitney U correction (vehicle n = 10 biologically independent animals, Gem n = 10 biologically independent animals, PXS-5505 n = 9 biologically independent animals, PXS-5505 + Gem n = 7 biologically independent animals). Data presented as mean values +/− SD. Scale bars = 100 μm j. Quantification of bulk modulus (stiffness) by unconfined compression testing of end point human PDX tumors from each treatment group (vehicle n = 10 biologically independent animals, Gem n = 10 biologically independent animals, PXS-5505 n = 9 biologically independent animals, PXS-5505 + Gem n = 8 biologically independent animals) [individual tumors shown]). Data presented as mean values +/− SD. p-value determined by unpaired, nonparametric t-test with a Mann–Whitney U correction (comparison between two groups) k. Kaplan–Meier curves for overall survival across treatment arms (n = 5 (vehicle), n = 5 (Gem), n = 5 (PXS-5505), n = 5 (PXS-5505 + Gem). Treatment commenced once tumor reached 50 mm3 p-values determined by Log-rank (Mantel–Cox) test. Source data
Extended Data Fig. 6
Extended Data Fig. 6. PXS-5505 in combination with gemcitabine in a KPC model.
a. Quantification of proliferating cells (Ki67 positive nuclear staining) in KPC tumors at end point, treated as indicated. 5 fields of view (500 μm × 500 μm) per mouse and 10 mice per cohort were scored. Data presented as mean values +/− SD. p-values determined by unpaired, nonparametric t-test with a Mann–Whitney U correction. Scale bars = 100 μm b. Quantification of percent coverage of αSMA positive staining in KPC tumors at end point, treated as indicated. 3 fields of view (1000 μm × 1000 μm) per mouse and 10 mice per cohort were scored. Data presented as mean values +/− SD. p-values determined by unpaired, nonparametric t-test with a Mann–Whitney U correction. Scale bars = 100 μm c. Quantification of percent coverage of PDGFR-ß positive staining in KPC tumors at end point, treated as indicated. 3 fields of view (1000 μm × 1000 μm) per mouse and 10 mice per cohort were scored. Data presented as mean values +/− SD. p-values determined by unpaired, nonparametric t-test with a Mann–Whitney U correction. Scale bars = 100 μm d. Quantification of pMLC2 positive staining in stromal regions of KPC tumors at end point, treated as indicated. 3 fields of view (500 μm × 500 μm) per mouse and 10 mice per cohort were scored. Data presented as mean values +/− SD. p-values determined by unpaired, nonparametric t-test with a Mann–Whitney U correction. Scale bars = 100 μm e. Quantification of tumor vasculature (CD31 positive staining) in KPC tumors at end point, treated as indicated. 3 fields of view (1000 μm × 1000 μm) per mouse and 10 mice per cohort were scored. Data presented as mean values +/− SD. p-values determined by unpaired, nonparametric t-test with a Mann–Whitney U correction. Scale bars = 100 μm f. Quantification of STAT3 activation (pSTAT3 positive nuclear staining) in KPC tumors at end point, treated as indicated. 3 fields of view (1000 μm × 1000 μm) per mouse and 5 mice per cohort were scored. Data presented as mean values +/− SD. p-values determined by unpaired, nonparametric t-test with a Mann–Whitney U correction. Scale bars = 100 μm. g Quantification of macrophage infiltration (F4/80 positive staining) in KPC tumors at end point, treated as indicated. 5 fields of view (500 μm × 500 μm) per mouse and 10 mice per cohort were scored. Data presented as mean values +/− SD. p-values determined by unpaired, nonparametric t-test with a Mann–Whitney U correction. Scale bars = 100 μm h. Quantification of number of myeloperoxidase (MPO+) cell infiltration in KPC tumors at end point, treated as indicated. 5 fields of view (500 μm × 500 μm) per mouse and 10 mice per cohort were scored. Data presented as mean values +/− SD. p-values determined by unpaired, nonparametric t-test with a Mann–Whitney U correction. Scale bars = 100 μm i. Quantification of T-cell infiltration (CD8 positive staining) in KPC tumors at end point, treated as indicated. 5 fields of view (500 μm × 500 μm) per mouse and 10 mice per cohort were scored. p-values determined by unpaired, nonparametric t-test with a Mann–Whitney U correction. Data presented as median values with range. Scale bars = 100 μm j. Quantification of necrosis determined by H&E in KPC tumors at end point, treated as indicated (vehicle n = 8 biologically independent animals, Gem n = 7 biologically independent animals, PXS-5505 n = 8 biologically independent animals, PXS-5505 + Gem n = 8 biologically independent animals). Data presented as mean values +/− SD. p-values determined by unpaired, nonparametric t-test with a Mann–Whitney U correction. Scale bars = 100 μm. Source data
Extended Data Fig. 7
Extended Data Fig. 7. Liver colonization in the intrasplenic model and schematic of PXS-5505 inhibition of lysyl oxidases in PDAC.
a. IVIS imaging of late-stage treatment study of liver colonization model over 11 days. b. Representative images of H&E-stained liver at day 4 confirming presence of micro-metastatic lesions as detected by IVIS imaging n = 5 independent animals shown in (A). Data presented as mean values +/− SD. Scale bar 100 μm. Data also shown in Fig. 5f (orange) for reference b. PXS-5505 inhibits lysyl oxidase family member activity at different stages of tumor progression and metastasis. Source data

Similar articles

Cited by

References

    1. Cox TR. The matrix in cancer. Nat. Rev. Cancer. 2021;21:217–238. doi: 10.1038/s41568-020-00329-7. - DOI - PubMed
    1. Rahib L, et al. Projecting cancer incidence and deaths to 2030: the unexpected burden of thyroid, liver, and pancreas cancers in the United States. Cancer Res. 2014;74:2913–2921. doi: 10.1158/0008-5472.CAN-14-0155. - DOI - PubMed
    1. Piersma B, Hayward M-K, Weaver VM. Fibrosis and cancer: a strained relationship. Biochim. Biophys. Acta Rev. Cancer. 2020;1873:188356. doi: 10.1016/j.bbcan.2020.188356. - DOI - PMC - PubMed
    1. Biffi G, Tuveson DA. Diversity and biology of cancer-associated fibroblasts. Physiol. Rev. 2021;101:147–176. doi: 10.1152/physrev.00048.2019. - DOI - PMC - PubMed
    1. Hemmings C, Connor S. Pathological assessment of tumour regression following neoadjuvant therapy in pancreatic carcinoma. Pathology. 2020;52:621–626. doi: 10.1016/j.pathol.2020.07.001. - DOI - PubMed

Publication types