. 2023 Oct;8(10):1911-1919.
doi: 10.1038/s41564-023-01461-4. Epub 2023 Aug 28.

Plasmodium falciparum resistant to artemisinin and diagnostics have emerged in Ethiopia

Affiliations

Plasmodium falciparum resistant to artemisinin and diagnostics have emerged in Ethiopia

Abebe A Fola et al. Nat Microbiol. 2023 Oct.

Abstract

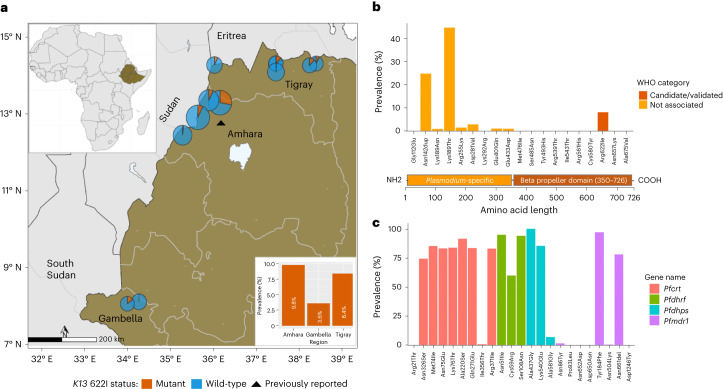
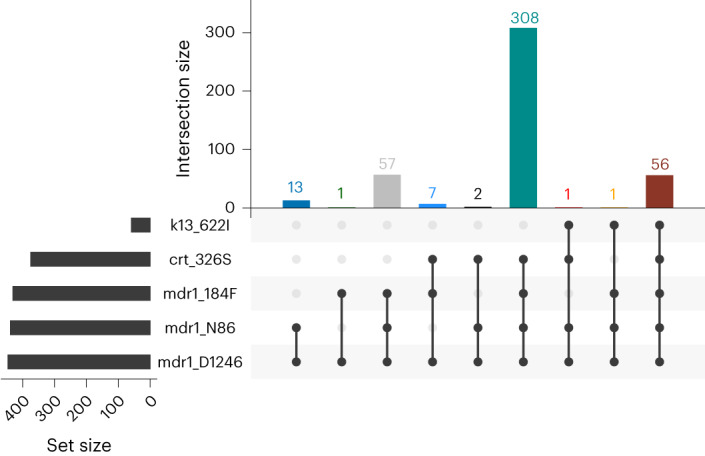
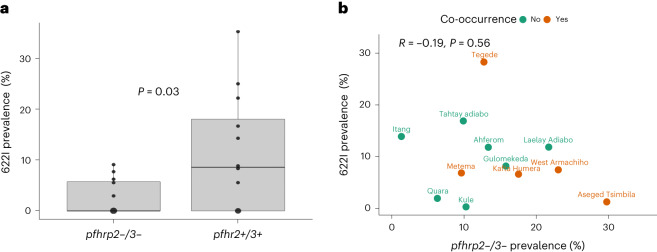
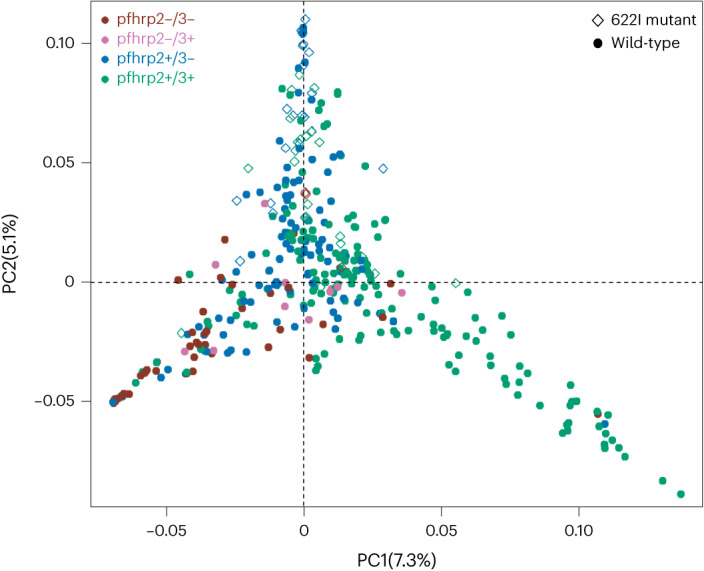
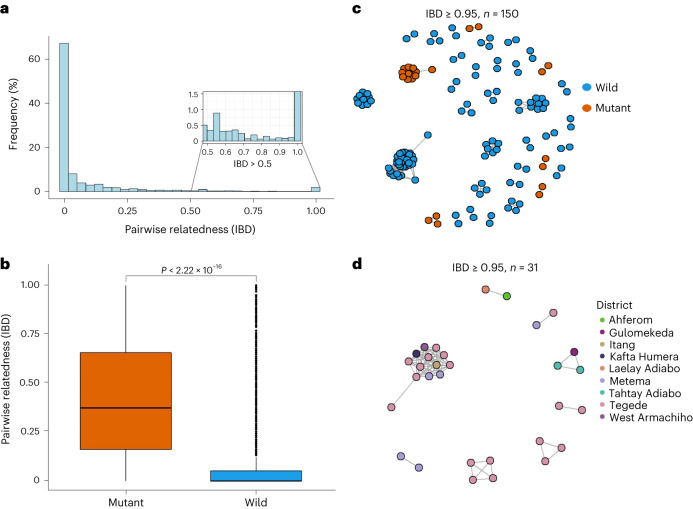
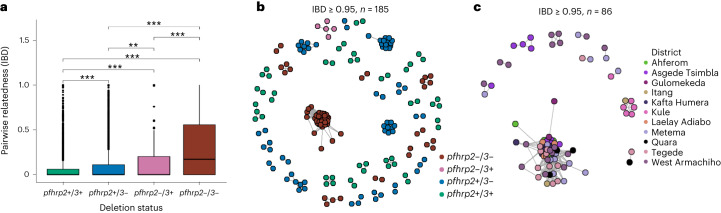
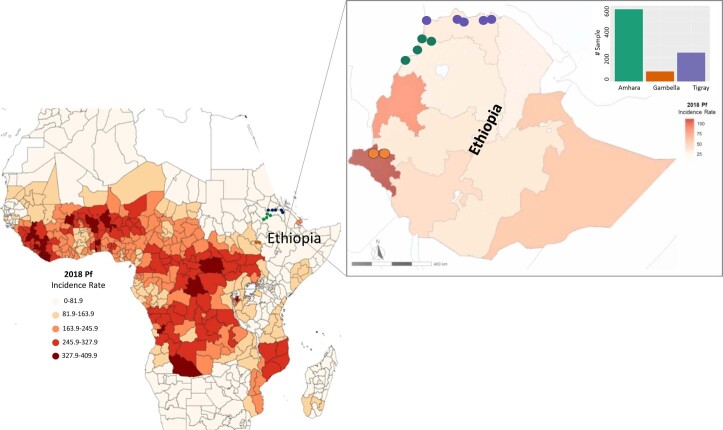
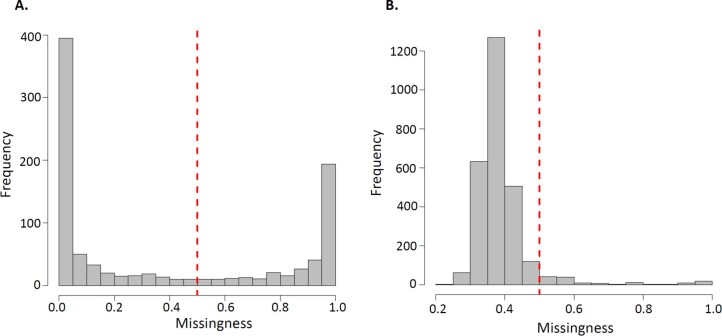
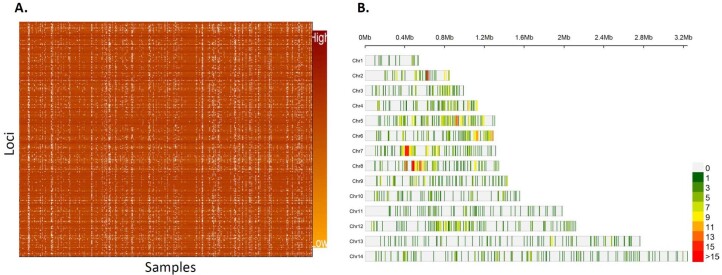
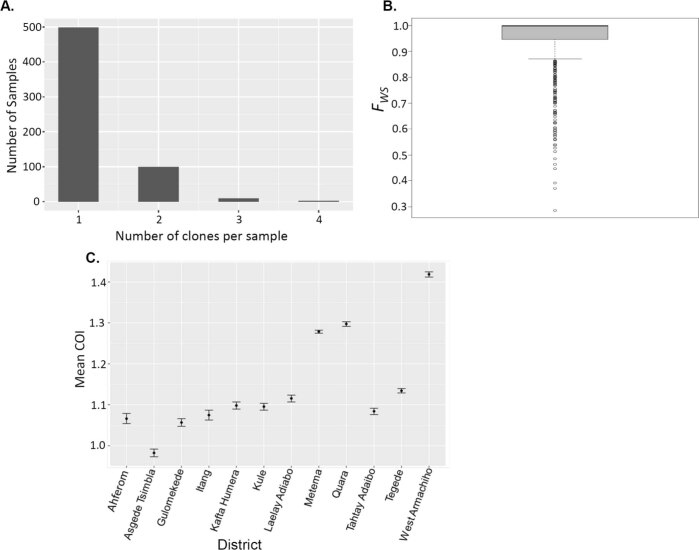
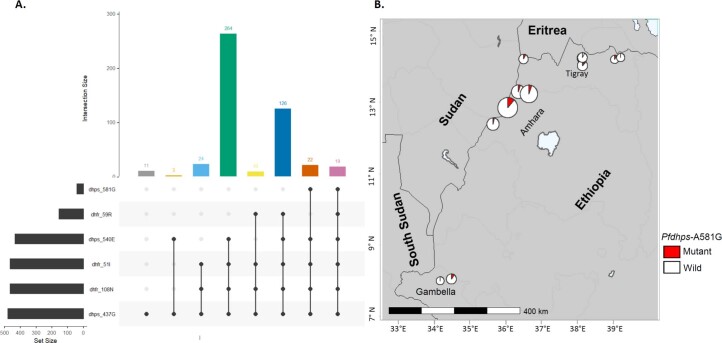
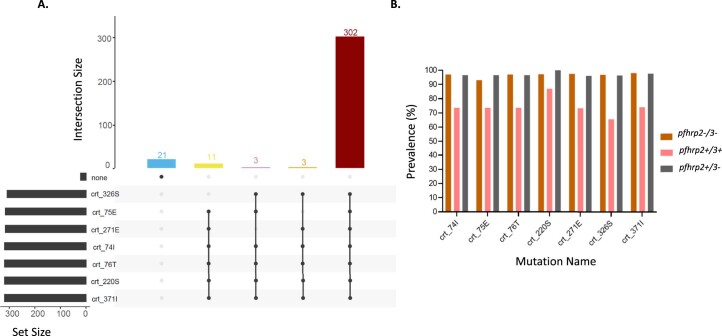
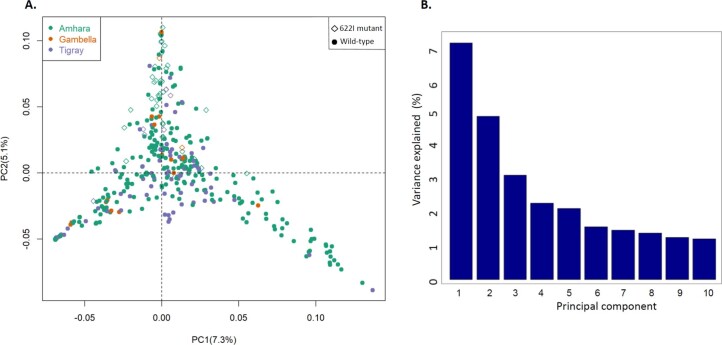
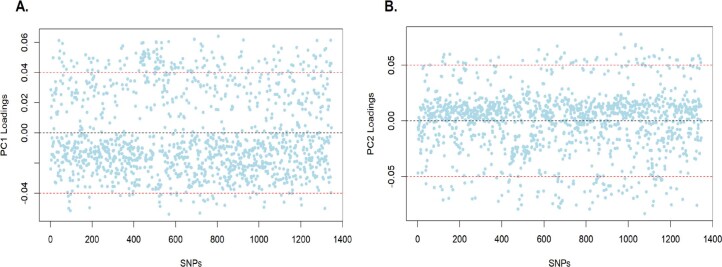
Diagnosis and treatment of Plasmodium falciparum infections are required for effective malaria control and are pre-requisites for malaria elimination efforts; hence we need to monitor emergence, evolution and spread of drug- and diagnostics-resistant parasites. We deep sequenced key drug-resistance mutations and 1,832 SNPs in the parasite genomes of 609 malaria cases collected during a diagnostic-resistance surveillance study in Ethiopia. We found that 8.0% (95% CI 7.0-9.0) of malaria cases were caused by P. falciparum carrying the candidate artemisinin partial-resistance kelch13 (K13) 622I mutation, which was less common in diagnostic-resistant parasites mediated by histidine-rich proteins 2 and 3 (pfhrp2/3) deletions than in wild-type parasites (P = 0.03). Identity-by-descent analyses showed that K13 622I parasites were significantly more related to each other than to wild type (P < 0.001), consistent with recent expansion and spread of this mutation. Pfhrp2/3-deleted parasites were also highly related, with evidence of clonal transmissions at the district level. Of concern, 8.2% of K13 622I parasites also carried the pfhrp2/3 deletions. Close monitoring of the spread of combined drug- and diagnostic-resistant parasites is needed.


Conflict of interest statement

J.B.P. reports research support from Gilead Sciences, non-financial support from Abbott Diagnostics and consulting from Zymeron Corporation, all outside the scope of the current work. All other authors have no competing interests.

Figures

Fig. 1
Fig. 1. Prevalence of K13 and key drug-resistance mutations in Ethiopia.
a, Spatial distribution of K13 622I mutation at the district (pie charts) and regional (bar plot) levels. Colours indicate mutation status and pie chart size is proportional to sample size per district. The black triangle indicates the location where K13 622I mutation was reported previously. b, Prevalence of non-synonymous mutations across the K13 gene, coloured according to WHO ACT resistance marker category. K13 gene annotation shows 1–350 amino-acid residues in the poorly conserved Plasmodium-specific region and 350–726 residues in the beta propeller domain where validated resistance mutations are located. c, Prevalence of mutations across four key P. falciparum genes (colours) associated with commonly used antimalarial drugs.
Fig. 2
Fig. 2. Frequency of key drug-resistance mutation combinations.
The number of times (top right) each combination of mutations (bottom right) was observed is displayed, including K13 622I, pfmdr1 N86 (wild), 184F (mutant) and D1246 (wild); and pfcrt genes. Only samples (n = 446) with complete genotypes across all loci representing monogenomic or the dominant haplotype in polygenomic infections are shown.
Fig. 3
Fig. 3. K13 622I mutation among pfhrp2/3-deleted and non-deleted parasite populations.
a, Comparison of mean K13 622I mutation prevalence (P = 0.03, unpaired Student’s t-test, two-tailed) between pfhrp2/3 double (n = 119) and pfhrp2/3 non-deleted (n = 223) parasite populations by district across three regions in Ethiopia. b, Relationship between pfhrp2/3 double-deleted parasite prevalence and K13 622I mutation prevalence by district. Prevalence estimates are weighted (see Supplementary Table 2). Orange points represent districts where parasites harbouring both pfhrp2/3 deletions and K13 622I mutations are observed. The boxplot centre lines in a show the median value, the upper and lower bounds show the 25th and 75th quantiles, respectively, and the upper and lower whiskers show the largest and smallest values, respectively.
Fig. 4
Fig. 4. PCA of P. falciparum populations annotated by K13 622I and pfhrp2/3 deletion genotypes.
Colours indicate pfhrp2/3 deletion status and shape indicates K13 622I mutation status. The percentage of variance explained by each principal component is presented.
Fig. 5
Fig. 5. Pairwise IBD sharing and relatedness networks suggest clonal transmission and expansion of K13 622I parasites.
a, Pairwise IBD sharing across all three regions of Ethiopia. The plot shows the probability that any two isolates are identical by descent, where the x axis indicates IBD values ranging 0–1 and the y axis indicates the frequency (%) of isolates sharing IBD. The inset highlights highly related parasite pairs from out of total pairs (n = 44,883), with a heavy tail in the distribution and some highly related pairs of samples having IBD ≥ 0.95. b, Pairwise IBD sharing within parasites carrying K13 622I vs wild type (P < 0.001, two-tailed, Mann–Whitney U-test). Boxes indicate the interquartile range, the line indicates the median, the whiskers show the 95% confidence intervals and black dots show outlier values. P value determined using Mann–Whitney test is shown. c, Relatedness network of highly related parasite pairs (n = 150) sharing IBD ≥ 0.95. Colours correspond to K13 622I mutant and wild parasites. d, Relatedness network of only K13 622I parasite pairs (n = 31) sharing IBD ≥ 0.95 at the district level/local scale. Colours correspond to districts across three regions in Ethiopia. In both c and d, each node identifies a unique isolate and an edge is drawn between two isolates if they share their genome above IBD ≥ 0.95. Isolates that do not share IBD ≥ 0.95 of their genome with any other isolates are not shown.
Fig. 6
Fig. 6. Pairwise IBD sharing and relatedness networks suggest independent emergence and clonal spread of pfhrp2/3-deleted parasites.
a, Pairwise IBD sharing by pfhrp2/3 deletion status (***P < 0.001, **P < 0.01, Kruskal–Wallis test). Boxes indicate the interquartile range, the line indicates the median, the whiskers show the 95% confidence intervals and black dots show outlier values. b, Relatedness network of highly related parasite pairs sharing IBD ≥ 0.95. Each node identifies a unique isolate and an edge is drawn between two isolates if they share their genome at IBD ≥ 0.95. Isolates that do not share IBD ≥ 0.95 of their genome with any other isolates are not shown. Colour codes correspond to pfhrp2/3 deletion status. c, Relatedness network of pfhrp2/3 double-deleted parasite pairs with IBD ≥ 0.95 at district level/local scale. Colours correspond to districts across three regions of Ethiopia.
Extended Data Fig. 1
Extended Data Fig. 1. Plasmodium falciparum incidence rate in 2018 and distribution of sequenced samples (n = 609).
Colors in the heat map indicate P. falciparum incidence rate per thousand cases in Africa year 2018. Zoomed Ethiopian map shows spatial distribution of sequenced samples at district level (colour dots in map) and regional level (color bar plot) and heat map indicate P. falciparum incidence rate per thousand cases in 2018 at regional level. Data source for this figure (https://data.malariaatlas.org).
Extended Data Fig. 2
Extended Data Fig. 2. PCR parasitemia distribution and association between sequencing coverage and parasitaemia.
A) Density plot showing parasitemia distribution with median parasitemia = 1411 parasite/ul for all successfully sequenced samples (n = 609). B) Association between sequencing coverage and parasitaemia. The MIP sequencing success is parasitaemia dependent as shown in the heatmap color. n represents the number of samples used in each panel. The boxplot centre lines in B, show the median value, the upper and lower bounds show the 25th and 75th quantiles, respectively, and the upper and lower whiskers show the largest and smallest values, respectively.
Extended Data Fig. 3
Extended Data Fig. 3. Sample and SNP missingness across sequenced samples using genome-wide MIP panel.
A) Samples with >50% low-coverage loci were dropped as shown broken read line. B) Variant sites were then assessed by the same means in terms of the proportion of low-coverage samples, and sites with >50% low-coverage samples were dropped. Broken read line shows 50% threshold criteria we used to remove samples and loci from downstream analyses.
Extended Data Fig. 4
Extended Data Fig. 4. Successfully sequenced samples across three regions in Ethiopia and retained genome wide loci.
A) Heatmap color shows samples (n = 609, columns) and loci (n = 1395, rows) coverage retained after filtering (Extended Data Fig. 3) for downstream analysis. B) Distribution of retained SNPs across Plasmodium falciparum chromosomes. The plot shows distribution of 1395 retained high quality biallelic SNPs across the 14 P. falciparum chromosomes within 0.025 Mb window size. Color coded from light grey for masked regions with no SNPs to red for regions containing high number SNPs per chromosome.
Extended Data Fig. 5
Extended Data Fig. 5. Complexity of infections.
A) Distribution Number of clones per sample across all genotyped samples (n = 609) showing most of isolates carrying one clone (COI = 1). B) Cumulative within-infection FWS fixation showing majority of isolates classified as monogenomic (FWS > 0.95). Number of clones per sample. C) Spatial heterogeneity of mean complexity of infections per district across three regions in Ethiopia. Vertical lines show 95% confidence intervals. Samples size per district ranges 9–167 (see supplementary table 1).
Extended Data Fig. 6
Extended Data Fig. 6. Prevalence of Pfdhfr and Pfdhps mutations across three regions in Ethiopia.
A) UpSet plots showing the number of times each combination of mutations was seen for Pfdhfr and Pfdhps. B) Spatial distribution of Pfdhps A581G mutation at district level. Colors indicate mutation status and size of pie chart is proportional to sample size per district.
Extended Data Fig. 7
Extended Data Fig. 7. Prevalence of Pfcrt mutations across three regions in Ethiopia.
The UpSet plot shows the number of times each combination of mutation was observed within pfcrt (A), and prevalence of these mutations by pfhrp2/3 status (B). Note that the prevalence within pfhrp2-/3+ was not estimated due to small sample size.
Extended Data Fig. 8
Extended Data Fig. 8. Population structure of P. falciparum in Ethiopia.
A) Principal component analysis P. falciparum populations per region. Colors indicate sample origin and shape indicates K13 622I mutation status (circle indicates wild and diamond indicates mutant). Percentage of variance explained by each principal component presented (%). B) Percent of overall variance explained by the first 10 principal components during PCA.
Extended Data Fig. 9
Extended Data Fig. 9. PCA loading values.
PC1 (A) and PC2 (B) are shown by SNP. Cutoffs show SNPs that highly contribute to positive or negative distribution of samples in the PC plots.

References

    1. World Malaria Report 2022 (World Health Organization, 2022).
    1. Ringwald, P., Shallcross, L., Miller, J. M. & Seiber, E. Susceptibility of Plasmodium falciparum to Antimalarial Drugs: Report On Global Monitoring 1996–2004https://apps.who.int/iris/handle/10665/43302 (WHO, 2005).
    1. Wellems TE, Plowe CV. Chloroquine‐resistant malaria. J. Infect. Dis. 2001;184:770–776. doi: 10.1086/322858. - DOI - PubMed
    1. Ross LS, Fidock DA. Elucidating mechanisms of drug-resistant Plasmodium falciparum. Cell Host Microbe. 2019;26:35–47. doi: 10.1016/j.chom.2019.06.001. - DOI - PMC - PubMed
    1. Takala-Harrison S, Laufer MK. Antimalarial drug resistance in Africa: key lessons for the future. Ann. N. Y. Acad. Sci. 2015;1342:62–67. doi: 10.1111/nyas.12766. - DOI - PMC - PubMed

Publication types

MeSH terms