. 2023 Oct;8(10):1880-1895.
doi: 10.1038/s41564-023-01459-y. Epub 2023 Aug 28.

Parkinson's disease kinase LRRK2 coordinates a cell-intrinsic itaconate-dependent defence pathway against intracellular Salmonella

Affiliations

Parkinson's disease kinase LRRK2 coordinates a cell-intrinsic itaconate-dependent defence pathway against intracellular Salmonella

Huan Lian et al. Nat Microbiol. 2023 Oct.

Abstract

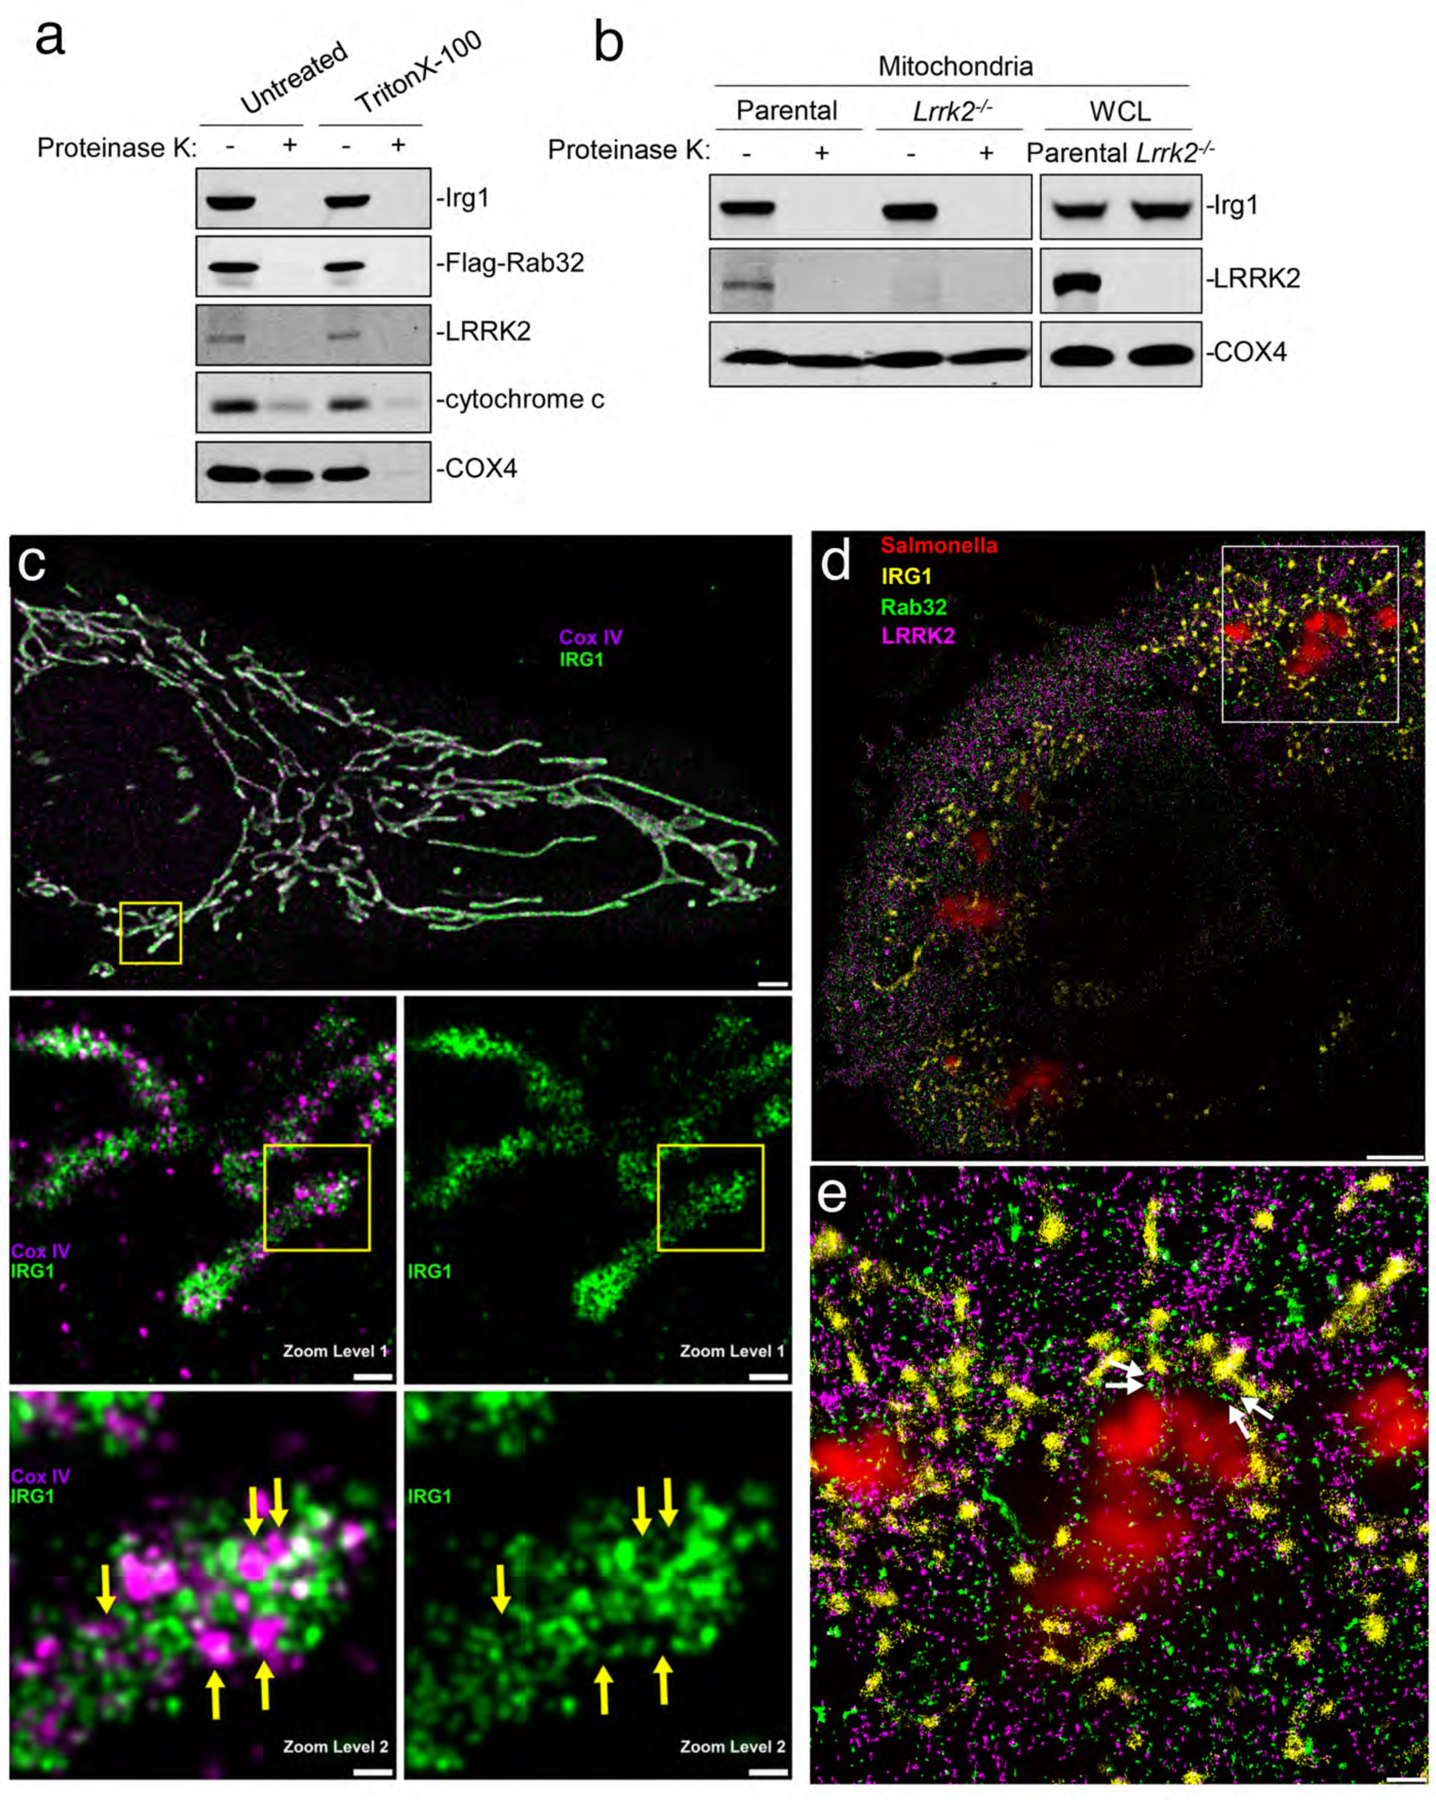
Cell-intrinsic defences constitute the first line of defence against intracellular pathogens. The guanosine triphosphatase RAB32 orchestrates one such defence response against the bacterial pathogen Salmonella, through delivery of antimicrobial itaconate. Here we show that the Parkinson's disease-associated leucine-rich repeat kinase 2 (LRRK2) orchestrates this defence response by scaffolding a complex between RAB32 and aconitate decarboxylase 1, which synthesizes itaconate from mitochondrial precursors. Itaconate delivery to Salmonella-containing vacuoles was impaired and Salmonella replication increased in LRRK2-deficient cells. Loss of LRRK2 also restored virulence of a Salmonella mutant defective in neutralizing this RAB32-dependent host defence pathway in mice. Cryo-electron tomography revealed tether formation between Salmonella-containing vacuoles and host mitochondria upon Salmonella infection, which was significantly impaired in LRRK2-deficient cells. This positions LRRK2 centrally within a host defence mechanism, which may have favoured selection of a common familial Parkinson's disease mutant allele in the human population.


Conflict of interest statement

Competing Interests Statement All authors declare no competing interests

Figures

Extended Data Fig. 1.
(a and b) LRRK2 is required for efficient itaconate delivery to the Salmonella-containing vacuole. Parental (control) and Lrrk2−/− Raw264.7 cells were infected with S. Typhi (MOI = 6) encoding an eGFP-based itaconate biosensor and the number of cells expressing eGFP was determined 20 hours after infection. Each square and circle represents the mean of an individual experiment experiments in which at least 200 infected cells were examined (b). The p value (unpaired two-tailed Student’s t test) of the indicated comparison is shown. Infected cells were fixed, stained with DAPI (blue) to visualize nuclei, and stained with an anti-Salmonella LPS antibody along with Alexa 594-conjugated anti-rabbit antibody (red) to visualize all bacteria. Representative fields of infected cells are shown (a) (scale bar = 5 μm). (c-g) Absence of LRRK2 does not influence the uptake of Salmonella into phagocytic cells. Raw264.7 or DC2.4 parental (control) and Lrrk2−/− cells, as well as bone marrow-derived macrophages (BMDM) derived from C57BL/6 and Lrrk2−/− mice were infected with either wild-type S. Typhi (MOI = 6) or a S. Typhimurium ΔgtgE ΔsopD2 mutant strain (MOI = 3) (as indicated) and the number of CFU was determined 1 hr after infection. Each square or circle represents the CFU in an independent measurement. The mean ± SD and p values (unpaired two-tailed Student’s t test) of the indicated comparisons are shown.
Extended Data Fig. 2.
Extended Data Fig. 2.. Salmonella infection results in LRRK2 activation.
DC2.4 cells were treated with LPS or infected with the indicated bacterial strains for the indicated times. The activation of LRRK2, assessed by its phosphorylation at S935, was then analyzed by immunoblotting with the indicated antibodies.
Extended Data Fig. 3.
Extended Data Fig. 3.. LRRK2 scaffolds the formation of RAB32 and IRG1 complex.
(a and b) LRRK2 interacts with RAB32 and IRG1. HEK293T cells were transiently co-transfected with a plasmid expressing GFP-LRRK2 and a plasmid expressing either FLAG-RAB32 (a) or FLAG-IRG1 (b). Twenty hours after transfection cells were infected with S. Typhi (MOI = 6) and 4 hs after infection, cell lysates were analyzed by immunoprecipitation and immunoblotting with antibodies against the FLAG epitope and GFP. (c-e) The kinase activity of LRRK2 is not required to form a complex with RAB32 and IRG1. (c and d) Raw264.7 (c) or DC2.4 (d) cells stably expressing FLAG-RAB32 or FLAG-IRG1 were pre-treated with the LRRK2 kinase inhibitor GSK2578215A for 90 min, infected with the S. Typhimurium ΔgtgE ΔsopD2 mutant strain (MOI=3) (c) or treated with LPS (d). Eighteen hours after infection or 5 or 20 hs after LPS treatment, cell lysates were analyzed by immunoprecipitation and immunoblotting with the indicated antibodies. (e) HEK293T cells were transiently co-transfected with plasmids expressing GFP-RAB32, FLAG-Irg1, and the indicated forms of LRRK2: wild type (WT), kinase defective (3XKD = LRRK2K1906A/D1994A/D2017A), and constitutively active (LRRK2G2019S). Twenty hours after transfection, cell lysates were analyzed by immunoprecipitation and immunoblotting with the indicated antibodies. The quantification of the intensity of the RAB32 band relative to the intensity of the IRG1 band is shown in. Each circle, square, or triangle represents a measurement in an independent experiment. The mean ± SD and p values (unpaired two-tailed Student’s t test) of the indicated comparisons are shown. (f and g) HEK293T parental or LRRK2−/− cells were transfected with GFP-RAB32 and FLAG-IRG1 for 20 hs. Cell lysates were then analyzed by immunoprecipitation with anti-FLAG and immunoblotting with anti-GFP antibody. The quantification of the intensity of the RAB32 band relative to the intensity of the IRG1 band is shown (f). Each circle or square represents a measurement in an independent experiment. The mean ± SD and p values (unpaired two-tailed Student’s t test) of the indicated comparisons are shown. (g) Raw264.7 parental or Lrrk2−/− cells stably expressing FLAG-RAB32 were left untreated, treated with LPS, or infected with S. Typhimurium ΔgtgE ΔsopD2 mutant strain (MOI = 3) for 18 hs. Cell lysates were then analyzed by immunoprecipitation with anti-FLAG and immunoblotting with the indicated antibodies.
Extended Data Fig. 4.
Extended Data Fig. 4.. Localization of LRRK2, RAB32, and IRG1. (a and b) LRRK2, RAB32, and IRG1are associated with the mitochondria accessible to protease digestion.
DC2.4 cells stably expressing RAB32 (a), or DC2.4 parental (control) and Lrrk2−/− cells (b) were treated with LPS for 18 hs, mitochondria were purified and treated with proteinase K or left untreated, and subsequently analyzed by immunoblotting with the indicated antibodies. (c) Two color DNA-PAINT super-resolution image demonstrating that IRG1 does not co-localize with the mitochondrial matrix protein Cox IV. The top panel presents a HeLa cell expressing GFP-tagged IRG1 (green). Cells were fixed and stained with nanobodies to the GFP epitope, and primary and secondary antibodies to Cox IV (magenta). Nanobodies and secondary antibodies were labeled with a single stranded DNA oligomer acting as a docking site for DNA-PAINT super-resolution microscopy. First and second zoom levels show that Cox IV and IRG1 are spatially excluded from each other. The yellow arrows in zoom level two highlight examples of the spatial exclusion of Cox IV and IRG1. Scale bars 2 μm (top panel), 400 nm (zoom level 1) and 100 nm (zoom level 2). (d and e) Three-plex DNA-PAINT super-resolution image showing proximity of RAB32, LRRK2, and IRG1. (d) Hek293T cells expressing GFP-tagged LRRK2 (purple – DNA-PAINT), FLAG-tagged Rab32 (green – DNA-PAINT), and M45-tagged IRG1 (yellow – DNA-PAINT) were infected with S. Typhi carrying plasmid encoding an mCherry-based itaconate reporter (red – diffraction limited image). Cells were fixed and stained with nanobodies to the GFP epitope, and M45 and FLAG tags were labeled with primary antibodies and secondary antibodies conjugated to a single stranded DNA oligomer acting as a docking site for DNA-PAINT super-resolution microscopy. (e) The zoom in shows the spatial proximity of the three proteins in the proximity of S. Typhi expressing the itaconate reporter. The white arrows in the zoom-in highlight examples of the proximity cluster of the three proteins. Scale bars 5 μm (d), 1 μm (e).
Extended Data Fig. 5.
Extended Data Fig. 5.. Inhibition of the mitochondrial tricarboxylate transporter SLC25A1 impairs itaconate delivery to the Salmonella-containing vacuole.
(a and b) HeLa cells stably expressing EGFP-tagged IRG1 were pre-treated with the SLC25A1 transporter inhibitor CTPI-2 for 3, 6, or 18 hrs (as indicated), and then infected with wild-type S. Typhi (MOI = 6) encoding a luciferase-based itaconate biosensor. The levels of luciferase activity in the cell lysates were then measured 3 hs after infection. Each circle or square represents a single luciferase measurement. The mean ± SD and p values (unpaired two-tailed Student’s t test) of the indicated comparisons are shown. (a) and (b) show results of two independent experiments. (c and d) Inhibition of the mitochondrial tricarboxylate transporter SLC25A1 does not impair IRG1 expression or overall itaconate biosynthesis. (c) HeLa cells stably expressing EGFP-tagged IRG1 were pre-treated with the SLC25A1 transporter inhibitor CTPI-2 for 3, 6, or 18 hrs (as indicated), and then infected with wild-type S. Typhi (MOI = 6) encoding a luciferase-based itaconate biosensor as indicated in Extended Data Fig. 10. The levels of IRG1 3, 6 or 18 hours after CTPI-2 treatment were evaluated by western immunoblot with the indicated antibodies. (d) HeLa cells stably expressing EGFP-tagged IRG1 were pre-treated with the SLC25A1 transporter inhibitor CTPI-2 for 18 hrs, and the levels of itaconate were measured as indicated in Materials and Methods. Each square represents a single measurement and the mean and SD are shown.
Extended Data Fig. 6.
Extended Data Fig. 6.. Tomographic slices of S. Typhi infected cells at different times after infection.
HeLa cells expression IRG1 (a and b) or BMDMs obtained from C57BL/6 mice (c and d) were infected with S. Typhi and 1 (a and c) and 3 (b and d) hrs after infection were processed for cryo-ET imaging. Shown are representative tomographic slices showing that the appearance of S. Typhi within cells over time. Bacteria within HeLa-IRG1 cells 1 hr after infection appear normal, with many ribosomes and an intact bacterial envelope. However, bacteria within HeLa-IRG1 cells 3 hs post-infection or within BMDMs at 1 and 3 hrs post infection exhibit altered morphology. Mi: mitochondria
Extended Data Fig. 7.
Extended Data Fig. 7.. Visualization of tethers at the SCV-mitochondria interface.
(a-e) 3D renderings of the SCV-mitochondria interfaces shown in Figures 4f, 4j, 4k, 4o, and 4p, respectively. Magenta, yellow, and green represent bacterial, vacuolar, and mitochondrial membranes, respectively. Intermembrane tethers are depicted in white. Please refer to the main Figure 4 figure legend for experimental details. (f-j) Top-down views of the corresponding interfaces in Panels (a-e), revealing vacuolar membrane surfaces decorated with intermembrane tethers.
Extended Data Fig. 8.
Extended Data Fig. 8.. Itaconate delivery and bacterial growth in cells used for cryo-ET analysis.
(a) HeLa cells stably expressing IRG1 or BMDMs from C57BL/6 mice treated with LPS (200ng/ml) for 3 hours were infected with S. Typhi (MOI=10), and the number of CFU was determined 1 and 3 hrs after infection. Each circle represents the CFU in an independent measurement; the mean ± SEM of all the measurements and p values of the indicated comparisons (two-sided Student’s t test) are shown. ns, not significant. ****p < 0.0001. (b and c) HeLa cells stably expressing IRG1 (b) or BMDMs from C57BL/6 mice treated with LPS (200ng/ml) for 3 hrs (c) were infected with S. Typhi (MOI=10) carrying a plasmid encoding the itaconate nanoluciferase biosensor. One and three hours after infection, the levels of nanoluciferase were measured in lysates of the infected cells. Each circle represents a single luciferase measurement. The mean ± SD and p-values of the indicated comparisons (two-sided Student’s t-test) are shown. ****p < 0.0001. (d-g) BMDMs obtained from C57BL/6 (WT) or Hps4−/− were infected with S. Typhi (MOI = 10) carrying a plasmid encoding the itaconate nanoluciferase biosensor, and the number of CFU was determined 1 (a) or 3 (c) hs after infection. Alternatively, the levels of nanoluciferase were measured in lysates of the infected cells (b and d). Each circle represents the CFU in independent measurements (a and c) or a single luciferase measurement (b and d). Shown are the mean ± SEM of all the measurements; p values of the indicated comparisons (two-sided Student’s t test) are shown. **p < 0.01 and ***p < 0.001, ****p < 0.0001. (h and i) Itaconate delivery and intracellular growth of S. Typhi expressing gtgE in cells used for cryo-ET analysis. (h and i) HeLa cells stably expressing IRG1 were infected with S. Typhi or S. Typhi- expressing gtgE (MOI=10) carrying a plasmid encoding the itaconate nanoluciferase biosensor. The number of CFU (a) or the level of luciferase activity (b) was determined 1 hour or 3 hours after infection. Each circle represents a single measurement. Values are the mean ± SEM of all the measurements and p values of the indicated comparisons (two-sided Student’s t test) are shown. *p < 0.05, **p < 0.01, ***p < 0.001, ****p < 0.0001.
Extended Data Fig. 9.
Extended Data Fig. 9.. Expression of the S. Typhimurium effector protein GtgE in S. Typhi does not prevent SCV-mitochondria association and tethering.
(a) Tomographic slice showing S. Typhi strain expressing GtgE within its replication vacuole and surrounding mitochondria (Mi) intimately interacting with the vacuolar membrane (VM). (b) 3D-rendering of the tomogram shown in panel (a)(z=86 slices). Mitochondria is depicted in green, the SCV membrane in yellow, bacterial envelope in blue, inter membrane tethers in white, type III secretion machines in light blue, and bacterial ribosomes in grey (see close ups of the SCV-mitochondria interface in Fig. S14).
Extended data Fig. 10.
Extended data Fig. 10.. Model for the role of LRRK2 in itaconate delivery to the Salmonella containing vacuole.
LRRK2 may coordinate the close apposition between the Salmonella-containing vacuole (SCV) and the mitochondria (not depicted in this model) as it has been proposed to do with other intracellular organelles (64). In addition, as depicted in this model, through its ability to scaffold a complex between RAB32, IRG1, and SLC25A1, LRRK2 may coordinate the localized synthesis of itaconate at the mitochondria/SCV interface.(generated with the help of Biorender (www.biorender.com).
Fig. 1:
Fig. 1:. LRRK2 is a component of the RAB32-dependent host defense pathway against Salmonella.
(a) Western blot analysis of cell lysates of parental and CRISPR/Cas9-generated Lrrk2−/− Raw264.7 or DC2.4 cells. (b and c) Raw264.7 or DC2.4 parental (control) and Lrrk2−/− cells were infected with either wild-type S. Typhi (b) (MOI = 6) or S. Typhimurium ΔgtgE ΔsopD2 mutant strain (MOI = 3) (c) encoding a luciferase-based itaconate biosensor, and the levels of luciferase in the cell lysates were measured 20 hs after infection. Each circle or square represents a single luciferase measurement. The mean ± SD and p values of the indicated comparisons (unpaired two-tailed Student’s t test) are shown. (d) Alternatively, Raw264.7 parental (control) and Lrrk2−/− cells were infected with S. Typhi strains encoding an eGFP-based itaconate biosensor (MOI = 6) and the percentage of bacterial cells expressing eGFP were determined 5 hs after infection. Each square and circle represent the mean of an individual experiment in which at least 200 infected cells were examined. The p value (unpaired two-tailed Student’s t test) of the indicated comparison is shown. Infected cells were fixed, stained with DAPI (blue) to visualize nuclei, and stained with an anti-Salmonella LPS antibody along with Alexa 594-conjugated anti-rabbit antibody (red) to visualize all bacteria. Representative fields of infected cells are shown (scale bar = 5 μm). (e) Itaconate levels in BMDMs obtained from the indicated mice before and after LPS treatment to induce the expression of IRG1. Values represent the mean ± SD of three independent measurements. (f-k) Raw264.7 or DC2.4 parental (control) and Lrrk2−/− cells, as well as bone marrow-derived macrophages (BMDM) from C57BL/6 or Lrrk2−/− mice were infected with either wild-type S. Typhi (MOI = 6, wild type S. Typhimurium (MOI = 3), or an S. Typhimurium ΔgtgE ΔsopD2 mutant strain (MOI = 3) (as indicated) and the number of CFU was determined 20 hs after infection. Each square or circle represents the CFU in an independent measurement. The mean ± SD and p values (unpaired two-tailed Student’s t test) of the indicated comparisons are shown. (l and m) C57BL/6 or Lrrk2−/− mice were intraperitoneally infected with wild-type S. Typhimurium or the ΔgtgE ΔsopD2 isogenic mutant derivative (102 CFU), and 4 days after infection bacterial loads in the spleen of the infected animals were determined. Each circle or square represents the CFU of the spleen of an individual animal. The mean ± SD and p values (unpaired two-tailed Student’s t test) of the indicated comparisons are shown.
Fig. 2:
Fig. 2:. The kinase activity of LRRK2 is required for its contribution to the RAB32-dependent pathogen restriction pathway.
(a and b) Raw264.7 or HT29 cells were treated with LPS or infected with the indicated bacterial strains for the indicated times. The activation of LRRK2, assessed by its phosphorylation at S935, was then analyzed by immunoblotting with the indicated antibodies. (c and d) Raw264.7 or DC2.4 cells were pre-treated with the LRRK2 inhibitor GSK2578215A for 90 min, infected with either wild-type S. Typhi (MOI = 6) (c) or the S. Typhimurium ΔgtgE ΔsopD2 mutant strain (MOI = 3) (d), both encoding a luciferase-based itaconate biosensor, and the levels of luciferase in the cell lysates were measured 20 hs after infection. Each circle or square represents a single luciferase measurement. The mean ± SD and p values (unpaired two-tailed Student’s t test) of the indicated comparisons are shown. (e and f) Raw264.7 or DC2.4 cells were pre-treated with the LRRK2 inhibitor GSK2578215A for 90 min, infected with wild-type S. Typhi (MOI = 6) (e) or the S. Typhimurium ΔgtgE ΔsopD2 mutant strain (MOI = 3) (f), and the number of CFU was determined 20 hs after infection. Each circle or square represents a single measurement. The mean ± SD and the p values (unpaired two-tailed Student’s t test) of the indicated comparisons are shown.
Fig. 3:
Fig. 3:. LRRK2 scaffolds the formation of RAB32-IRG1 complex.
(a and b) LRRK2 interacts with RAB32. HEK293T cells were transiently co-transfected with a plasmid expressing GFP-LRRK2 and a plasmid expressing FLAG-RAB32. Twenty hours after transfection cells were infected with the S. Typhimurium ΔgtgE ΔsopD2 mutant strain (MOI = 3) and 4 hs after infection, cell lysates were analyzed by immunoprecipitation and immunoblotting with antibodies against the FLAG epitope and GFP, respectively. The quantification of the intensity of the GFP-LRRK2 band is shown in (b). Each circle, square, or triangle represents a measurement in an independent experiment. The mean ± SD and p values (unpaired two-tailed Student’s t test) of the indicated comparisons are shown. (c and d) LRRK2 interacts with IRG1. HEK293T cells were transiently co-transfected with a plasmid expressing GFP-LRRK2 and a plasmid expressing FLAG-IRG1. Twenty hours after transfection cells were infected with the S. Typhimurium ΔgtgE ΔsopD2 mutant strain (MOI = 3) and 4 hs after infection, cell lysates were then analyzed by immunoprecipitation and immunoblotting with antibodies against the FLAG epitope and GFP, respectively. The quantification of the intensity of the GFP-LRRK2 band is shown in (d). Each circle, square, or triangle represents a measurement in an independent experiment. The mean ± SD and p values (unpaired two-tailed Student’s t test) of the indicated comparisons are shown. (e and f) LRRK2 promotes the formation of the RAB32-IRG1 complex. Raw264.7 parental (control) or Lrrk2−/− cells stably expressing FLAG-RAB32 were left uninfected or infected with the S. Typhimurium ΔgtgE ΔsopD2 mutant strain (MOI = 3) for 18 hs. Cell lysates were then analyzed by immunoprecipitation and immunoblotting with antibodies against the FLAG epitope, endogenous IRG1 or LRRK2, and β-actin (as a loading control). The quantification of the intensity of the Irg1 band relative to the intensity of the RAB32 band is shown in (f). Each circle, square, or triangle represents a measurement in an independent experiment. The mean ± SD and p values (unpaired two-tailed Student’s t test) of the indicated comparisons are shown.
Fig. 4:
Fig. 4:. Intimate association of the SCV with the mitochondria observed by cryo-electron tomography.
(a) Cryo-fluorescence microscopy (cryo-fLM) of cultured HeLa cells stably expressing IRG1-GFP (green) and infected with S. Typhi encoding an mCherry itaconate biosensor (red). Specimen were vitrified in liquid ethane 3 hs post infection. White dashed line marks the cell boundary. The yellow-dotted square region was targeted for further imaging analysis. (b) Scanning electron microscopy (SEM) image of the S. Typhi infected HeLa cell shown in Panel (a) before cryo-focused ion beam (cryo-FIB) milling. Two rectangular boxes show areas targeted for ablation during the cryo-FIB milling. (c) SEM image of the cryo-lamella (<200nm thick) containing the target bacteria. Cryo-fLM signals (green: IRG1-GFP; red: mCherry itaconate biosensor) are overlayed on the SEM image. (d) Cryo-electron tomography (cryo-ET) image of the highlighted area in panel (c) showing close association of the SCV and mitochondria. (e-f) Intermembrane tethers bridge the SCV-mitochondria interface. (e) Zoom-in image of the tomographic slice at the SCV-mitochondria interface highlighted in Panel (d). Yellow and green transparent lines overlay the vacuolar and mitochondria membranes, respectively. White arrows denote the intermembrane tethers. (f) 3-dimentional rendering of the SCV-mitochondria interface (z=110 slices). Bacterial, vacuolar, and mitochondrial membranes are shown in magenta, yellow, and green, respectively, bacterial ribosomes are shown in grey and intermembrane tethers are shown in white. Following the subtomogram averaging of the intermembrane tethers, segmented volume of the tether was mapped back into the original tomogram using the recalculated coordinates and Euler parameters. (g-k) Additional examples of SCV-mitochondria association in HeLa cells. Cryo-ET image showing close association of the SCV and mitochondria (g). The indicated zoom-in regions of the tomographic slice at the SCV-mitochondria interfaces are shown in (h-i), and the corresponding 3-dimentional renderings are shown in (j-k) (z=197 slices). The color scheme indicating bacterial, vacuolar, and mitochondrial membranes, bacterial ribosomes and intermembrane tethers is as indicated in (f). (l-p) Intermembrane tethers are also observed at the SCV-mitochondrial interface in BMDM infected with S. Typhi. BMDM isolated from C57BL/6 mice were cultured on cryo-EM grids and infected with S. Typhi encoding the mCherry itaconate biosensor for 1 h, and mCherry expressing S. Typhi cells were targeted for cryo-FIB milling and cryo-ET imaging. (l) Cryo-ET image showing close association of the SCV and mitochondria. The indicated zoom-in regions of the tomographic slice at the SCV-mitochondria interfaces are shown in (m) and (n), and the corresponding 3-dimentional renderings are shown in (o) and (p) (z=88 slices). (q) Measurement of the length of the vacuolar membrane (VM) and mitochondrial outer membrane (MiOM) interface. The X-Y plane density profiling function in tomographic software IMOD was used to measure the maximum length of the intimate contact between the VM and MiOM in both HeLa (blue) and BMDM (red) cells. Measurements were taken in 10 interfaces (N=10) from 3 independent experiments for both HeLa and BMDM cells. Dots in this scatter dot plot represent raw data. Solid lines within the box represent mean values (HeLa: 163.5 ± 95.6 nm, BMDM: 247.2 ± 162.7 nm). Welch’s t-test resulted in p-value of 0.1291 which suggest no significant difference between the distance that VM and MiOM makes contact in HeLa and BMDMs. (r) Measurement of the intermembrane distance between vacuolar membrane (VM) and the mitochondrial outer membrane (MiOM). The X-Y plane density profiling function in tomographic software IMOD was used to measure distance between VM and MiOM in both HeLa (blue) and BMDM (red). Measurements were taken at 30 interfaces (N=30) from three independent experiments in both HeLa and BMDM cells. Dots in this scatter dot plot represent raw data. Solid lines within the box represent mean values (HeLa: 15.82 ± 3.04nm, BMDM: 16.06 ± 4.35). Welch’s t-test resulted in p-value of 0.8098 which suggest no significant difference between the intermembrane spacings measured in HeLa and BMDMs. (s) Quantification of intermembrane tethers in HeLa and BMDMs. Positions of intermembrane tethers are identified as a part of particle picking procedure for the subsequent subtomogram averaging. Number of intermembrane tethers in both HeLa and BMDMs are divided by the total number of mitochondria that show visible intermembrane tethers. (t) 2- and 3-dimentional cross section of the subtomogram average map. The vertical length of the tether perpendicular to the membranes is ~15nm. Mitochondrial inner (MiIM) and outer (MiOM) membranes are shown in green and the SCV membrane (VM) is shown in yellow. M: mitochondria; S: S. Typhi.
Fig. 5:
Fig. 5:. LRRK2 is required for establishing a close association between the SCV and the mitochondria.
(a-n) Cryo-ET images showing the SCV and mitochondria in BMDMs obtained from C57BL/6 (a-d), BLOC3−/− (e-h), and Lrrk2−/− (l-n) mice, infected for 3 hs with a wild-type S. Typhi strain constitutively expressing mScarlet. Tomograms are shown in (a, e, i, l), and their respective 3D-renderings in (b-d, z=61slices, f-h, z=51 slices, j-k, z=50 slices, and m-n, z=71 slices) for C57BL/6 (WT), BLOC3−/−, and Lrrk2−/− BMDMs, as indicated. The SCV membrane is shown in yellow, mitochondria are shown in green, and inter-membrane tethers in white. Note the altered S. Typhi bacterial cell envelope architecture (denoted in pink) in BMDMs from C57BL/6 mice, and its normal appearance (denoted in blue) in BLOC3−/−, or Lrrk2−/− BMDMs. Also, while intermembrane tethers are readily visualized linking the mitochondria and the SCV in BMDMs from C57BL/6 and BLOC3−/− mice (highlighted in zoomed in panels c, d, g, and h), no tethers were visualized in BMDMs from Lrrk2−/− mice (i-n), even in the rare occasions when mitochondria and SCVs were seen in close proximity (l-n). (o) Quantification of the percentage of SCVs making intimate contact (a distance of ≤ 25nm) with mitochondria as observed by cryo-ET. A total of 32 cells were analyzed from two independent experiments in WT, BLOC3−/−, and Lrrk2−/− BMDM cells. Unpaired t-test was used to determine the statistical significance. n. s.: difference not statistically significant (p=0.8721). (p and q) Itaconate delivery to the SCV in BMDMs obtained from C57BL/6, BLOC3−/−, or Lrrk2−/− mice (as indicated). BMDMs were infected with wild type S. Typhi (MOI = 6) encoding a luciferase-based itaconate biosensor and the levels of luciferase in the cell lysates were measured 3 hs after infection. Each circle or square represents a single luciferase measurement. The mean ± SD and p values of the indicated comparisons (unpaired two-tailed Student’s t test) are shown. (r) Quantification of the percentage of bacteria contained within SCVs in close contact with mitochondria that show envelope alterations. A total of 21 bacteria were examined in two independent experiments with WT and BLOC3−/− BMDMs cells. Unpaired t-test was used to determine the statistical significance (p=0.0045).
Fig. 6.
Fig. 6.. Salmonella deploys its type III secretion system at the SCV-mitochondria interface.
(a and b) 3D-rendering of a close up of the mitochondria-SCV interface. Depicted are the intermembrane tethers (in white and denoted by white arrows) and the bacterial type III secretion machines encoded in its pathogenicity island 1 (in blue) (z=86 slices). (c and d) Tomographic slices showing the T3SS injectisomes deployed at the SCV-mitochondria interface. The sites where the needle tips make contact with the SCV membrane are marked with blue arrows. (e-h) Subtomogram average structure of the injectisome showing an assembled sorting platform, an indication of an active type III secretion machine. 2D vertical cross-section (e) and 3D rendering (f) of the subtomogram average show the needle complex base and the cytoplasmic sorting platform. 2D horizontal cross-section of the sorting platform at the position indicated with an arrow in panel (e) is shown in (g) and its 3D-rendering is shown (h) depicting the 6-fold symmetric pods (green) and central ATPase (yellow). The export apparatus component InvA is depicted in cyan, and bacterial membranes are colored in transparent blue.

References

    1. Randow F, MacMicking J & James L Cellular self-defense: how cell-autonomous immunity protects against pathogens. Science 340, 701–706. (2013). - PMC - PubMed
    1. Spanò S & Galán J A Rab32-dependent pathway contributes to Salmonella typhi host restriction. Science 338, 960–963 (2012). - PMC - PubMed
    1. Tang B Rab32/38 and the xenophagic restriction of intracellular bacteria replication. Microbes Infect 18, 595–603 (2016). - PubMed
    1. Li Y et al. Analysis of the Rab GTPase Interactome in Dendritic Cells Reveals Anti-microbial Functions of the Rab32 Complex in Bacterial Containment. Immunity 44, 422–437 (2016). - PubMed
    1. Baldassarre M et al. The Rab32/BLOC-3-dependent pathway mediates host defense against different pathogens in human macrophages. Sci Adv 7, eabb1795 (2021). - PMC - PubMed

Publication types

MeSH terms

Substances