

High temperature influences DNA methylation and transcriptional profiles in sea urchins (Strongylocentrotus intermedius)
- PMID: 37641027
- PMCID: PMC10464075
- DOI: 10.1186/s12864-023-09616-7
High temperature influences DNA methylation and transcriptional profiles in sea urchins (Strongylocentrotus intermedius)
Abstract
Background: DNA methylation plays an important role in life processes by affecting gene expression, but it is still unclear how DNA methylation is controlled and how it regulates gene transcription under high temperature stress conditions in Strongylocentrotus intermedius. The potential link between DNA methylation variation and gene expression changes in response to heat stress in S. intermedius was investigated by MethylRAD-seq and RNA-seq analysis. We screened DNA methylation driver genes in order to comprehensively elucidate the regulatory mechanism of its high temperature adaptation at the DNA/RNA level.
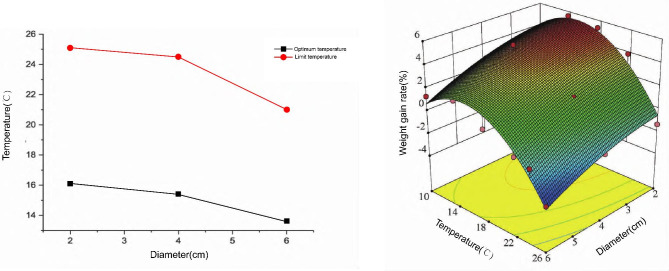
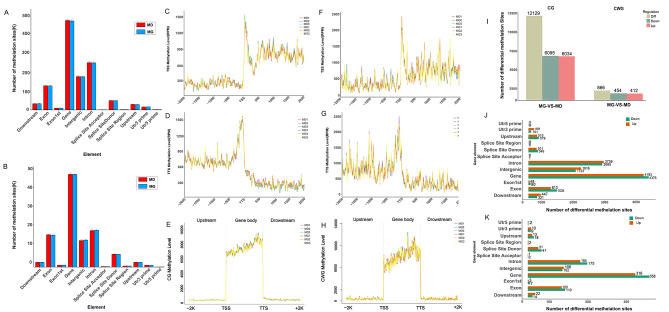
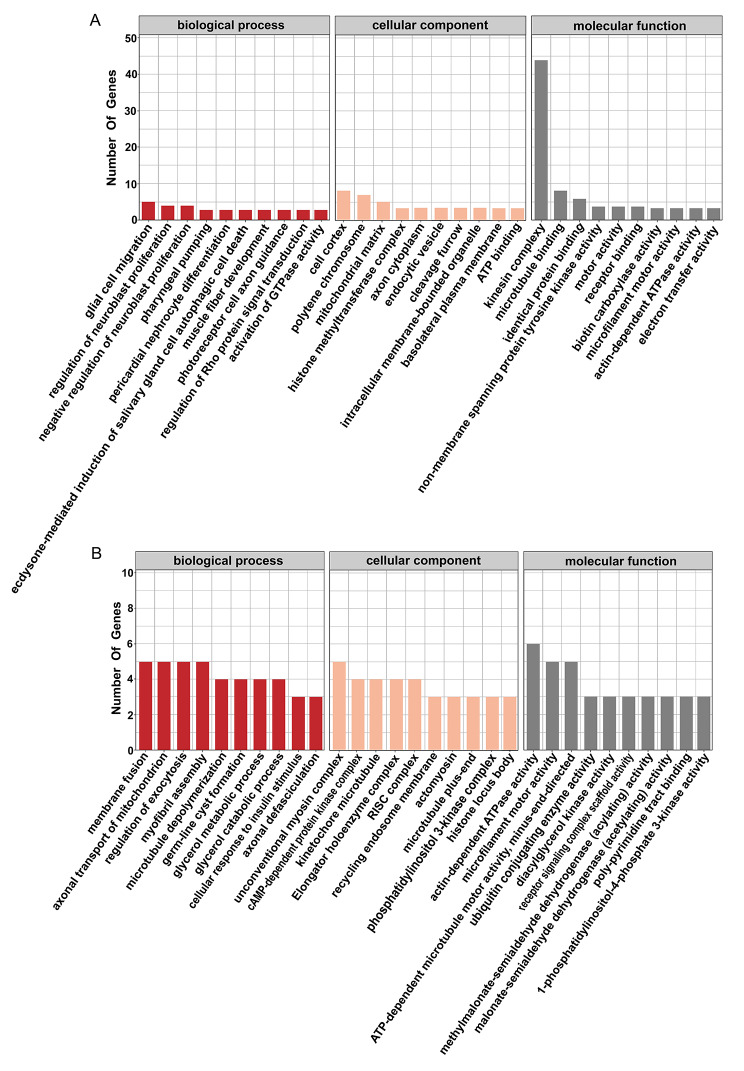
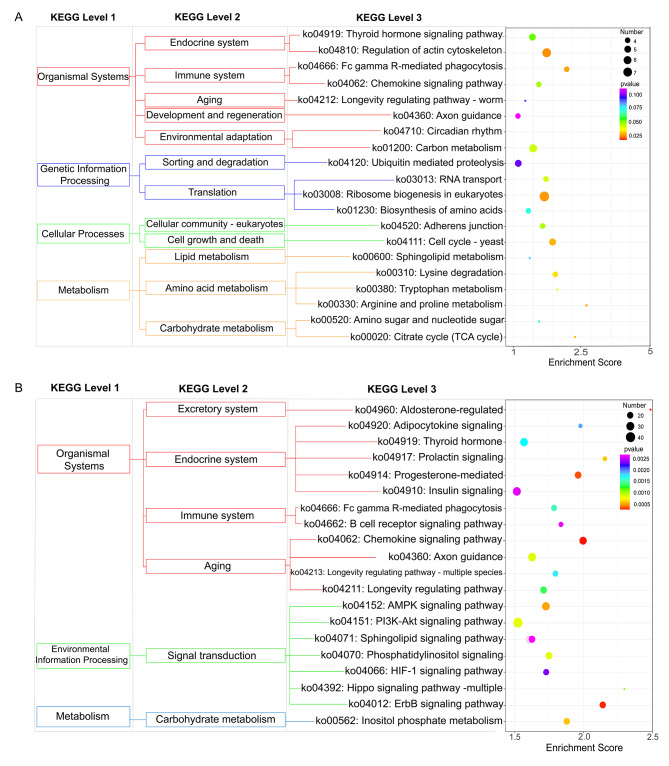
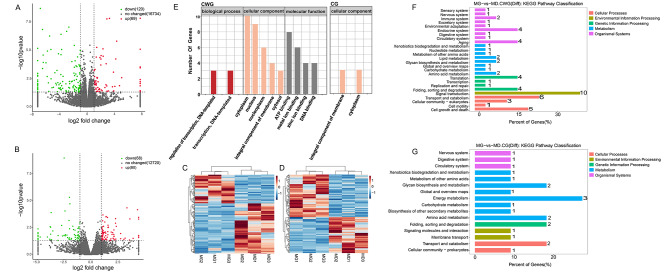
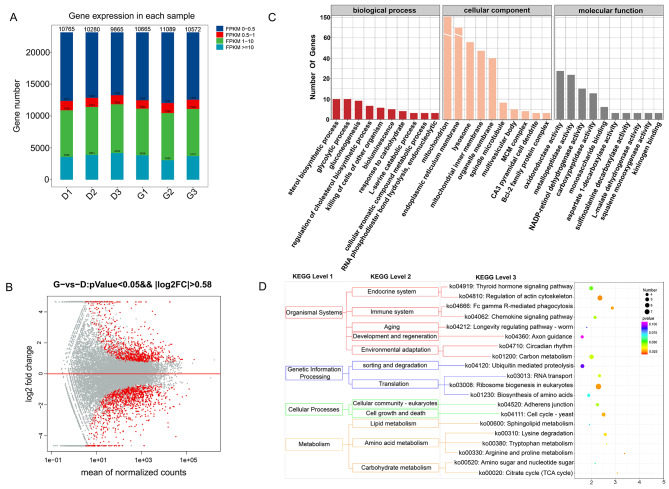
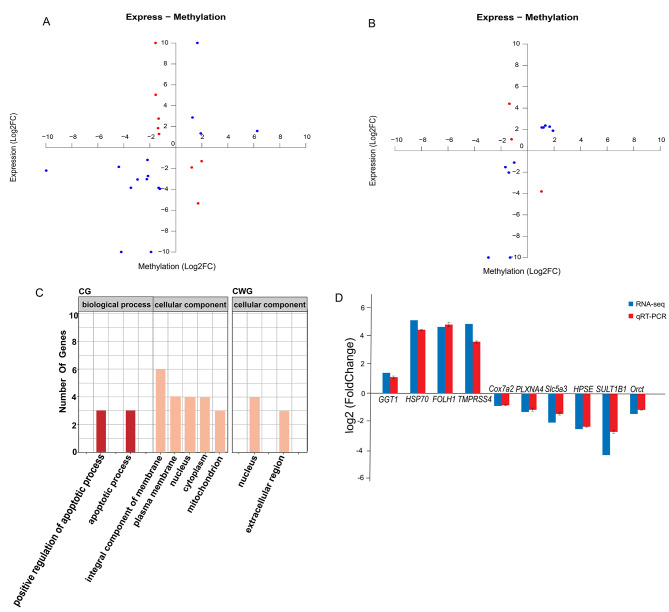
Results: The results revealed that high temperature stress significantly affected not only the DNA methylation and transcriptome levels of S. intermedius (P < 0.05), but also growth. MethylRAD-seq analysis revealed 12,129 CG differential methylation sites and 966 CWG differential methylation sites, and identified a total of 189 differentially CG methylated genes and 148 differentially CWG methylated genes. Based on KEGG enrichment analysis, differentially expressed genes (DEGs) are mostly enriched in energy and cell division, immune, and neurological damage pathways. Further RNA-seq analysis identified a total of 1968 DEGs, of which 813 genes were upregulated and 1155 genes were downregulated. Based on the joint MethylRAD-seq and RNA-seq analysis, metabolic processes such as glycosaminoglycan degradation, oxidative phosphorylation, apoptosis, glutathione metabolism, thermogenesis, and lysosomes are regulated by DNA methylation.
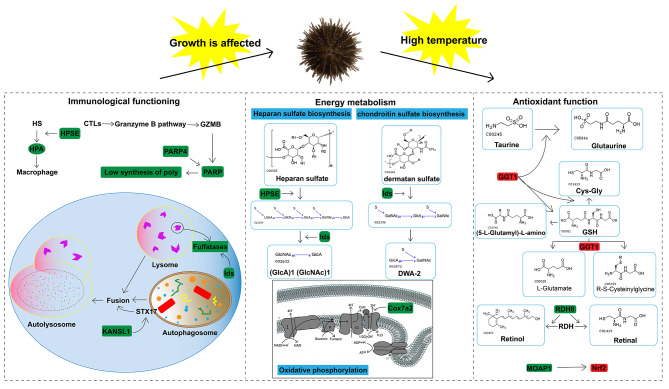
Conclusions: High temperature affected the DNA methylation and expression levels of genes such as MOAP-1, GGT1 and RDH8, which in turn affects the metabolism of HPSE, Cox, glutathione, and retinol, thereby suppressing the immune, energy metabolism, and antioxidant functions of the organism and finally manifesting as stunted growth. In summary, the observations in the present study improve our understanding of the molecular mechanism of the response to high temperature stress in sea urchin.
Keywords: Epigenetic; High temperature; Methylation; Sea urchin (Strongylocentrotus intermedius); Transcriptome.
© 2023. BioMed Central Ltd., part of Springer Nature.
Conflict of interest statement
The authors declare no competing interests.
Figures
Similar articles
-
Gene expression patterns of sea urchins (Strongylocentrotus intermedius) exposed to different combinations of temperature and hypoxia.Comp Biochem Physiol Part D Genomics Proteomics. 2022 Mar;41:100953. doi: 10.1016/j.cbd.2021.100953. Epub 2021 Dec 16. Comp Biochem Physiol Part D Genomics Proteomics. 2022. PMID: 34942521
-
The Impact of Chronic Heat Stress on the Growth, Survival, Feeding, and Differential Gene Expression in the Sea Urchin Strongylocentrotus intermedius.Front Genet. 2019 Apr 4;10:301. doi: 10.3389/fgene.2019.00301. eCollection 2019. Front Genet. 2019. PMID: 31019527 Free PMC article.
-
Transcriptome analysis to characterize the genes related to gonad growth and fatty acid metabolism in the sea urchin Strongylocentrotus intermedius.Genes Genomics. 2019 Dec;41(12):1397-1415. doi: 10.1007/s13258-019-00864-0. Epub 2019 Sep 4. Genes Genomics. 2019. PMID: 31485990
-
Transcriptome sequencing reveals phagocytosis as the main immune response in the pathogen-challenged sea urchin Strongylocentrotus intermedius.Fish Shellfish Immunol. 2019 Nov;94:780-791. doi: 10.1016/j.fsi.2019.10.002. Epub 2019 Oct 1. Fish Shellfish Immunol. 2019. PMID: 31585247
-
Epigenomics in stress tolerance of plants under the climate change.Mol Biol Rep. 2023 Jul;50(7):6201-6216. doi: 10.1007/s11033-023-08539-6. Epub 2023 Jun 9. Mol Biol Rep. 2023. PMID: 37294468 Review.
Cited by
-
Molecular regulation of whole genome DNA methylation in heat stress response of dairy cows.BMC Genomics. 2025 May 9;26(1):464. doi: 10.1186/s12864-025-11683-x. BMC Genomics. 2025. PMID: 40346455 Free PMC article.
-
Comprehensive multi-omics analysis uncovers potential risks of aged sperm on offspring development after short-term storage.BMC Biol. 2025 Aug 22;23(1):264. doi: 10.1186/s12915-025-02379-5. BMC Biol. 2025. PMID: 40846931 Free PMC article.
-
Integrated m6A RNA methylation and transcriptomic analysis of Apostichopus japonicus under combined high-temperature and hypoxia stress.BMC Genomics. 2025 Apr 10;26(1):363. doi: 10.1186/s12864-025-11532-x. BMC Genomics. 2025. PMID: 40211154 Free PMC article.
References
-
- Gienapp P, Teplitsky C, Alho JS, Mills JA, Merilä J. Climate change and evolution: disentangling environmental and genetic responses. Mol Ecol. 2008;17:167–78. - PubMed
-
- Poloczanska ES, Brown CJ, Sydeman WJ, Kiessling W, Schoeman DS, Moore PJ, et al. Global imprint of climate change on marine life. Nat Clim Change. 2013;3(10):919–25.
-
- Yao CL, Somero GN. The impact of ocean warming on marine organisms. Chin Sci Bull. 2014;59:468–79.
-
- Root TL, Price JT, Hall KR, Schneider SH, Rosenzweig C, Pounds JA. Fingerprints of global warming on wild animals and plants. Nature. 2003;421:57–60. - PubMed
MeSH terms
Substances
Grants and funding
LinkOut - more resources
Full Text Sources
Miscellaneous
