

Development and external validation of the DOAT and DOATS scores: simple decision support tools to identify disease progression among nonelderly patients with mild/moderate COVID-19
- PMID: 37641057
- PMCID: PMC10463653
- DOI: 10.1186/s12890-023-02604-3
Development and external validation of the DOAT and DOATS scores: simple decision support tools to identify disease progression among nonelderly patients with mild/moderate COVID-19
Abstract
Background: During the fifth wave of the coronavirus disease 2019 (COVID-19) pandemic in Japan, which took place between June and September 2021, a significant number of COVID-19 cases with deterioration occurred in unvaccinated individuals < 65 years old. However, the risk factors for COVID-19 deterioration in this specific population have not yet been determined. This study developed a prediction method to identify COVID-19 patients < 65 years old who are at a high risk of deterioration.
Methods: This retrospective study analyzed data from 1,675 patients < 65 years old who were admitted to acute care institutions in Fukushima with mild-to-moderate-1 COVID-19 based on the Japanese disease severity criteria prior to the fifth wave. For validation, 324 similar patients were enrolled from 3 hospitals in Yamagata. Logistic regression analyses using cluster-robust variance estimation were used to determine predictors of disease deterioration, followed by creation of risk prediction scores. Disease deterioration was defined as the initiation of medication for COVID-19, oxygen inhalation, or mechanical ventilation starting one day or later after admission.
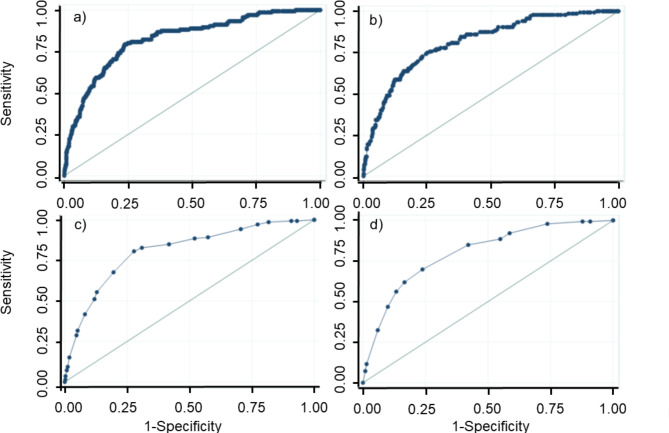
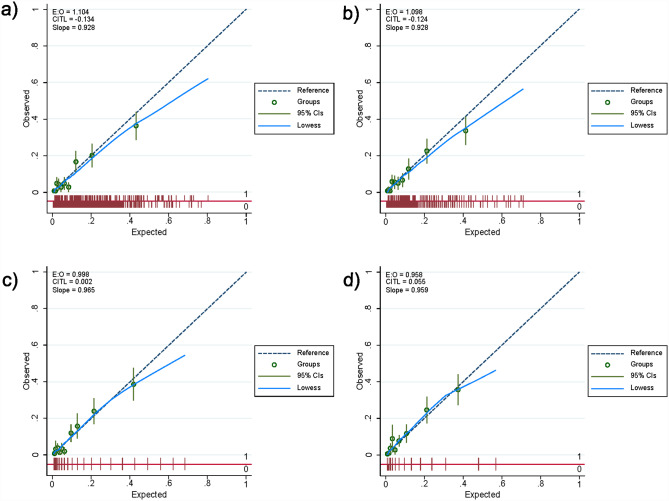
Results: The patients whose condition deteriorated (8.6%) tended to be older, male, have histories of smoking, and have high body temperatures, low oxygen saturation values, and comorbidities, such as diabetes/obesity and hypertension. Stepwise variable selection using logistic regression to predict COVID-19 deterioration retained comorbidities of diabetes/obesity (DO), age (A), body temperature (T), and oxygen saturation (S). Two predictive scores were created based on the optimism-corrected regression coefficients: the DOATS score, including all of the above risk factors, and the DOAT score, which was the DOATS score without oxygen saturation. In the original cohort, the areas under the receiver operating characteristic curve (AUROCs) of the DOATS and DOAT scores were 0.81 (95% confidence interval [CI] 0.77-0.85) and 0.80 (95% CI 0.76-0.84), respectively. In the validation cohort, the AUROCs for each score were both 0.76 (95% CI 0.69-0.83), and the calibration slopes were both 0.80. A decision curve analysis confirmed the clinical practicability of both scores in the validation cohort.
Conclusions: We established two prediction scores that can quickly evaluate the risk of COVID-19 deterioration in mild/moderate patients < 65 years old.
Keywords: COVID-19; Disease deterioration; Nonelderly; Risk factor.
© 2023. BioMed Central Ltd., part of Springer Nature.
Conflict of interest statement
The authors declare that no competing interest exists.
Figures


Similar articles
-
Simple prediction tools for disease progression in unvaccinated patients with mild/moderate COVID-19 aged under 65 years: Simplified DOATS and DOAT scores.Respir Investig. 2024 Jul;62(4):681-684. doi: 10.1016/j.resinv.2024.05.006. Epub 2024 May 22. Respir Investig. 2024. PMID: 38781788
-
Testing the efficacy and safety of BIO101, for the prevention of respiratory deterioration, in patients with COVID-19 pneumonia (COVA study): a structured summary of a study protocol for a randomised controlled trial.Trials. 2021 Jan 11;22(1):42. doi: 10.1186/s13063-020-04998-5. Trials. 2021. PMID: 33430924 Free PMC article.
-
A novel deterioration prediction system for mild COVID-19 patients in Korea: a retrospective study.Sci Rep. 2024 Aug 30;14(1):20171. doi: 10.1038/s41598-024-71033-x. Sci Rep. 2024. PMID: 39215109 Free PMC article.
-
Early identification of patients admitted to hospital for covid-19 at risk of clinical deterioration: model development and multisite external validation study.BMJ. 2022 Feb 17;376:e068576. doi: 10.1136/bmj-2021-068576. BMJ. 2022. PMID: 35177406 Free PMC article.
-
Recurrent neural network models (CovRNN) for predicting outcomes of patients with COVID-19 on admission to hospital: model development and validation using electronic health record data.Lancet Digit Health. 2022 Jun;4(6):e415-e425. doi: 10.1016/S2589-7500(22)00049-8. Epub 2022 Apr 21. Lancet Digit Health. 2022. PMID: 35466079 Free PMC article.
Cited by
-
Real-world clinical outcomes of treatment with casirivimab-imdevimab among patients with mild-to-moderate coronavirus disease 2019 during the Delta variant pandemic.Int J Med Sci. 2022 May 9;19(5):834-841. doi: 10.7150/ijms.71132. eCollection 2022. Int J Med Sci. 2022. PMID: 35693744 Free PMC article.
-
Real-world clinical outcomes of treatment with molnupiravir for patients with mild-to-moderate coronavirus disease 2019 during the Omicron variant pandemic.Clin Exp Med. 2023 Oct;23(6):2715-2723. doi: 10.1007/s10238-022-00949-3. Epub 2022 Dec 5. Clin Exp Med. 2023. PMID: 36469171 Free PMC article.
-
Clinical effect of early administration of tocilizumab following the initiation of corticosteroid therapy for patients with COVID-19.J Infect Chemother. 2022 Dec;28(12):1639-1644. doi: 10.1016/j.jiac.2022.08.021. Epub 2022 Aug 31. J Infect Chemother. 2022. PMID: 36057415 Free PMC article.
References
-
- Wourld Health Organization.: Therapeutics and COVID-19: living guideline. [https://www.who.int/publications/i/item/WHO-2019-nCoV-therapeutics-2022.4]. - PubMed
-
- Docherty AB, Harrison EM, Green CA, Hardwick HE, Pius R, Norman L, Holden KA, Read JM, Dondelinger F, Carson G, et al. Features of 20 133 UK patients in hospital with covid-19 using the ISARIC WHO Clinical Characterisation Protocol: prospective observational cohort study. BMJ. 2020;369:m1985. doi: 10.1136/bmj.m1985. - DOI - PMC - PubMed
-
- Kragholm K, Andersen MP, Gerds TA, Butt JH, Ostergaard L, Polcwiartek C, Phelps M, Andersson C, Gislason GH, Torp-Pedersen C, et al. Association between male sex and outcomes of Coronavirus Disease 2019 (Covid-19) - a danish nationwide, register-based study. Clin Infect Dis. 2020;73(11):e4025–30. doi: 10.1093/cid/ciaa924. - DOI - PMC - PubMed
MeSH terms
Grants and funding
LinkOut - more resources
Full Text Sources
Medical
