. 2023 Aug 29;17(1):80.
doi: 10.1186/s40246-023-00521-4.

An AI-powered patient triage platform for future viral outbreaks using COVID-19 as a disease model

Collaborators, Affiliations

An AI-powered patient triage platform for future viral outbreaks using COVID-19 as a disease model

Georgia Charkoftaki et al. Hum Genomics. .

Abstract

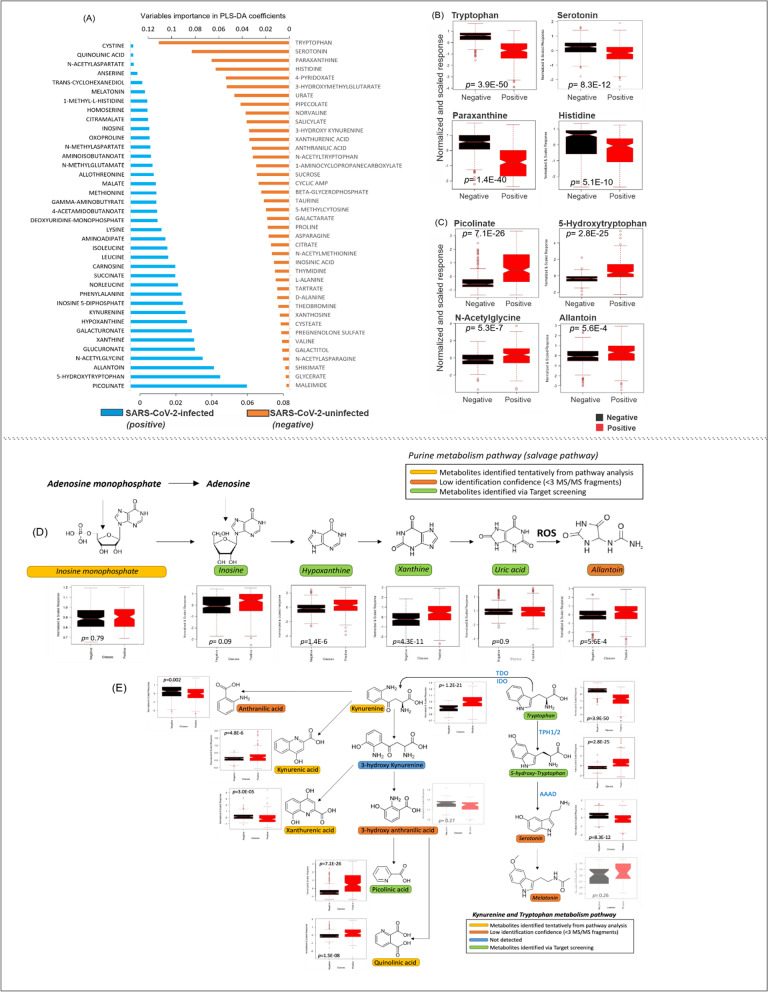
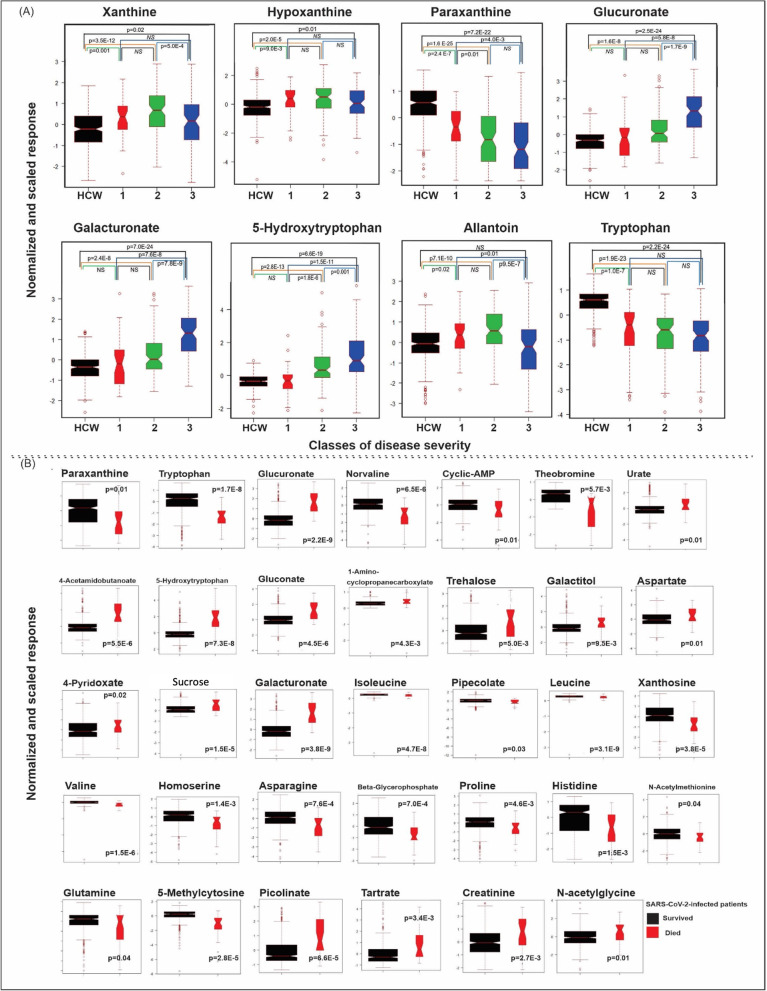
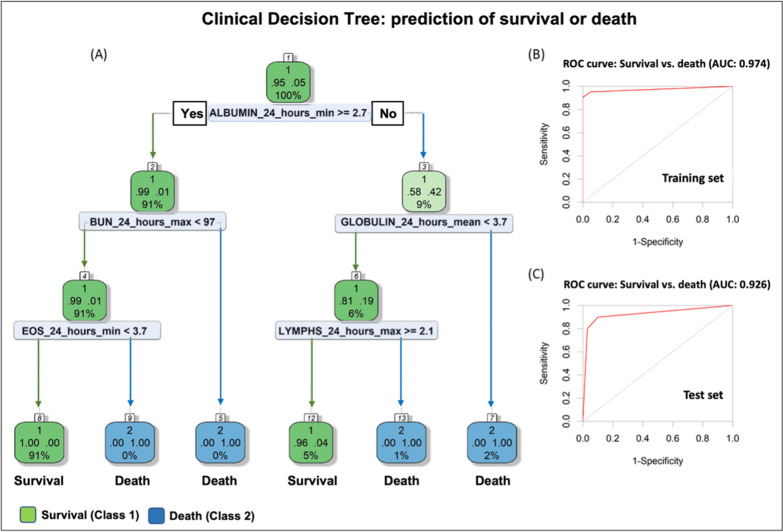
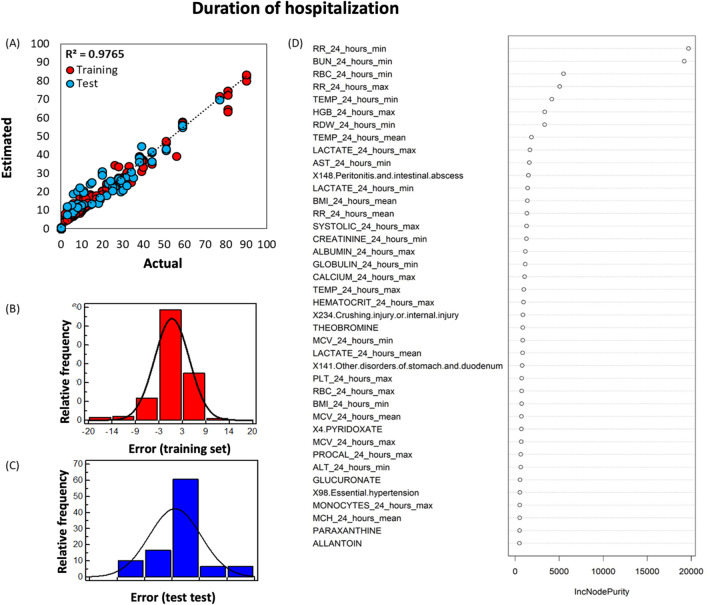
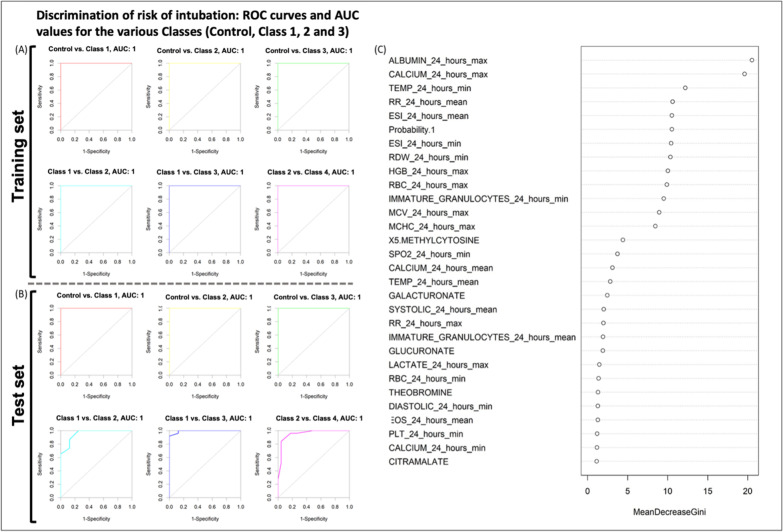
Over the last century, outbreaks and pandemics have occurred with disturbing regularity, necessitating advance preparation and large-scale, coordinated response. Here, we developed a machine learning predictive model of disease severity and length of hospitalization for COVID-19, which can be utilized as a platform for future unknown viral outbreaks. We combined untargeted metabolomics on plasma data obtained from COVID-19 patients (n = 111) during hospitalization and healthy controls (n = 342), clinical and comorbidity data (n = 508) to build this patient triage platform, which consists of three parts: (i) the clinical decision tree, which amongst other biomarkers showed that patients with increased eosinophils have worse disease prognosis and can serve as a new potential biomarker with high accuracy (AUC = 0.974), (ii) the estimation of patient hospitalization length with ± 5 days error (R2 = 0.9765) and (iii) the prediction of the disease severity and the need of patient transfer to the intensive care unit. We report a significant decrease in serotonin levels in patients who needed positive airway pressure oxygen and/or were intubated. Furthermore, 5-hydroxy tryptophan, allantoin, and glucuronic acid metabolites were increased in COVID-19 patients and collectively they can serve as biomarkers to predict disease progression. The ability to quickly identify which patients will develop life-threatening illness would allow the efficient allocation of medical resources and implementation of the most effective medical interventions. We would advocate that the same approach could be utilized in future viral outbreaks to help hospitals triage patients more effectively and improve patient outcomes while optimizing healthcare resources.


Conflict of interest statement

VV, KV NST are members of the editorial board of Human Genomics.

Figures

Fig. 1
Fig. 1
Plasma metabolome differences in SARS-CoV-2-infected and uninfected subjects. Order of importance of individual metabolites (in PLS-DA model) in SARS-CoV-2-uninfected (healthy control, orange bar) and SARS-CoV-2-infected (blue bar) subjects. A The four metabolites most significantly down-regulated in infected patients (relative to uninfected subjects). B The four most significant metabolites up-regulated in infected patients (red symbol) relative to uninfected subjects (black symbols). C Metabolic pathways identified by untargeted metabolomics in the plasma of SARS-CoV-2-uninfected subjects (black symbols) and SARS-CoV-2-infected patients (red symbols). D Purine metabolism: adenosine monophosphate can be converted to inosine either by (i) deamination to form inosine monophosphate followed by dephosphorylation or (ii) dephosphorylation to form adenosine followed by deamination. Hypoxanthine, formed from inosine, can undergo oxidative hydroxylation to xanthine which can then be converted by xanthine oxidase to uric acid. Allantoin is formed from the reaction between uric acid and reactive oxygen species (ROS). E Tryptophan metabolism: In the kynurenine pathway (which accounts for ~ 95% of tryptophan degradation), tryptophan forms kynurenine (by tryptophan-2,3-dioxygenase (TDO) or indoleamine 2,3-dioxygenase (IDO)). Kynurenine can then undergo hydroxylation to 3-hydroxy kynurenine (by kynurenine 3-monooxygenase (KMO)). A minor degradation pathway involves tryptophan hydroxylation to 5-hydroxy-tryptophan (by tryptophan hydroxylase isoforms 1 and 2 (TPH1/2)) and then to serotonin and melatonin (by aromatic-L-amino-acid decarboxylase (AAAD)). In figures B–E, data are presented as the mean ± SD and each dot represents individual sample results. Dots outside the box plot are in the upper quartile (75th percentile) of the distribution and the dots inside the box plot are in the interquartile range (IQR), where 50% of the data are located. Outside the box plot are the patients that are outside the IQR range. The box plot is divided at the median. Probability values reflect results in SARS-CoV-2-infected patients being compared with uninfected subjects using a Student’s unpaired t-test
Fig. 2
Fig. 2
Untargeted plasma metabolomics analyses of SARS-CoV-2-infected and uninfected subjects. A Results of univariate analysis of the metabolites are shown for SARS-CoV-2-negative subjects (HCW black square), SARS-CoV-2-positive patients who during their hospitalization did not require any external oxygen supply or required only a low flow of oxygen (Class 1, red square), SARS-CoV-2-positive patients who required a high flow of oxygen (Class 2, green square), and SARS-CoV-2-positive patients who needed positive airway pressure (biphasic; BIPAP or continuous; CPAP) or were intubated (Class 3, blue square). B Univariate analysis of the identified metabolites in the plasma showing differences in the metabolome between SARS-Cov-2 infected patients who survived (black square) and those who did not survive (red square). Data are presented as the mean ± SD; dots outside the box plot are in the upper quartile (75th percentile) of the distribution and the dots inside the box plot are in the interquartile range (IQR), where 50% of the data are located. Outside the box plot are the patients that are outside the IQR range, and the box plot is divided at the median. Student’s unpaired t-test, NS (non-significant)  (color figure online)
Fig. 3
Fig. 3
Clinical decision tree (DT). A clinical DT model predicting the discharge disposition of a patient (survival or death) was developed. A The tree shows the rules applied to classify each patient into the related classes (survival or death). At the top of the DT, the overall proportion of the patients survived (95%) or died (5%) is shown. Next, the node applies the threshold over clinical data to achieve classification of patients into the two classes. For instance, it applies the threshold of 2.7 g/dL over Albumin_24_hours_min (minimum value obtained from the clinical data), the node evaluates whether if patients show Albumin_24_hours_min above 2.7. If yes, then the next decision rule in DT is at down to the root’s left child node (Yes; depth 2). Ninety-one percent of patients will survive with a survival probability of ninety-nine percent. This way, inspecting the whole DT, the impact of features on the likelihood of survival can be derived. The percentage of patients at each node is provided below the probability values of survival (denoted as 1) or death (denoted as 2) on the DT; the green (survived) /blue (died) shows the fitted/estimated values for the patients in each class at given node. ROC curves for B training set and C test set. AUC provides an aggregate measure of performance across all possible classification thresholds
Fig. 4
Fig. 4
Random Forest (RF) machine learning algorithm to estimate the length of hospitalization of each SARS-CoV-2-infected patient admitted to the hospital. A Correlation plot between the RF estimated and the actual duration of hospitalization of SARS-CoV-2-infected patients; distribution of error (residuals) for training (B, red square) and test (C, blue square) sets. D The forty most significant factors in the structure of the RF model developed to predict the duration of hospitalization of SARS-CoV-2-infected patients (color figure online)
Fig. 5
Fig. 5
A pairwise comparison of classes by ROC curves in training (A) and test (B) sets; The ROC curves were derived pair-wise for the four risk classes, i.e., SARS-CoV-2-negative subjects (Control) SARS-CoV-2-positive patients who during their hospitalization did not require any external oxygen supply or required only a low flow of oxygen (Class 1), SARS-CoV-2-positive patients who required a high flow of oxygen (Class 2), and SARS-CoV-2-positive patients who needed positive airway pressure (biphasic; BIPAP or continuous; CPAP) or were intubated (Class 3). C The most significant factors in the structure of the Random Forest model developed to predict the risk of intubation due to SARS-CoV-2 infection. Note: Probability 1 (which is included in the most significant factors in the RF) is the output of the metabolomics results of the PLS-DA model showing the probability of healthy (Control) individuals

Similar articles

Cited by

References

    1. Yang X, et al. Clinical course and outcomes of critically ill patients with SARS-CoV-2 pneumonia in Wuhan, China: a single-centered, retrospective, observational study. Lancet Respir Med. 2020;8:475–481. doi: 10.1016/s2213-2600(20)30079-5. - DOI - PMC - PubMed
    1. Richards F, et al. Economic burden of COVID-19: a systematic review. Clinicoecon Outcomes Res. 2022;14:293–307. doi: 10.2147/ceor.S338225. - DOI - PMC - PubMed
    1. Wang T, et al. Comorbidities and multi-organ injuries in the treatment of COVID-19. Lancet 395:e52. 10.1016/s0140-6736(20)30558-4 (2020). - PMC - PubMed
    1. Rello J, Storti E, Belliato M, Serrano R. Clinical phenotypes of SARS-CoV-2: implications for clinicians and researchers. Eur Respir J. 2001028, 10.1183/13993003.01028-2020 (2020). - PMC - PubMed
    1. Synowiec A, Szczepański A, Barreto-Duran E, Lie LK, Pyrc K. Severe acute respiratory syndrome coronavirus 2 (SARS-CoV-2): a systemic infection. Clin Microbiol Rev. 34. 10.1128/cmr.00133-20 (2021). - PMC - PubMed

Publication types