. 2023 Dec;10(6):3311-3329.
doi: 10.1002/ehf2.14475. Epub 2023 Aug 29.

Vagus nerve stimulation-induced stromal cell-derived factor-l alpha participates in angiogenesis and repair of infarcted hearts

Affiliations

Vagus nerve stimulation-induced stromal cell-derived factor-l alpha participates in angiogenesis and repair of infarcted hearts

Yan Wang et al. ESC Heart Fail. 2023 Dec.

Abstract

Aims: We aim to explore the role and mechanism of vagus nerve stimulation (VNS) in coronary endothelial cells and angiogenesis in infarcted hearts.

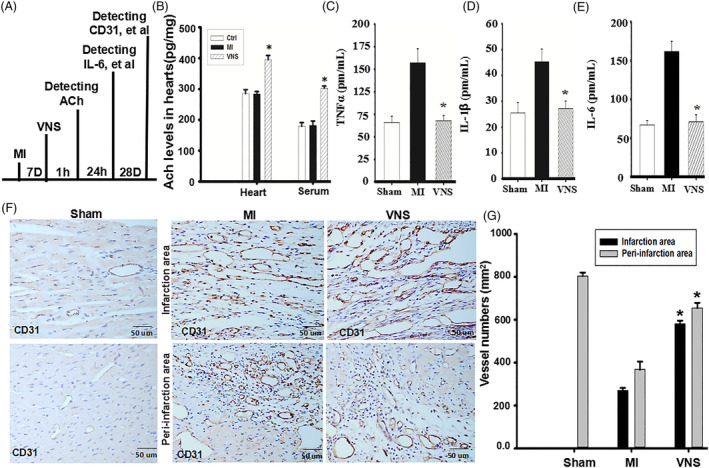
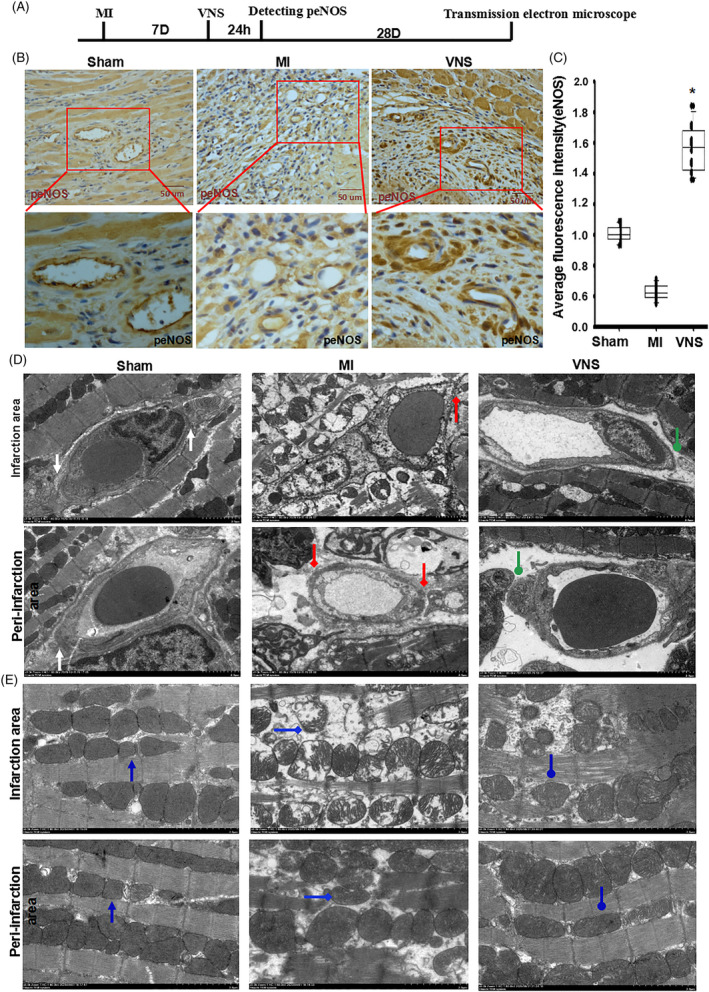
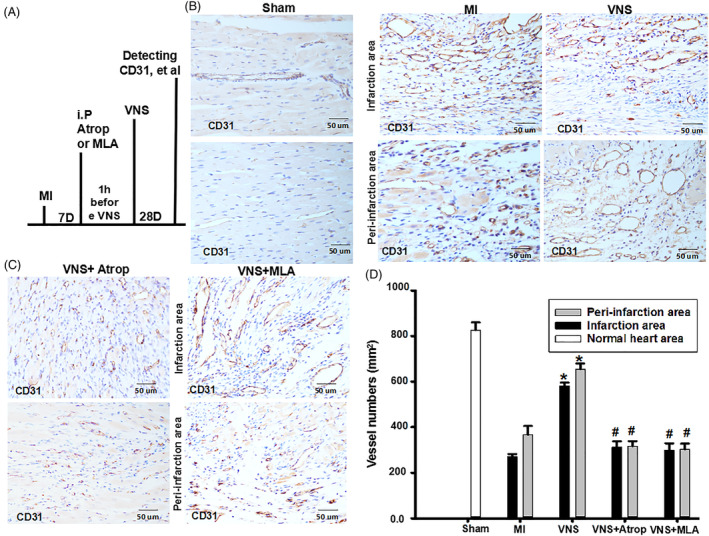
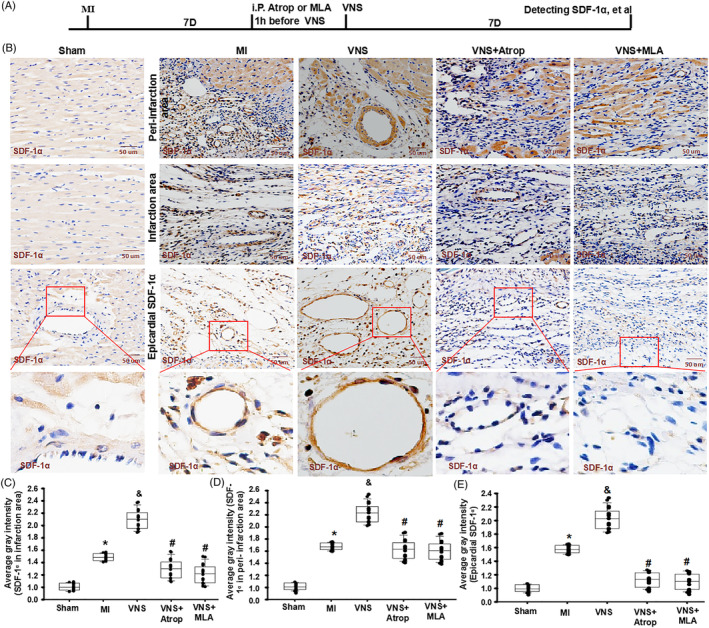
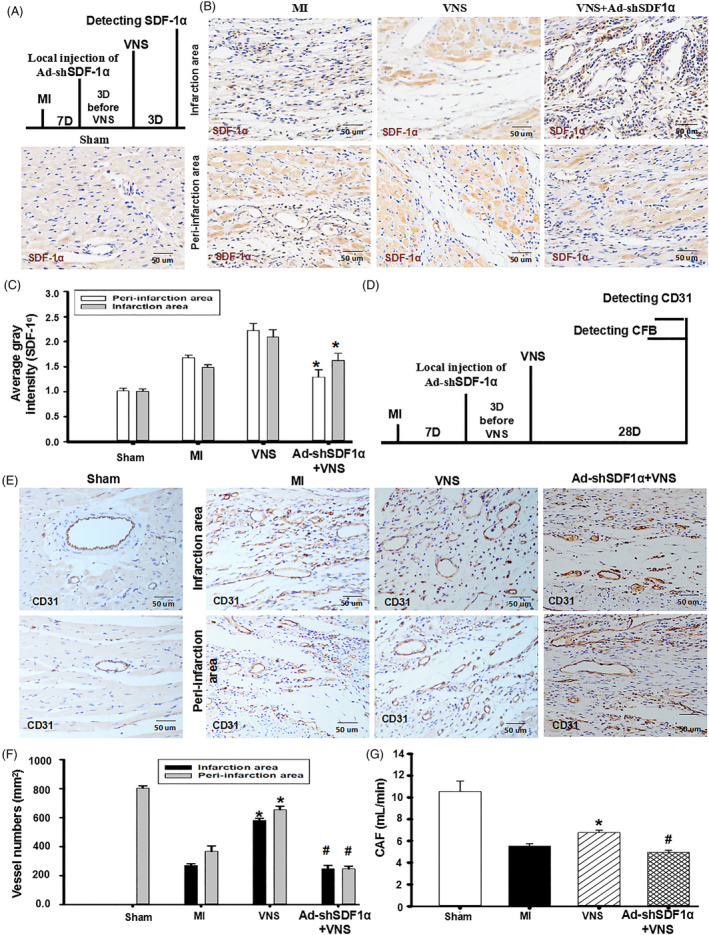
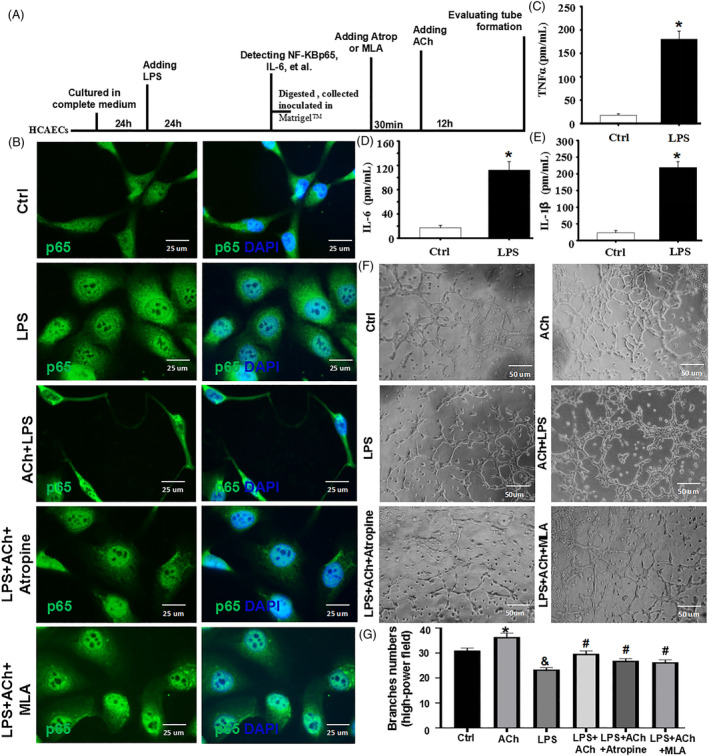
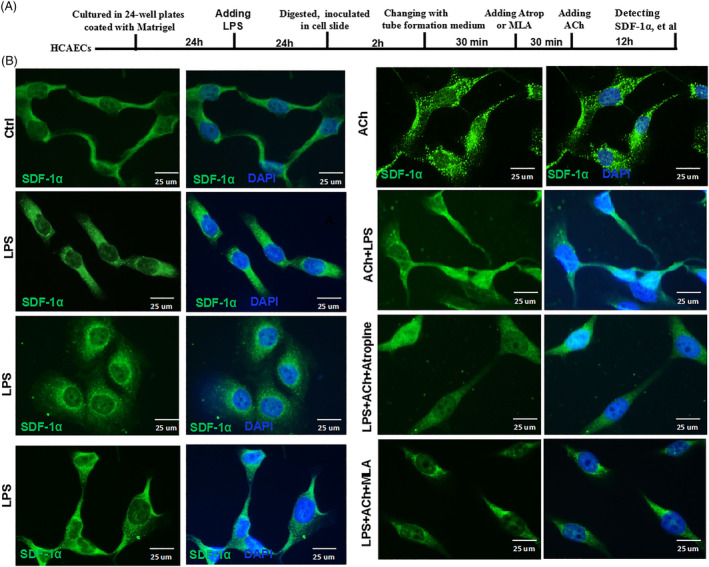
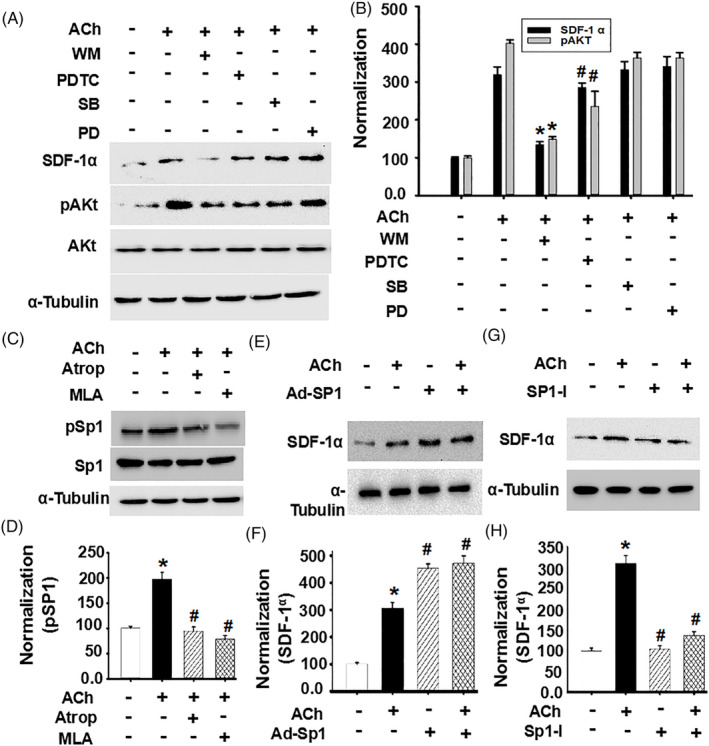
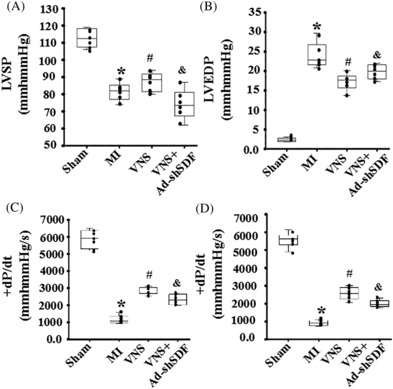
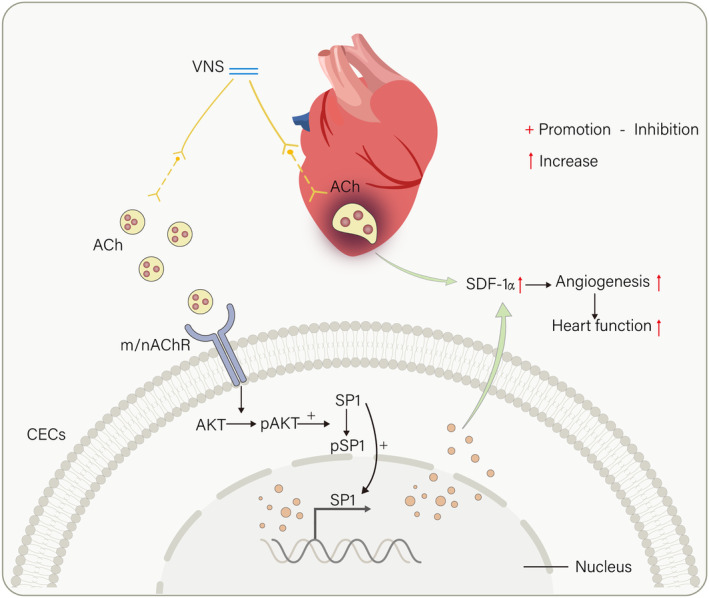
Methods and results: Seven days after rat myocardial infarction (MI) was prepared by ligation of the left anterior descending coronary artery, the left cervical vagus nerve was treated with electrical stimulation 1 h after intraperitoneal administration of the α7-nicotinic acetylcholine inhibitor mecamylamine or the mAChR inhibitor atropine or 3 days after local injection of Ad-shSDF-1α into the infarcted heart. Cardiac tissue acetylcholine (ACh) and serum ACh, tumour necrosis factor α (TNF-α), interleukin 1β (IL-1β) and interleukin 6 (IL-6) levels were detected by ELISA to determine whether VNS was successful. An inflammatory injury model in human coronary artery endothelial cells (HCAECs) was established by lipopolysaccharide and identified by evaluating TNF-α, IL-1β and IL-6 levels and tube formation. Immunohistochemistry staining was performed to evaluate CD31-positive vessel density and stromal cell-derived factor-l alpha (SDF-1α) expression in the MI heart in vivo and the expression and distribution of SDF-1α, C-X-C motif chemokine receptor 4 and CXCR7 in HCAECs in vitro. Western blotting was used to detect the levels of SDF-1α, V-akt murine thymoma viral oncogene homolog (AKT), phosphorylated AKT (pAKT), specificity protein 1 (Sp1) and phosphorylation of Sp1 in HCAECs. Left ventricular performance, including left ventricular systolic pressure, left ventricular end-diastolic pressure and rate of the rise and fall of ventricular pressure, should be evaluated 28 days after VNS treatment. VNS was successfully established for MI therapy with decreases in serum TNF-α, IL-1β and IL-6 levels and increases in cardiac tissue and serum ACh levels, leading to increased SDF-1α expression in coronary endothelial cells of MI hearts, triggering angiogenesis of MI hearts with increased CD31-positive vessel density, which was abolished by the m/nAChR inhibitors mecamylamine and atropine or knockdown of SDF-1α by shRNA. ACh promoted SDF-1α expression and its distribution along with the branch of the formed tube in HCAECs, resulting in an increase in the number of tubes formed in HCAECs. ACh increased the levels of pAKT and phosphorylation of Sp1 in HCAECs, resulting in inducing SDF-1α expression, and the specific effects could be abolished by mecamylamine, atropine, the PI3K/AKT blocker wortmannin or the Sp1 blocker mithramycin. Functionally, VNS improved left ventricular performance, which could be abolished by Ad-shSDF-1α.

Conclusions: VNS promoted angiogenesis to repair the infarcted heart by inducing SDF-1α expression and redistribution along new branches during angiogenesis, which was associated with the m/nAChR-AKT-Sp1 signalling pathway.

Keywords: Angiogenesis; Myocardial infarction; SDF-1α; Sp1; Vagal nerve stimulation.


Conflict of interest statement

The authors declare that they have no competing interests.

Figures

Figure 1
Figure 1
VNS was successful for MI therapy. (A) Schematic diagram of the experimental scheme for the successful treatment of VNS in MI. (B) Cardiac tissues and serum ACh were determined by ELISA 1 h after VMS. N = 6, *P < 0.01 versus MI. (C–E) Serum TNFα, IL‐6 and IL‐1β were determined by ELISA 24 h after VMS. n = 6, *P < 0.01 versus MI. (F, G) Representative images of immunohistochemical staining for CD31 and semiquantitative analysis of the infarction area and peri‐infarct area of the infarcted hearts 28 days after VNS. Yellowish brown colour: CD31; n = 6, *P < 0.01 versus MI.
Figure 2
Figure 2
VNS improved EC function and angiogenesis in the infarcted heart. (A) Schematic diagram of the experimental scheme for the evaluation of ECs in the infarcted heart. (B, C). EC structure and function in the infracted heart were assessed by immunostaining (B) of peNOS. Yellowish brown colour: peNOS; haematoxylin‐stained nucleus. (C) Semiquantitative analysis of peNOS levels in ECs. n = 6, *P < 0.05 versus MI. (D, E) Typical transmission electron microscopy image of an infracted heart. Scale bar: 2 μm. (D) The white arrow indicates the complete cell membrane and normal intercellular space in ECs of sham‐operated hearts; the red diamond arrow indicates the incomplete cell membrane and increased intercellular space in MI hearts; and the green round arrow indicates the recovery of the cell membrane and intercellular space in MI hearts 28 days after VNS treatment. (E) The blue arrow indicates the mitochondrion in cardiomyocytes adjacent to ECs of sham‐operated hearts; the blue diamond arrow indicates the damaged mitochondrion in cardiomyocytes adjacent to ECs of the infarcted heart; and the blue round arrow indicates the recovery of the damaged mitochondrion in cardiomyocytes adjacent to ECs of the infarcted heart 28 days after VNS treatment.
Figure 3
Figure 3
VNS promotes angiogenesis in infracted hearts through m/n‐AChR signalling. (A) Schematic diagram of the experimental scheme for the evaluation of angiogenesis in the infarcted heart. (B, C) Typical immunostaining image of CD31 in the infarction area and peri‐infarction area of the infarcted heart treated with mecamylamine (MLA, 10 mg/kg, ip), atropine (Atrop, 10 mg/kg, ip) or SDF‐1α knockdown by shRNA (Ad‐shSDF) before VNS. Brownish yellow indicates CD31; haematoxylin‐stained nuclei. (D) Quantitative analysis of CD31‐positive vessel density as indicated. n = 6, *P < 0.05 versus MI; # P < 0.05 versus VNS.
Figure 4
Figure 4
VNS promotes SDF‐1α expression in infracted hearts through m/n‐AChR. (A) Schematic diagram of the experimental scheme for the evaluation of SDF‐1α expression in the infarcted heart. (B, C) Immunostaining shows SDF‐1α expression in the infarction area, peri‐infarction area and epicardial area of the infarcted heart. Brownish yellow indicates SDF‐1α; haematoxylin‐stained nucleus. (C–E) Semiquantitative analysis of the grey value for SDF‐1α expression as indicated. n = 6, *P < 0.05 versus sham; & P < 0.05 versus MI; # P < 0.05 versus VNS.
Figure 5
Figure 5
SDF‐1α is involved in VNS‐induced angiogenesis in the infarcted heart. (A) Schematic diagram of the experimental scheme for evaluation of SDF1 knockdown efficiency after local injection of Ad‐shSDF1α into the infarcted heart. (B) Immunostaining shows SDF‐1α expression in the infarction area and peri‐infarction area of the infarcted heart. Brownish yellow indicates SDF‐1α; haematoxylin‐stained nucleus. (C) Semiquantitative analysis of the grey value for SDF‐1α expression as indicated. n = 6, *P < 0.05 versus VNS. (D) Schematic diagram of the experimental scheme for the evaluation of angiogenesis and coronary artery flow (CAF) in the infarcted heart treated with Ad‐shSDF1α. (E, F) Quantitative analysis of CD31‐positive vessel density as indicated. n = 6, *P < 0.05 versus MI; # P < 0.05 versus VNS. (G) VNS increased CAF in the infarcted heart following VNS, and the specific role could be abolished by application of Ad‐shSDF1α. n = 6, *P < 0.05 versus MI; # P < 0.05 versus VNS.
Figure 6
Figure 6
ACh promoted HCAEC tube formation while inhibiting the inflammatory response in vitro through m/n‐AChR. (A) Schematic diagram of the experimental scheme for the evaluation of ACh (10−5 Mol/L)‐induced HCAEC tube formation in the LPS (1 mg/μL)‐mediated inflammatory injury model. (B) Typical images of NF‐κBp65 nuclear translocation in HCAECs. (C–E) Supernatant TNFα, IL‐6 and IL‐1β of HCAECs were determined by ELISA 24 h after VMS. n = 6, *P < 0.05 versus Ctrl. (F) Typical images of the tube formation of HCAECs treated with or without LPS (1 mg/μL) before stimulation with ACh (105 mol/L) and its blockers, including atropine (Atrop, 1 μM) or mecamylamine (MLA, 7 μM), by using a Matrigel‐mediated tube formation system. (G) Quantitative analysis of vascular ring formation in Figure 5 A as indicated. Three independent experiments were carried out. *P < 0.05 versus 0 ACh (Ctrl); & P < 0.05 versus 105 mol/L ACh; @ P < 0.05 versus LPS or ACh; # P < 0.05 versus LPS + ACh.
Figure 7
Figure 7
ACh recovers SDF‐1α distribution along new branches during formation of the vascular ring. (A) Schematic diagram of the experimental scheme for the evaluation of ACh‐induced SDF‐1α distribution along new branches during HCAEC tube formation in the LPS (1 mg/μL)‐mediated inflammatory injury model. (B) Typical image of the formation of vascular rings in HCAECs treated with or without LPS (1 mg/μL) before stimulation with ACh (10−5 mol/L) and its blockers, including atropine (Atrop, 1 μM) or mecamylamine (MLA, 7 μM), by using a Matrigel‐mediated tube formation system. Three independent experiments were carried out.
Figure 8
Figure 8
ACh induced CXCR4 distribution along a parallel direction with SDF‐1α through m/n‐AChR. (A) Schematic diagram of the experimental scheme for the evaluation of ACh‐induced SDF‐1α/CXCR4 distribution along new branches during HCAEC tube formation in an LPS (1 mg/μL)‐mediated inflammatory injury model. (B) Typical image of double immunostaining for SDF‐1α and CXCR4 in HCAECs in a Matrigel‐mediated tube formation system following treatment with ACh (10−5 mol/L). Green colour: SDF‐1α; red colour: CXCR4; blue colour: DAPI‐labelled nuclei. Three independent experiments were carried out.
Figure 9
Figure 9
ACh promoted SDF‐1α expression in human coronary endothelial cells through the AKT‐Sp1 signalling pathway. (A) ACh dose‐dependently induced SDF‐1α expression in human coronary endothelial cells as detected by Western blot. (B) Signalling pathways mediating ACh‐induced SDF‐1α expression were assessed by pathway‐specific inhibitors as indicated. Western blotting was used to detect ACh‐induced VEGF expression in HCAECs following treatment with wortmannin (WM, 50 nM), PDTC (10 μM), SB203580 (SB, 30 μM), or PD98059 (PD, 50 μM). α‐Tubulin served as an internal control. (C, D) The increased phosphorylation of Sp1 (pSp1) following ACh stimulation in HCAECs was abolished by the mACh‐R inhibitor atropine (Atrop) or the nACh‐R inhibitor mecamylamine, as determined by Western blotting (C). (D) Quantitative analysis of pSp1 in panel (C) as indicated. Three independent experiments were carried out. *P < 0.05 versus 0 mol/L ACh (Ctrl); # P < 0.05 versus 10−5 mol/L ACh. (E–H) Overexpression of Sp1 (E‐F) enhanced SDF‐1α expression in HCAECs, while the Sp1‐specific inhibitor mithramycin A (Sp1‐I, 1 μM) almost completely abolished the effect of ACh on SDF‐1α expression in HCAECs (G, H). At least three independent experiments were carried out. Three independent experiments were carried out. *P < 0.05 versus 0 mol/L ACh (Ctrl); # P < 0.05 versus 10−5 mol/L ACh.
Figure 10
Figure 10
VNS improved cardiac function. (A–D) Seven days after MI, the MI rats were randomly divided into three groups. The VNS group included MI rats treated with VNS (VNS group). The VNS + Ad‐shSDF group indicated that the MI rats received the local injection of Ad‐shSDF‐1α into infarcted hearts 3 days before active VNS. The rats in both the MI and sham groups received a similar local injection of equivalent normal saline 3 days before sham VNS. After 28 days of treatment, heart function was detected as described in the methods, and left ventricular systolic pressure (LVSP, A), left ventricular end‐diastolic pressure (LVEDP, B), rate of rise of ventricular pressure (+dP/dt max, C), and rate of fall of ventricular pressure (–dP/dtmax, D) in the VNS group were obviously improved, which could be abolished by Ad‐shSDF‐1α. n = 6, *P < 0.05 versus sham; # P < 0.05 versus MI; & P < 0.05 versus VNS.
Figure 11
Figure 11
Working model. VNS induced SDF‐1α expression and redistribution in coronary endothelial cells. VNS‐ and acetylcholine (ACh)‐induced SDF‐1α expression regulated angiogenesis in the MI heart. ACh recovered SDF‐1α/CXCR4 distribution along new branches during the formation of vessels. ACh induced SDF‐1α expression through the ACh/m/nAChR/AKT/Sp1 signalling cascade. ACh, acetylcholine; CXCR4, C‐X‐C motif chemokine receptor 4; mACHR, muscarinic acetylcholine receptor; MI, myocardium infarction; nACHR, nicotinic acetylcholine receptor; Sp1, specifieity protein 1; SDF‐1α, stromal cell derived factor 1 alpha; VNS, vagus nerve stimulation.

Similar articles

Cited by

References

    1. Li P, Liu H, Sun P, Wang X, Wang C, Wang L, Wang T. Chronic vagus nerve stimulation attenuates vascular endothelial impairments and reduces the inflammatory profile via inhibition of the NF‐κB signaling pathway in ovariectomized rats. Exp Gerontol. 2016; 74: 43–55. - PubMed
    1. Li M, Zheng C, Sato T, Kawada T, Sugimachi M, Sunagawa K. Vagal nerve stimulation markedly improves long‐term survival after chronic heart failure in rats. Circulation. 2004; 109: 120–124. - PubMed
    1. Martelli D, Yao ST, McKinley MJ, McAllen RM. Reflex control of inflammation by sympathetic nerves, not the vagus. J Physiol. 2014; 592: 1677–1686. - PMC - PubMed
    1. Shen MJ, Shinohara T, Park HW, Frick K, Ice DS, Choi EK, Han S, Maruyama M, Sharma R, Shen C, Fishbein MC, Chen LS, Lopshire JC, Zipes DP, Lin SF, Chen PS. Continuous low level vagus nerve stimulation reduces stellate ganglion nerve activity and paroxysmal atrial tachyarrhythmias in ambulatory canines. Circulation. 2011; 123: 2204–2280. - PMC - PubMed
    1. Niccoli G, Scalone G, Lerman A, Crea F. Coronary microvascular obstruction in acute myocardial infarction. Eur Heart J. 2016; 37: 1024–1040. - PubMed