

Hypoxic-preconditioned mesenchymal stem cell-derived small extracellular vesicles promote the recovery of spinal cord injury by affecting the phenotype of astrocytes through the miR-21/JAK2/STAT3 pathway
- PMID: 37641874
- PMCID: PMC10915983
- DOI: 10.1111/cns.14428
Hypoxic-preconditioned mesenchymal stem cell-derived small extracellular vesicles promote the recovery of spinal cord injury by affecting the phenotype of astrocytes through the miR-21/JAK2/STAT3 pathway
Abstract
Background: Secondary injury after spinal cord injury (SCI) is a major obstacle to their neurological recovery. Among them, changes in astrocyte phenotype regulate secondary injury dominated by neuroinflammation. Hypoxia-preconditioned mesenchymal stem cells (MSCs)-derived extracellular vesicle (H-EV) plays a multifaceted role in secondary injury by interacting with cellular components and signaling pathways. They possess anti-inflammatory properties, regulate oxidative stress, and modulate apoptotic pathways, promoting cell survival and reducing neuronal loss. Given the unique aspects of secondary injury, H-EV shows promise as a therapeutic approach to mitigate its devastating consequences. Our study aimed to determine whether H-EV could promote SCI repair by altering the phenotype of astrocytes.
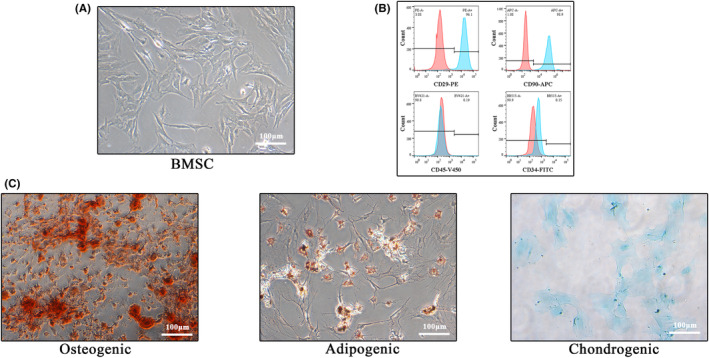
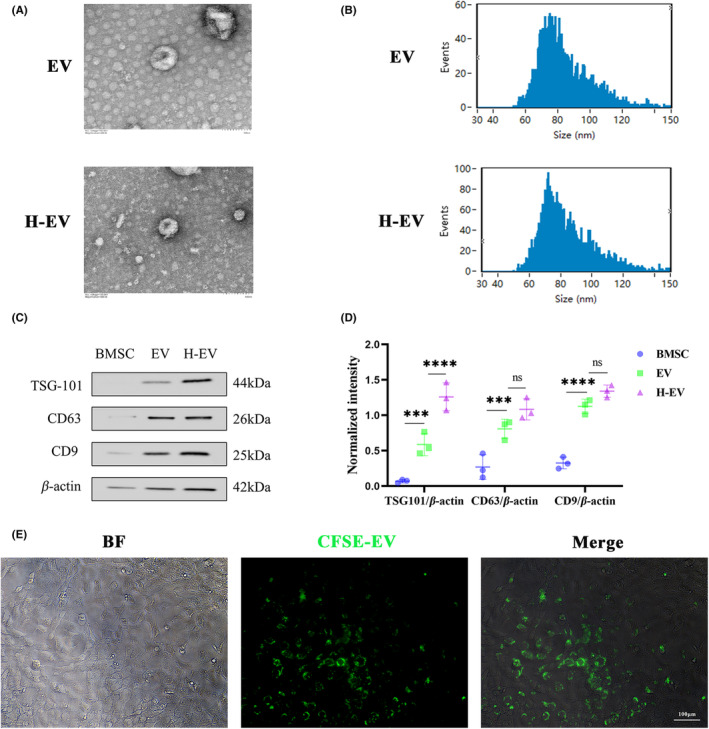
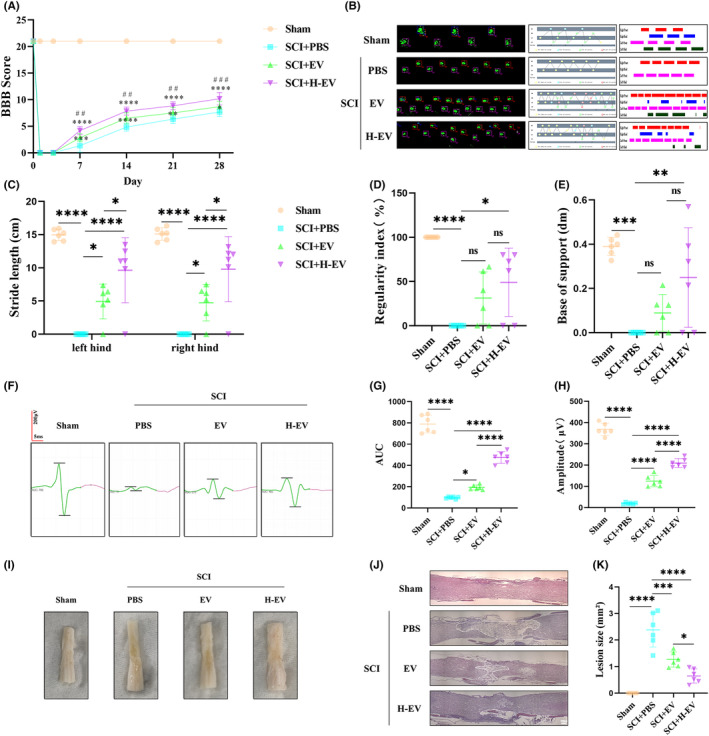
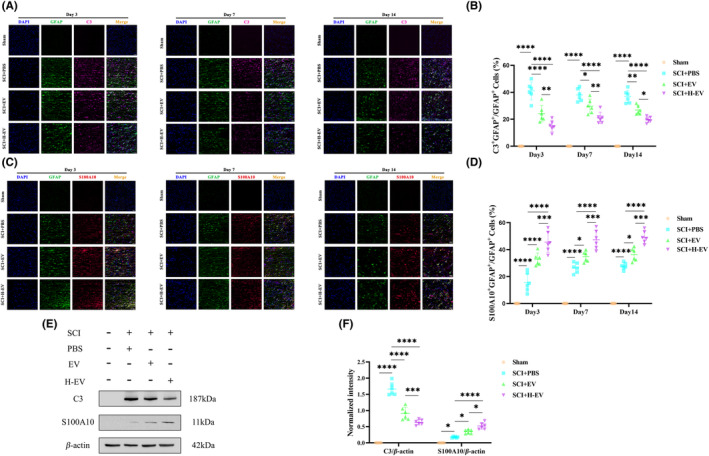
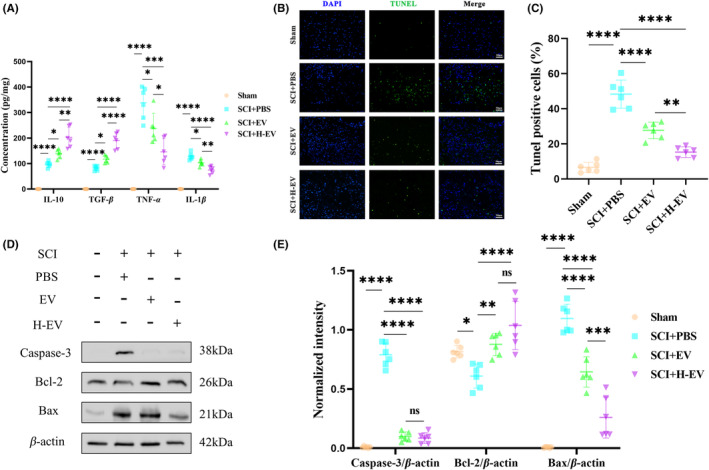
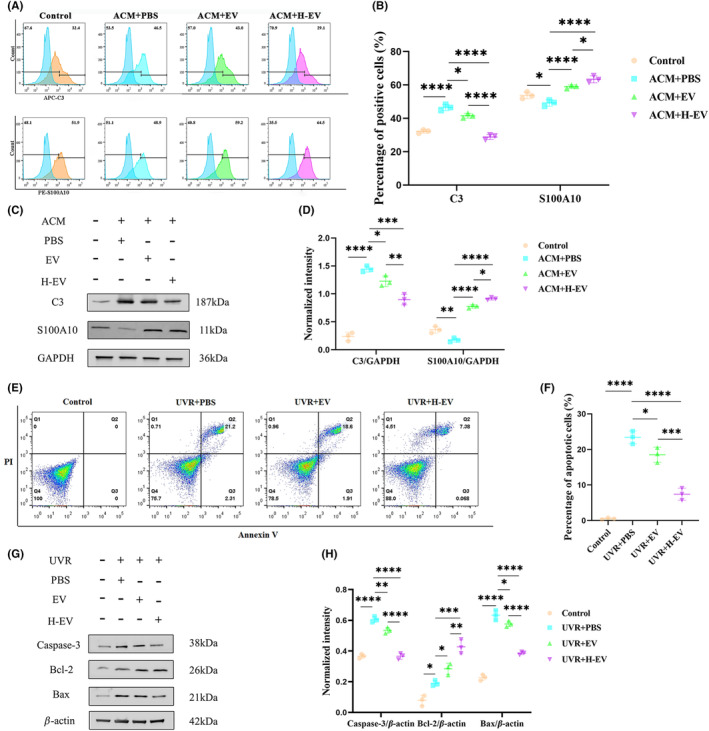
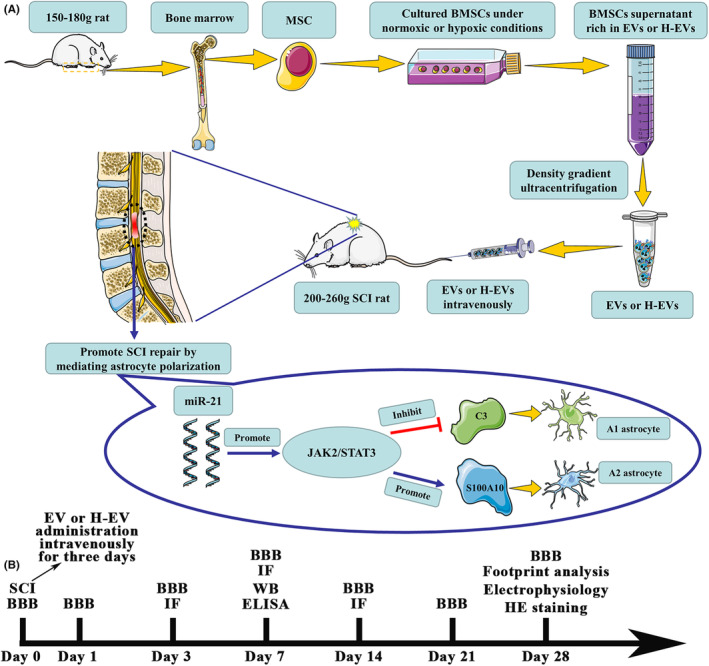
Methods: Rat bone marrow MSCs (BMSCs) and EVs secreted by them were extracted and characterized. After the SCI model was successfully constructed, EV and H-EV were administered into the tail vein of the rats, respectively, and then their motor function was evaluated by the Basso-Beattie-Bresnahan (BBB) score, Catwalk footprint analysis, and electrophysiological monitoring. The lesion size of the spinal cord was evaluated by hematoxylin-eosin (HE) staining. The key point was to use glial fibrillary acidic protein (GFAP) as a marker of reactive astrocytes to co-localize with A1-type marker complement C3 and A2-type marker S100A10, respectively, to observe phenotypic changes in astrocytes within tissues. The western blot (WB) of the spinal cord was also used to verify the results. We also compared the efficacy differences in apoptosis and inflammatory responses using terminal deoxynucleotidyl transferase dUTP terminal labeling (TUNEL) assay, WB, and enzyme-linked immunosorbent assay (ELISA). Experiments in vitro were also performed to verify the results. Subsequently, we performed microRNA (miRNA) sequencing analysis of EV and H-EV and carried out a series of knockdown and overexpression experiments to further validate the mechanism by which miRNA in H-EV plays a role in promoting astrocyte phenotypic changes, as well as the regulated signaling pathways, using WB both in vivo and in vitro.
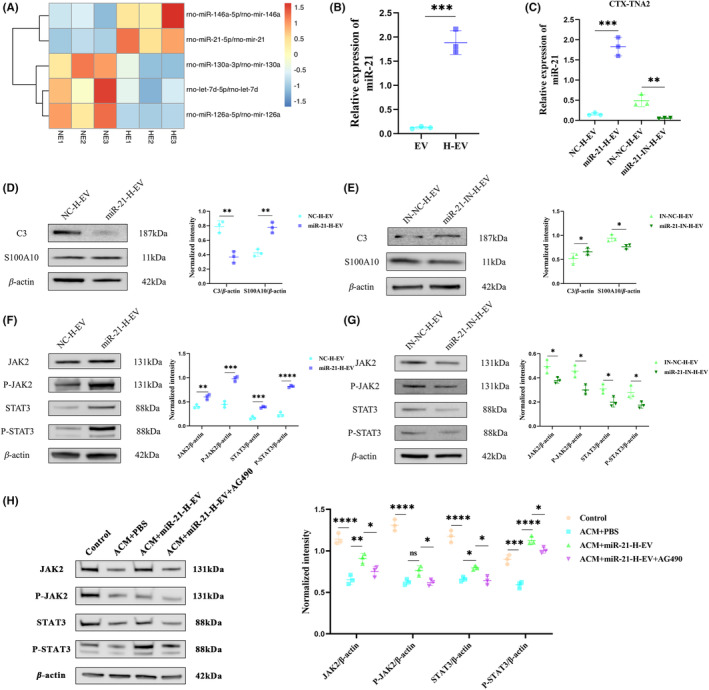
Results: Our findings suggest that H-EV is more effective than EV in the recovery of motor function, anti-apoptosis, and anti-inflammatory effects after SCI, both in vivo and in vitro. More importantly, H-EV promoted the conversion of A1 astrocytes into A2 astrocytes more than EV. Moreover, miR-21, which was found to be highly expressed in H-EV by miRNA sequencing results, was also demonstrated to influence changes in astrocyte phenotype through a series of knockdown and overexpression experiments. At the same time, we also found that H-EV might affect astrocyte phenotypic alterations by delivering miR-21 targeting the JAK2/STAT3 signaling pathway.
Conclusion: H-EV exerts neuroprotective effects by delivering miR-21 to promote astrocyte transformation from the A1 phenotype to the A2 phenotype, providing new targets and ideas for the treatment of SCI.
Keywords: astrocytes; extracellular vesicles; miR-21; neuroinflammation; spinal cord injury.
© 2023 The Authors. CNS Neuroscience & Therapeutics published by John Wiley & Sons Ltd.
Conflict of interest statement
The authors declare that they have no competing interests.
Figures
Similar articles
-
Bone Marrow Mesenchymal Stem Cells-Derived Extracellular Vesicle miR-208a-3p Alleviating Spinal Cord Injury via Regulating the Biological Function of Spinal Cord Neurons.DNA Cell Biol. 2024 Sep;43(9):463-473. doi: 10.1089/dna.2024.0064. Epub 2024 Aug 12. DNA Cell Biol. 2024. PMID: 39133103
-
Exosomal miR-17-92 Cluster from BMSCs Alleviates Apoptosis and Inflammation in Spinal Cord Injury.Biochem Genet. 2025 Aug;63(4):3363-3377. doi: 10.1007/s10528-024-10876-5. Epub 2024 Jul 3. Biochem Genet. 2025. PMID: 38961001
-
Transplantation of Wnt5a-modified Bone Marrow Mesenchymal Stem Cells Promotes Recovery After Spinal Cord Injury via the PI3K/AKT Pathway.Mol Neurobiol. 2024 Dec;61(12):10830-10844. doi: 10.1007/s12035-024-04248-8. Epub 2024 May 25. Mol Neurobiol. 2024. PMID: 38795301 Free PMC article.
-
Stem Cell-Derived Extracellular Vesicle-Mediated Therapeutic Signaling in Spinal Cord Injury.Int J Mol Sci. 2025 Jan 16;26(2):723. doi: 10.3390/ijms26020723. Int J Mol Sci. 2025. PMID: 39859437 Free PMC article. Review.
-
Mesenchymal Stem Cells and Their Extracellular Vesicles: Therapeutic Mechanisms for Blood-Spinal Cord Barrier Repair Following Spinal Cord Injury.Int J Mol Sci. 2024 Dec 16;25(24):13460. doi: 10.3390/ijms252413460. Int J Mol Sci. 2024. PMID: 39769223 Free PMC article. Review.
Cited by
-
Advances in the application of extracellular vesicles derived from three-dimensional culture of stem cells.J Nanobiotechnology. 2024 May 1;22(1):215. doi: 10.1186/s12951-024-02455-y. J Nanobiotechnology. 2024. PMID: 38693585 Free PMC article. Review.
-
Bone marrow mesenchymal stem cells-derived exosomes promote spinal cord injury repair through the miR-497-5p/TXNIP/NLRP3 axis.J Mol Histol. 2024 Nov 29;56(1):16. doi: 10.1007/s10735-024-10289-z. J Mol Histol. 2024. PMID: 39611985
-
Bone marrow mesenchymal stem cells modulate miR-202-3p to suppress neuronal apoptosis following spinal cord injury through autophagy activation via the AMPK, MAPK, and PI3K/AKT/mTOR signaling pathway.Sci Rep. 2024 Dec 3;14(1):30099. doi: 10.1038/s41598-024-81332-y. Sci Rep. 2024. PMID: 39627300 Free PMC article.
-
Repair of spinal cord injury by bone marrow mesenchymal stem cell-derived exosomes: a systematic review and meta-analysis based on rat models.Front Mol Neurosci. 2024 Aug 7;17:1448777. doi: 10.3389/fnmol.2024.1448777. eCollection 2024. Front Mol Neurosci. 2024. PMID: 39169950 Free PMC article.
-
Clarifying the role of exosomal miR-137-3p in endometrial regeneration: Mechanistic gaps and future directions.World J Stem Cells. 2025 Jun 26;17(6):109283. doi: 10.4252/wjsc.v17.i6.109283. World J Stem Cells. 2025. PMID: 40585957 Free PMC article.
References
-
- Ahuja CS, Wilson JR, Nori S, et al. Traumatic spinal cord injury. Nat Rev Dis Primers. 2017;3:17018. - PubMed
-
- McDonald JW, Sadowsky C. Spinal‐cord injury. Lancet. 2002;359(9304):417‐425. - PubMed
-
- Ryken TC, Hurlbert RJ, Hadley MN, et al. The acute cardiopulmonary management of patients with cervical spinal cord injuries. Neurosurgery. 2013;72(Suppl 2):84‐92. - PubMed
-
- Hurlbert RJ, Hadley MN, Walters BC, et al. Pharmacological therapy for acute spinal cord injury. Neurosurgery. 2013;72(Suppl 2):93‐105. - PubMed
Publication types
MeSH terms
Substances
LinkOut - more resources
Full Text Sources
Medical
Molecular Biology Databases
Miscellaneous
