

The cold-inducible RNA-binding protein-Thioredoxin 1 pathway ameliorates mitochondrial dysfunction and mitochondrial dynamin-related protein 1 level in the hippocampus of aged mice with perioperative neurocognitive dysfunction
- PMID: 37641878
- PMCID: PMC10915978
- DOI: 10.1111/cns.14433
The cold-inducible RNA-binding protein-Thioredoxin 1 pathway ameliorates mitochondrial dysfunction and mitochondrial dynamin-related protein 1 level in the hippocampus of aged mice with perioperative neurocognitive dysfunction
Abstract
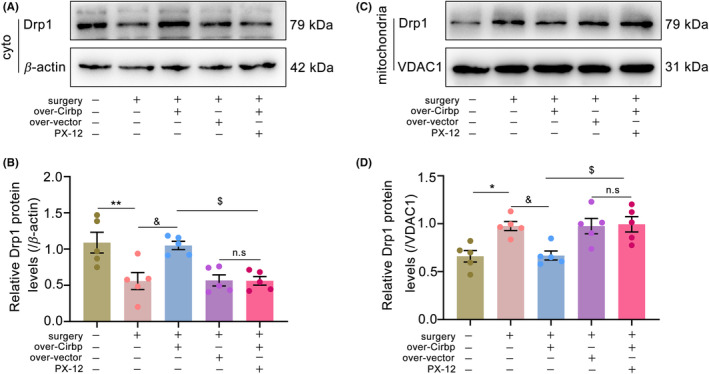
Background: As a multi-disease model, neuroinflammation, mitochondrial dysfunction, and oxidative stress might be involved in the pathogenic process of perioperative neurocognitive dysfunction (PND). Dynamin-related protein 1 (Drp1) could mediate mitochondrial fission and play important roles in mitochondrial dynamic homeostasis and mitochondria function. The Drp1 may be involved in PND development. The cold-inducible RNA-binding protein (Cirbp) could bind to the 3'-UTR of the thioredoxin 1 (Trx1) mRNA, control oxidative stress, and improve mitochondrial function. In this study, we hypothesized that the Cirbp-Trx1 pathway could ameliorate mitochondrial dysfunction and Drp1 levels in PND mice.
Methods: Differentially expressed genes were screened using the Gene Expression Omnibus (GEO) database GSE95426 and validated using PCR. Eighteen-month-old C57BL/6 mice were subjected to tibial fracture surgery to generate a PND model. Cirbp was upregulated by hippocampal stereotaxic injections of over-Cirbp plasmid according to the manufacturer's instructions for the in vivo DNA transfection reagent. Cirbp expression was measured using western blot (WB) and immunofluorescence (IF). The Morris water maze (MWM) was used to assess cognitive function. After behavioral testing, the hippocampal tissue was extracted to examine changes in mitochondrial Drp1, mitochondrial function, neuroinflammation, and oxidative stress.
Results: Differential gene screening showed that Cirbp expression was significantly downregulated (fold change >1.5, p = 0.003272) in the PND model. In this study, we also found that Cirbp protein levels were downregulated, accompanied by an impairment of cognition, a decrease in superoxide dismutase (SOD) activity, and an increase in malondialdehyde (MDA) content, mitochondrial Drp1 levels, neuroinflammation, and apoptosis. Cirbp overexpression increased Trx1 protein levels and reversed the damage. However, this protective effect was abolished by PX-12 treatment with a Trx1 inhibitor.
Conclusions: The Cirbp-Trx1 pathway may regulate mitochondrial dysfunction and mitochondrial Drp1 expression in the hippocampus of PND mice to ameliorate cognitive dysfunction.
Keywords: Cirbp; Drp1; PND; Trx1; mitochondrial dysfunction.
© 2023 The Authors. CNS Neuroscience & Therapeutics published by John Wiley & Sons Ltd.
Conflict of interest statement
The authors declare no conflicts of interest regarding the publication of this paper.
Figures


Similar articles
-
Hydrogen alleviates impaired lung epithelial barrier in acute respiratory distress syndrome via inhibiting Drp1-mediated mitochondrial fission through the Trx1 pathway.Free Radic Biol Med. 2024 Jun;218:132-148. doi: 10.1016/j.freeradbiomed.2024.03.022. Epub 2024 Mar 28. Free Radic Biol Med. 2024. PMID: 38554812
-
Cardiac-specific overexpression of thioredoxin 1 attenuates mitochondrial and myocardial dysfunction in septic mice.Int J Biochem Cell Biol. 2016 Dec;81(Pt B):323-334. doi: 10.1016/j.biocel.2016.08.045. Epub 2016 Aug 31. Int J Biochem Cell Biol. 2016. PMID: 27592449
-
Dephosphorylation by calcineurin regulates translocation of dynamin-related protein 1 to mitochondria in hepatic ischemia reperfusion induced hippocampus injury in young mice.Brain Res. 2019 May 15;1711:68-76. doi: 10.1016/j.brainres.2019.01.018. Epub 2019 Jan 16. Brain Res. 2019. PMID: 30659828
-
The potential mechanism of mitochondrial homeostasis in postoperative neurocognitive disorders: an in-depth review.Ann Med. 2024 Dec;56(1):2411012. doi: 10.1080/07853890.2024.2411012. Epub 2024 Oct 25. Ann Med. 2024. PMID: 39450938 Free PMC article. Review.
-
α5GABAA receptor: A potential therapeutic target for perioperative neurocognitive disorders, a review of preclinical studies.Brain Res Bull. 2023 Dec;205:110821. doi: 10.1016/j.brainresbull.2023.110821. Epub 2023 Nov 18. Brain Res Bull. 2023. PMID: 37984621 Review.
References
-
- Fidalgo AR. Experimental insights into age‐exacerbated cognitive dysfunction after peripheral surgery. Aging Cell. 2013;12:523‐524. - PubMed
-
- Yang Y, Liu Y, Zhu J. Neuroinflammation‐mediated mitochondrial dysregulation involved in postoperative cognitive dysfunction. Free Radic Biol Med. 2022;178:134‐146. - PubMed
-
- Netto MB, de Oliveira Junior AN, Goldim M. Oxidative stress and mitochondrial dysfunction contributes to postoperative cognitive dysfunction in elderly rats. Brain Behav Immun. 2018;73:661‐669. - PubMed
Publication types
MeSH terms
Substances
Grants and funding
LinkOut - more resources
Full Text Sources
Medical
Molecular Biology Databases
Research Materials
Miscellaneous
