. 2023 Aug;12(4):e1372.
doi: 10.1002/mbo3.1372.

Isolation, biochemical characterization, and genome sequencing of two high-quality genomes of a novel chitinolytic Jeongeupia species

Affiliations

Isolation, biochemical characterization, and genome sequencing of two high-quality genomes of a novel chitinolytic Jeongeupia species

Nathanael D Arnold et al. Microbiologyopen. 2023 Aug.

Abstract

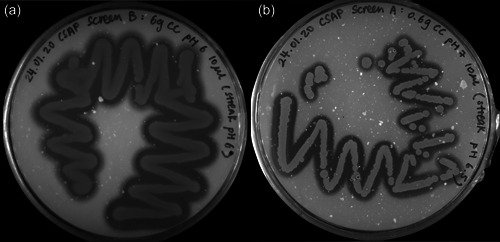
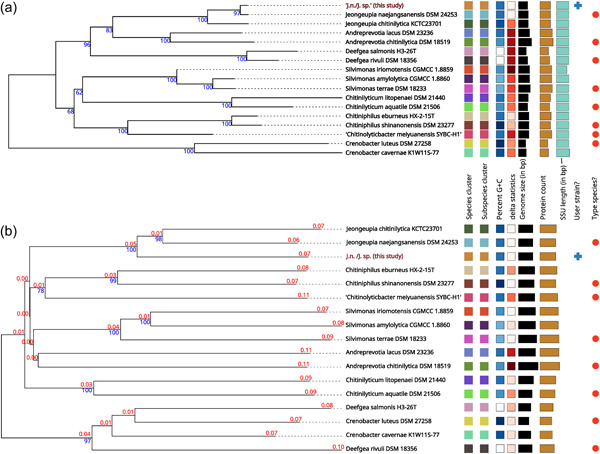
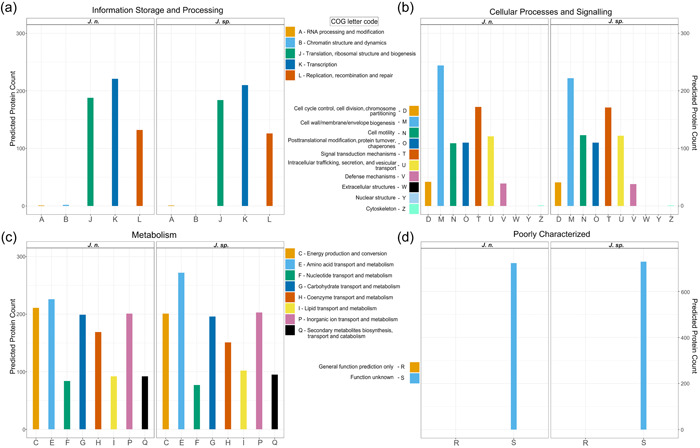
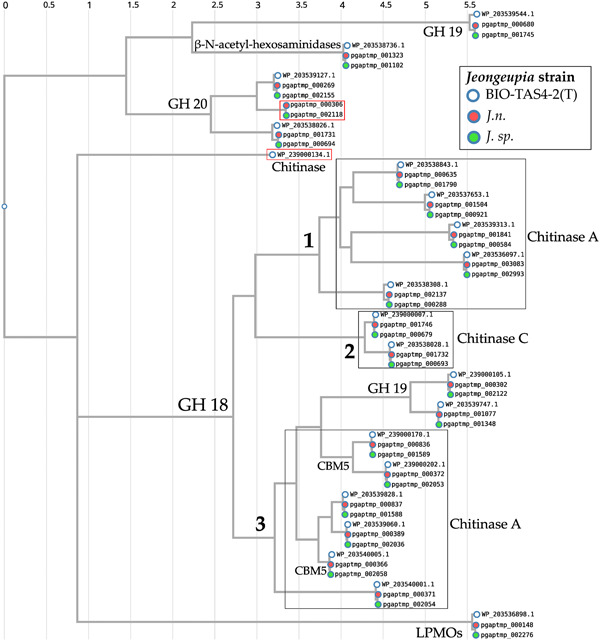
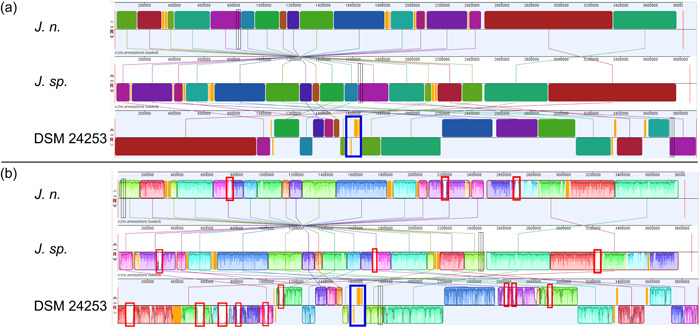
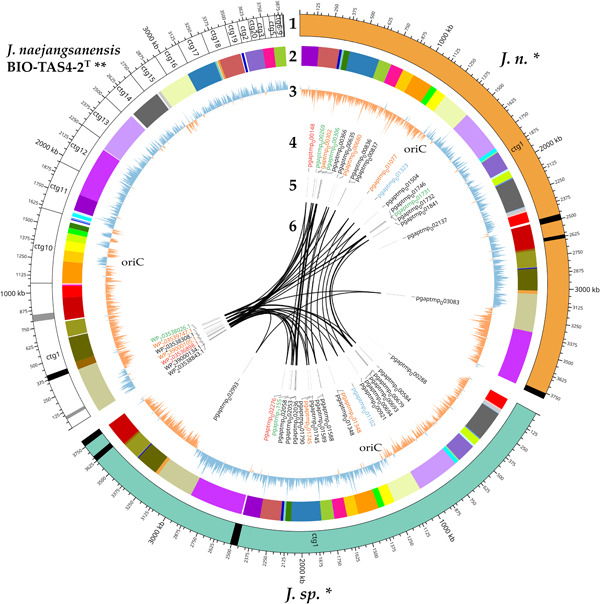
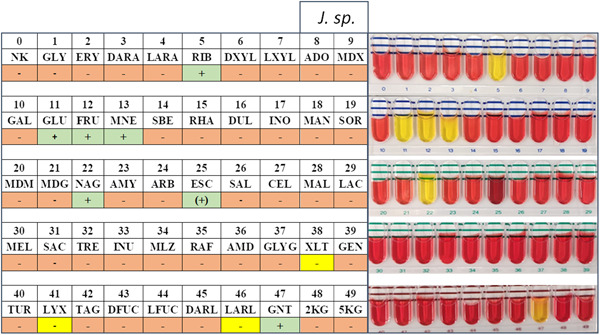
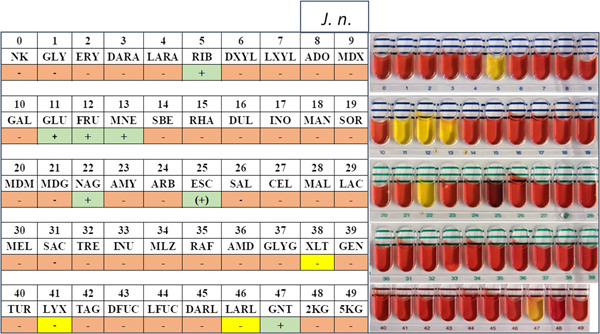
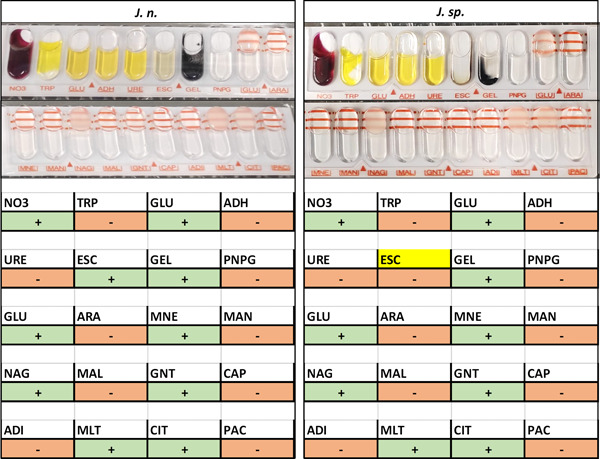
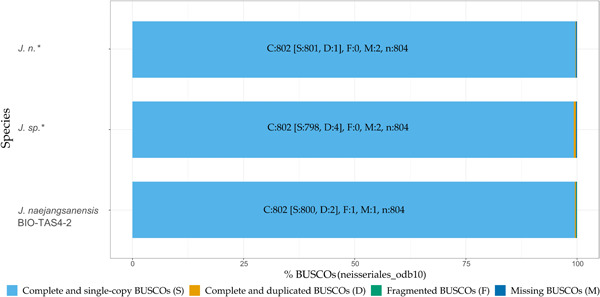
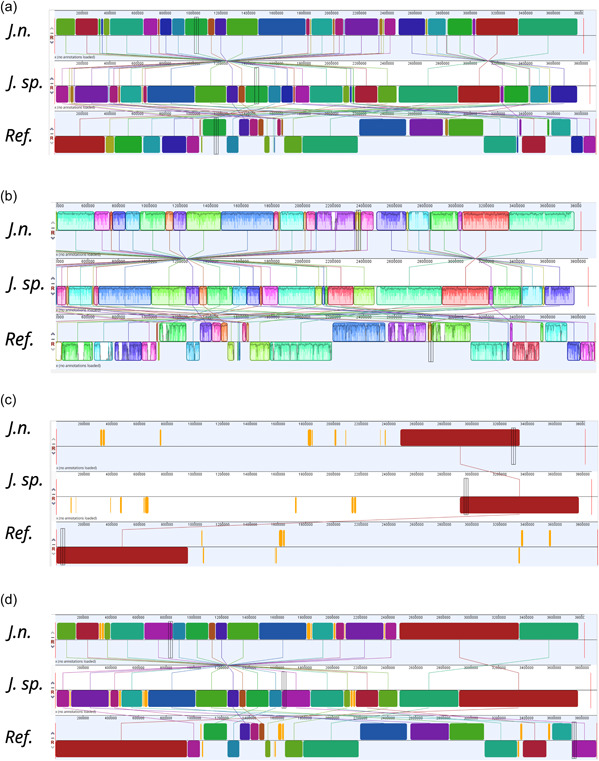
Chitin is the second most abundant polysaccharide worldwide as part of arthropods' exoskeletons and fungal cell walls. Low concentrations in soils and sediments indicate rapid decomposition through chitinolytic organisms in terrestrial and aquatic ecosystems. The enacting enzymes, so-called chitinases, and their products, chitooligosaccharides, exhibit promising characteristics with applications ranging from crop protection to cosmetics, medical, textile, and wastewater industries. Exploring novel chitinolytic organisms is crucial to expand the enzymatical toolkit for biotechnological chitin utilization and to deepen our understanding of diverse catalytic mechanisms. In this study, we present two long-read sequencing-based genomes of highly similar Jeongeupia species, which have been screened, isolated, and biochemically characterized from chitin-amended soil samples. Through metabolic characterization, whole-genome alignments, and phylogenetic analysis, we could demonstrate how the investigated strains differ from the taxonomically closest strain Jeongeupia naejangsanensis BIO-TAS4-2T (DSM 24253). In silico analysis and sequence alignment revealed a multitude of highly conserved chitinolytic enzymes in the investigated Jeongeupia genomes. Based on these results, we suggest that the two strains represent a novel species within the genus of Jeongeupia, which may be useful for environmentally friendly N-acetylglucosamine production from crustacean shell or fungal biomass waste or as a crop protection agent.

Keywords: Neisseria; bioinformatics; comparative genomics; taxonomy.


Conflict of interest statement

The authors declare no conflict of interest.

Figures

Figure 1
Figure 1
Single streaks of the chitinolytic soil bacteria strains “J. n.” (a) and “J. sp.” (b) on colloidal chitin containing (2% wt/vol) agar plates. Strains were incubated at 28°C for 3 days before documentation. Chitinase screening media of different pH values were tested, pH 6 (a) and pH 7 (b) are depicted in this figure. Enzyme activity can be deduced by translucent halos around the colony‐forming units, where chitin is degraded.
Figure 2
Figure 2
Phylogenetic trees based on 16S rRNA gene or whole‐genome sequences. Both trees were inferred with FastME 2.1.6.1 (Lefort et al., 2015) from GBDP distances calculated from 16S rRNA gene (a) or genome (b) sequences. The branch lengths are scaled in terms of the GBDP distance formula d5. The numbers above branches are GBDP pseudobootstrap support values > 60% from 100 replications, with an average branch support of 93.3% (a) or 71.2% (b). The trees were rooted at the midpoint (Farris, 1972). G + C percent values were 48.74–68.37, δ statistics 0.26–0.361 (a) and 0.253–0.373 (b), genome sizes (in bp) 2,854,912–5,153,521, number of proteins 2764–4454 and SSU lengths (in bp, applies for (a) only) 1285–1526. The numbers in red represent branch length values. C, cytosine; G, guanine; GBDP, Genome BLAST Distance Phylogeny; rRNA, ribosomal RNA.
Figure 3
Figure 3
Functional annotation of the J. n. and J. sp. genomes based on Clusters of Orthologous Groups (COGs) of proteins. Please note, that the scale for the group of poorly characterized enzymes (d) differs from that of the other functional groups (a–c). For the approx. A total of 3340 unique genes each, 79% could be annotated (a–c) while 21% are of unknown function (d).
Figure 4
Figure 4
Rootless phylogenetic tree of chitin‐hydrolyzing Jeongeupia strains based on Shimodaira–Hasegawa‐like local support. Enzymes were data mined from the Jeongeupia genomes with dbCAN 3.0, clades are labeled with Clusters of Orthologous Groups and Gene Ontology terms and SWISS‐MODEL‐based functional annotation predictions. Sequence alignment was performed with CLUSTALW. The phylogenetic tree was inferred using FastTree v2.1.8 with default parameters. BIO‐TAS4‐2T = Jeongeupia naejangsanensis reference. J. n. and J. sp. are whole‐genome sequenced strains from this study. Differences are framed in red. CBM, carbohydrate‐binding module; GH, glycoside hydrolases of family 18, 19, or 20; LPMO, lytic polysaccharide monooxygenase.
Figure 5
Figure 5
Whole‐genome sequence alignment of J. n, J. sp., and the Jeongeupia naejangsanensis type strain BIO‐TAS4‐2 (DSM 24253) with progressiveMauve. (a) A locally collinear block (LCB) weight of 45,296 bp was applied. J. n. (this study) was arbitrarily set as a reference. See supplementary data (Figure A6) for how different LCB weight settings affect the number of LCBs. Links and identical colors indicate conserved genetic regions, low‐conserved regions are colored in orange, while nonconserved regions appear as gaps. Shifted LCBs indicate inverted regions compared to the reference at the top. The largest coherent low/nonconserved region between BIO‐TAS4‐2T and J. n./J. sp. is approximately 105 kb in length and framed in blue. (b) Individual sequence homologies within LCBs, where regions of low sequence identity are framed in red. Figure obtained from the progressiveMauve plugin within the Geneious Prime software (v.2022.0.1).
Figure 6
Figure 6
Circos plot of the two in this study generated genome sequences of J. n. and J. sp., compared to the type strain genome of J. naejangsanensis BIO‐TAS4‐2T. Circles from outermost to innermost represent (1) ideogram with contigs (ctg) and active phage regions indicated in black and inactive regions in gray, (2) conserved regions as detected with Mauve, (3) GC‐skew; regions with above average GC contents are labeled in orange, in contrast to AT richer regions labeled in blue. The origin of replication (ORI) is usually located at one of the two transition points and was identified with DoriC. (4) Chitin‐enacting enzyme CDS‐accession numbers, due to clustering, not all proteins labels could be mapped, refer to Figure 4. Red = lytic polysaccharide monooxygenase, blue = N‐acetyl‐hexosaminidase, black = glycosyl hydrolase family 18 (GH18, chitinase), orange = GH19, green = GH20, (5) location of respective genes, and (6) links between homologous enzymes as identified with CLUSTALW amino acid sequence alignment. Image created with CIRCOS. *, this study; **, reference.
Figure A1
Figure A1
Chitinase producer screening agar plates. Chitin‐amended soil samples were incubated for 2 weeks at room temperature. The soil was moisturized with tap water if necessary. Then, sterile phosphate‐buffered saline was added, and incubated for 30 min on a thermal shaker, and resulting supernatants were streaked out on chitin agar plates with pH 6 (a) and pH 7 (b). Halos around colony‐forming units indicate chitin hydrolysis activities, due to degradation and therefore clearance of the white colloidal chitin. Colony forming units marked with an “X,” highlighted through circles, were subsequently streaked on separate chitinase producer screening agar plates.
Figure A2
Figure A2
API 50CH sugar metabolism results of the chitinolytic bacterium J. sp. (this study). Yellow highlights on the left indicate differences to the closely related J. naejangsanensis BIO‐TAS4‐2 type strain (Yoon et al., 2010). Test tubes colored in red indicate an inability to utilize a given sugar, while yellow test tubes indicate a positive result based on a pH shift. Esculin in tube 25 should turn black for a positive test result. We interpreted the strong darkening as a weak positive result.
Figure A3
Figure A3
API 50CH sugar metabolism results of the chitinolytic bacterium J. n. (this study). Yellow highlights on the left indicate differences to the closely related Jeongeupia naejangsanensis BIO‐TAS4‐2 type strain (Yoon et al., 2010). Test tubes colored in red indicate an inability to utilize a given sugar, and yellow test tubes indicate a positive result based on a pH shift. Esculin in tube 25 should turn black for a positive result. We interpreted the strong darkening as a weak positive result.
Figure A4
Figure A4
API NE 20 sugar metabolism results of the chitinolytic bacteria J. n. and J. sp. Yellow highlights indicate differences between both strains regarding their sugar metabolism. For ESCulin: A positive result is indicated through a gray/brown/black color, as seen on the left, whereas a brown coloring is visible merely at the bottom of the tube in the case of J. sp. ADH, l‐arginine; ADI, adipic acid; ARA, l‐arabinose; CAP, capric acid; CIT, trisoium citrate; ESC, esculin; GEL, gelatin; GLU, d‐glucose (assimilation); GLU, d‐glucose (fermentation); GNT, potassium gluconate; MAL, d‐maltose; MNE, d‐mannose; MLT, malic acid; NAG, N‐acetyl‐glucosamine; NO3, potassium nitrate; PAC, phenylacetic acid; PNPG, 4‐nitrophenyl‐βd‐galactopyranoside; TRP, l‐tryptophane; URE, urea.
Figure A5
Figure A5
Genome quality assessment with BUSCO (v.5.3.2), based on near‐universal single‐copy orthologs in the order of Neisseriales (odb10). Asterisk‐labeled chitinolytic strains J. n. and J. sp. of this study were genome sequenced with a Sequel IIe platform (Pacific Biosciences). The reference genome Jeongeupia naejangsanensis BIO‐TAS4‐2T was generated with a NextGen 500 platform (Illumina).
Figure A6
Figure A6
Whole‐genome sequence alignment of J. n., J. sp., and the Jeongeupia naejangsanensis type strain BIO‐TAS4‐2 (DSM 24253) with progressiveMauve. Locally collinear block (LCB) weights of 3,866 (a and b), 131,237 (c), and 45,296 bp (d) were applied. J. n. (this study) was arbitrarily set as a reference (Ref.). Links and identical colors indicate conserved genetic regions, low‐conserved regions are colored in orange, while nonconserved regions appear as gapA. Shifted LCBs indicate inverted regions compared to the Ref. at the top.

Similar articles

Cited by

References

    1. Aam, B. B. , Heggset, E. B. , Norberg, A. L. , Sørlie, M. , Vårum, K. M. , & Eijsink, V. G. H. (2010). Production of chitooligosaccharides and their potential applications in medicine. Marine Drugs, 8, 1482–1517. 10.3390/md8051482 - DOI - PMC - PubMed
    1. Abu Hassan, M. A. , Tan, P. L. , & Zainon Noor, Z. (2009). Coagulation and flocculation treatment of wastewater in textile industry using chitosan. Journal of Chemical and Natural Resources Engineering, 4, 43–53.
    1. Adrangi, S. , & Faramarzi, M. A. (2013). From bacteria to human: A journey into the world of chitinases. Biotechnology Advances, 31, 1786–1795. 10.1016/j.biotechadv.2013.09.012 - DOI - PubMed
    1. Afgan, E. , Baker, D. , van den Beek, M. , Blankenberg, D. , Bouvier, D. , Čech, M. , Chilton, J. , Clements, D. , Coraor, N. , Eberhard, C. , Grüning, B. , Guerler, A. , Hillman‐Jackson, J. , Von Kuster, G. , Rasche, E. , Soranzo, N. , Turaga, N. , Taylor, J. , Nekrutenko, A. , & Goecks, J. (2016). The Galaxy platform for accessible, reproducible and collaborative biomedical analyses: 2016 update. Nucleic Acids Research, 44, W3–W10. 10.1093/nar/gkw343 - DOI - PMC - PubMed
    1. Armstrong, J. , Fiddes, I. T. , Diekhans, M. , & Paten, B. (2019). Whole‐genome alignment and comparative annotation. Annual Review of Animal Biosciences, 7, 41–64. 10.1146/annurev-animal-020518-115005.Whole-Genome - DOI - PMC - PubMed

Publication types

LinkOut - more resources