

Identification and Prediction of Clinical Phenotypes in Hospitalized Patients With COVID-19: Machine Learning From Medical Records
- PMID: 37642512
- PMCID: PMC10589836
- DOI: 10.2196/46807
Identification and Prediction of Clinical Phenotypes in Hospitalized Patients With COVID-19: Machine Learning From Medical Records
Abstract
Background: There is significant heterogeneity in disease progression among hospitalized patients with COVID-19. The pathogenesis of SARS-CoV-2 infection is attributed to a complex interplay between virus and host immune response that in some patients unpredictably and rapidly leads to "hyperinflammation" associated with increased risk of mortality. The early identification of patients at risk of progression to hyperinflammation may help inform timely therapeutic decisions and lead to improved outcomes.
Objective: The primary objective of this study was to use machine learning to reproducibly identify specific risk-stratifying clinical phenotypes across hospitalized patients with COVID-19 and compare treatment response characteristics and outcomes. A secondary objective was to derive a predictive phenotype classification model using routinely available early encounter data that may be useful in informing optimal COVID-19 bedside clinical management.
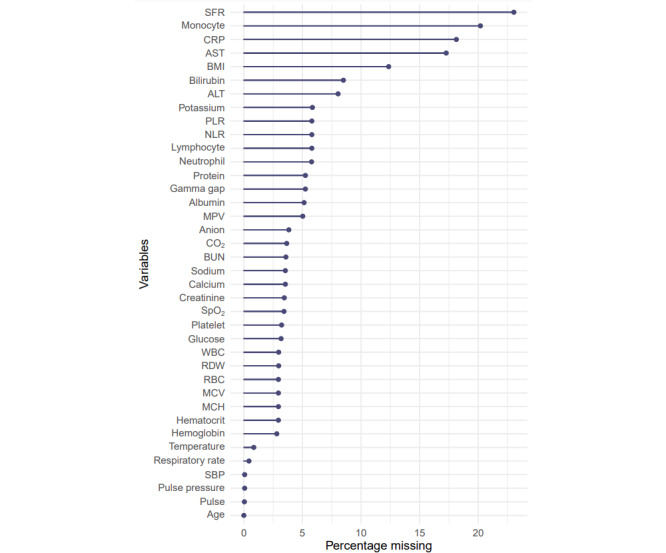
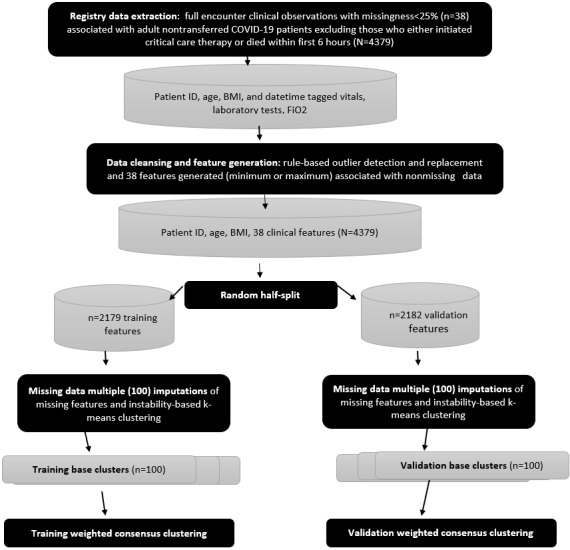
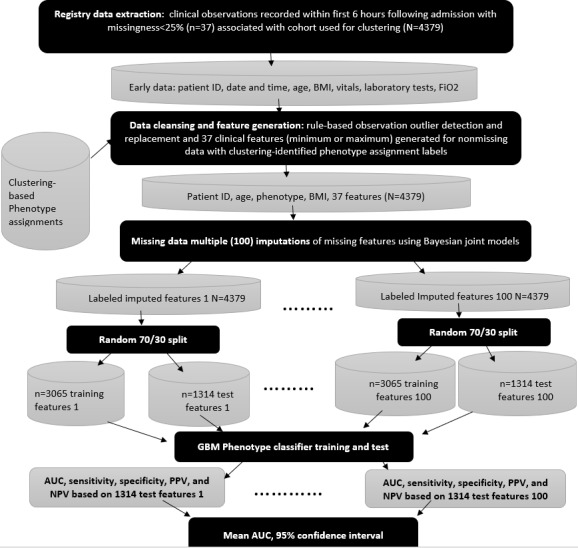
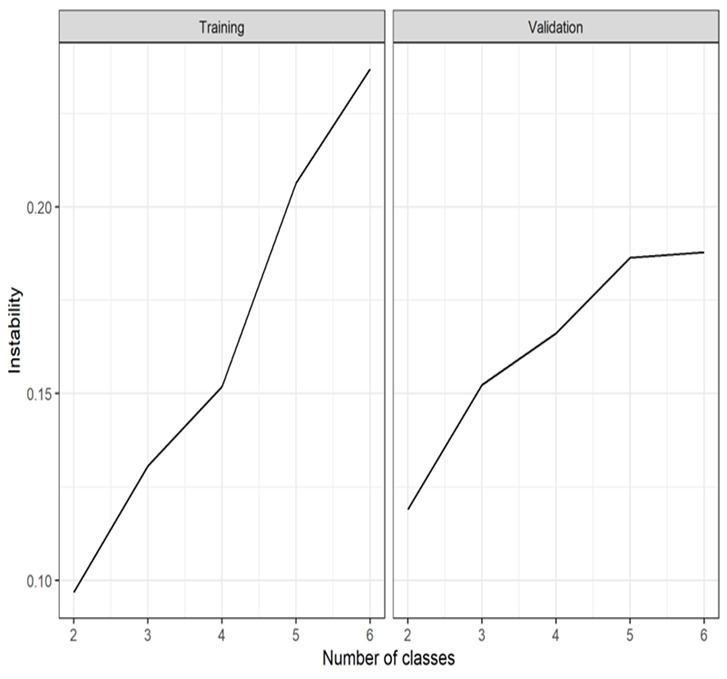
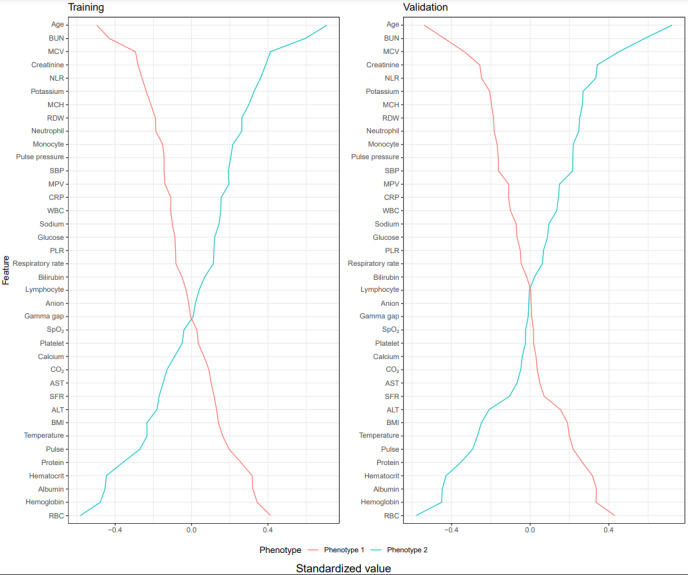
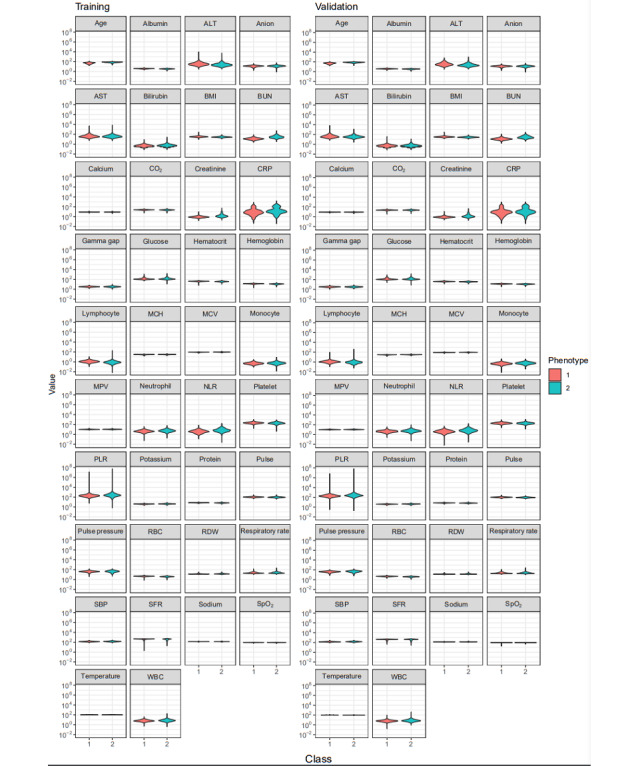
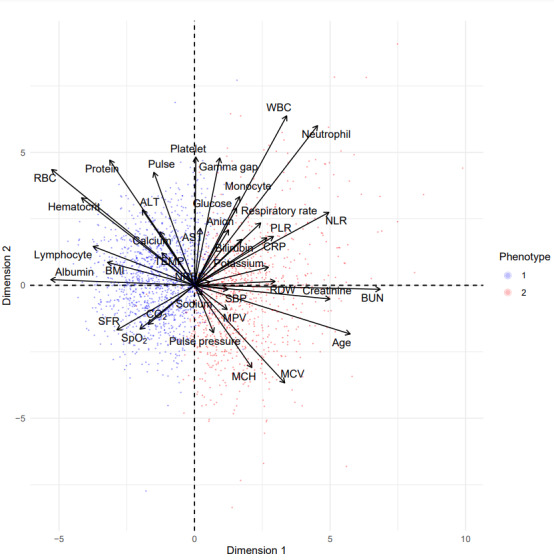
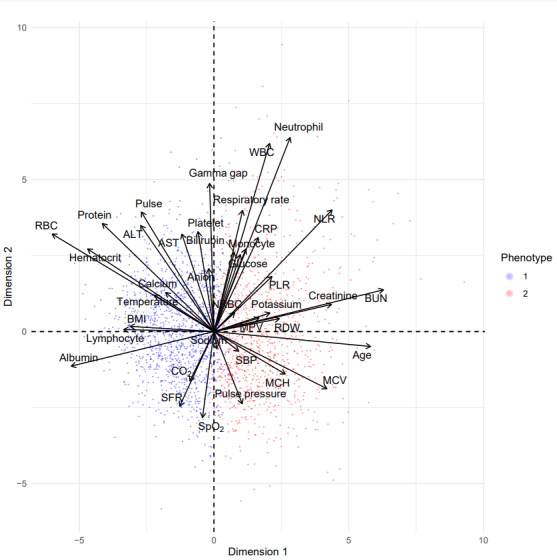
Methods: This was a retrospective analysis of electronic health record data of adult patients (N=4379) who were admitted to a Johns Hopkins Health System hospital for COVID-19 treatment from 2020 to 2021. Phenotypes were identified by clustering 38 routine clinical observations recorded during inpatient care. To examine the reproducibility and validity of the derived phenotypes, patient data were randomly divided into 2 cohorts, and clustering analysis was performed independently for each cohort. A predictive phenotype classifier using the gradient-boosting machine method was derived using routine clinical observations recorded during the first 6 hours following admission.
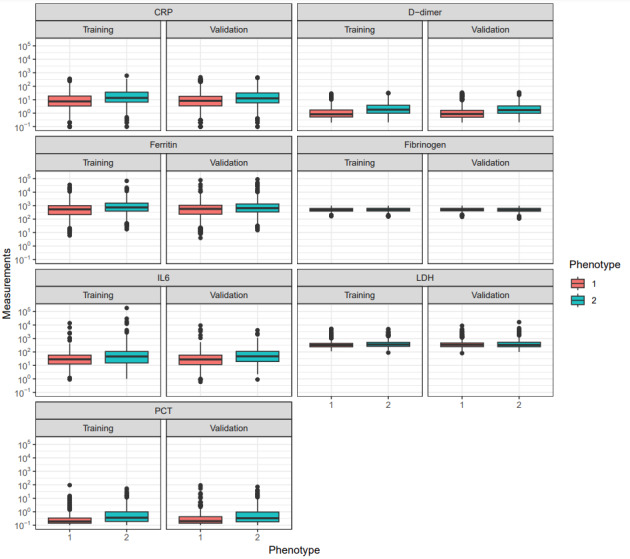
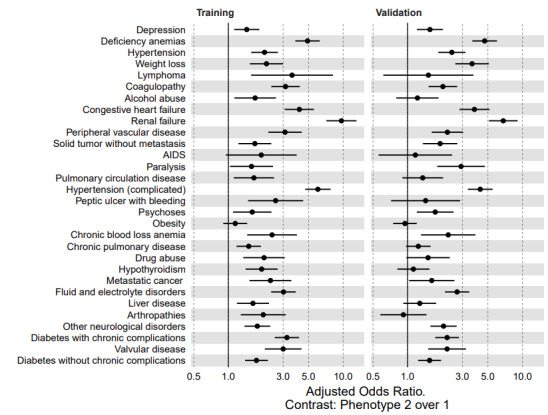
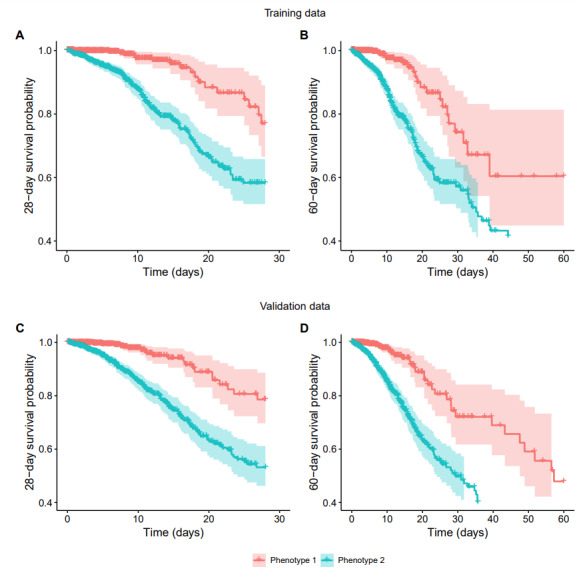
Results: A total of 2 phenotypes (designated as phenotype 1 and phenotype 2) were identified in patients admitted for COVID-19 in both the training and validation cohorts with similar distributions of features, correlations with biomarkers, treatments, comorbidities, and outcomes. In both the training and validation cohorts, phenotype-2 patients were older; had elevated markers of inflammation; and were at an increased risk of requiring intensive care unit-level care, developing sepsis, and mortality compared with phenotype-1 patients. The gradient-boosting machine phenotype prediction model yielded an area under the curve of 0.89 and a positive predictive value of 0.83.
Conclusions: Using machine learning clustering, we identified and internally validated 2 clinical COVID-19 phenotypes with distinct treatment or response characteristics consistent with similar 2-phenotype models derived from other hospitalized populations with COVID-19, supporting the reliability and generalizability of these findings. COVID-19 phenotypes can be accurately identified using machine learning models based on readily available early encounter clinical data. A phenotype prediction model based on early encounter data may be clinically useful for timely bedside risk stratification and treatment personalization.
Keywords: COVID; big data; biomarkers; clinical phenotypes; critical care; early warning; electronic medical record; immune response; infection; machine learning; mortality; pathogenesis; phenotype; respiratory distress; sepsis; support tool; training; treatment; utility.
©Tom Velez, Tony Wang, Brian Garibaldi, Eric Singman, Ioannis Koutroulis. Originally published in JMIR Formative Research (https://formative.jmir.org), 06.10.2023.
Conflict of interest statement
Conflicts of Interest: TV is the chief executive officer of Computer Technology Associates, Inc, a small business engaged in the commercialization of an artificial intelligence platform called “VFusion” directed at the clinical decision support market. Computer Technology Associates self-funded their participation in this study. BG is a member of the Food and Drug Administration Pulmonary-Allergy Drugs Advisory Committee and a board member of the Society of Bedside Medicine and has received consulting fees from Janssen Research and Development, LLC (related to vaccine trial case adjudication); Gilead Sciences, Inc (related to COVID-19 therapeutics); and Atea Pharmaceuticals, Inc (related to COVID-19 therapeutics). BTG reports research funding from Johns Hopkins inHealth (the Johns Hopkins Precision Medicine Initiative) and the John Templeton Foundation. All other authors declare no other conflicts of interest.
Figures
Similar articles
-
The Development and Validation of Simplified Machine Learning Algorithms to Predict Prognosis of Hospitalized Patients With COVID-19: Multicenter, Retrospective Study.J Med Internet Res. 2022 Jan 21;24(1):e31549. doi: 10.2196/31549. J Med Internet Res. 2022. PMID: 34951865 Free PMC article.
-
Machine Learning Classifier Models Can Identify Acute Respiratory Distress Syndrome Phenotypes Using Readily Available Clinical Data.Am J Respir Crit Care Med. 2020 Oct 1;202(7):996-1004. doi: 10.1164/rccm.202002-0347OC. Am J Respir Crit Care Med. 2020. PMID: 32551817 Free PMC article.
-
Derivation, Validation, and Potential Treatment Implications of Novel Clinical Phenotypes for Sepsis.JAMA. 2019 May 28;321(20):2003-2017. doi: 10.1001/jama.2019.5791. JAMA. 2019. PMID: 31104070 Free PMC article.
-
Machine Learning to Predict Mortality and Critical Events in a Cohort of Patients With COVID-19 in New York City: Model Development and Validation.J Med Internet Res. 2020 Nov 6;22(11):e24018. doi: 10.2196/24018. J Med Internet Res. 2020. PMID: 33027032 Free PMC article.
-
Sepsis in silico: definition, development and application of an electronic phenotype for sepsis.J Med Microbiol. 2025 Mar;74(3). doi: 10.1099/jmm.0.001986. J Med Microbiol. 2025. PMID: 40153307 Review.
References
-
- Wang D, Hu B, Hu C, Zhu F, Liu X, Zhang J, Wang B, Xiang H, Cheng Z, Xiong Y, Zhao Y, Li Y, Wang X, Peng Z. Clinical characteristics of 138 hospitalized patients with 2019 novel coronavirus-infected pneumonia in Wuhan, China. JAMA. 2020 Mar 17;323(11):1061–9. doi: 10.1001/jama.2020.1585. https://europepmc.org/abstract/MED/32031570 2761044 - DOI - PMC - PubMed
-
- Yang X, Yu Y, Xu J, Shu H, Xia J, Liu H, Wu Y, Zhang L, Yu Z, Fang M, Yu T, Wang Y, Pan S, Zou X, Yuan S, Shang Y. Clinical course and outcomes of critically ill patients with SARS-CoV-2 pneumonia in Wuhan, China: a single-centered, retrospective, observational study. Lancet Respir Med. 2020 May;8(5):475–81. doi: 10.1016/S2213-2600(20)30079-5. https://europepmc.org/abstract/MED/32105632 S2213-2600(20)30079-5 - DOI - PMC - PubMed
-
- Cidade JP, Coelho L, Costa V, Morais R, Moniz P, Morais L, Fidalgo P, Tralhão A, Paulino C, Nora D, Valério B, Mendes V, Tapadinhas C, Povoa P. Septic shock 3.0 criteria application in severe COVID-19 patients: an unattended sepsis population with high mortality risk. World J Crit Care Med. 2022 Jul 09;11(4):246–54. doi: 10.5492/wjccm.v11.i4.246. https://www.wjgnet.com/2220-3141/full/v11/i4/246.htm - DOI - PMC - PubMed
-
- González J, Benítez ID, de Gonzalo-Calvo D, Torres G, de Batlle J, Gómez S, Moncusí-Moix A, Carmona P, Santisteve S, Monge A, Gort-Paniello C, Zuil M, Cabo-Gambín R, Manzano Senra C, Vengoechea Aragoncillo JJ, Vaca R, Minguez O, Aguilar M, Ferrer R, Ceccato A, Fernández L, Motos A, Riera J, Menéndez R, Garcia-Gasulla D, Peñuelas O, Labarca G, Caballero J, Barberà C, Torres A, Barbé F, CIBERESUCICOVID Project (COV20/00110‚ ISCIII) Impact of time to intubation on mortality and pulmonary sequelae in critically ill patients with COVID-19: a prospective cohort study. Crit Care. 2022 Jan 10;26(1):18. doi: 10.1186/s13054-021-03882-1. https://ccforum.biomedcentral.com/articles/10.1186/s13054-021-03882-1 10.1186/s13054-021-03882-1 - DOI - DOI - PMC - PubMed
Publication types
LinkOut - more resources
Full Text Sources
Miscellaneous
