. 2024 Jan;20(1):166-187.
doi: 10.1080/15548627.2023.2252300. Epub 2023 Aug 29.

Phosphorylation-state dependent intraneuronal sorting of Aβ differentially impairs autophagy and the endo-lysosomal system

Affiliations

Phosphorylation-state dependent intraneuronal sorting of Aβ differentially impairs autophagy and the endo-lysosomal system

Akshay Kapadia et al. Autophagy. 2024 Jan.

Abstract

AD: Alzheimer disease; APP: amyloid beta precursor protein; ATG: autophagy related; Aβ: amyloid-β; CTSD: cathepsin D; DAPI: 4',6-diamidino-2-phenylindole; EEA1: early endosome antigen 1; FA: formic acid; GFP: green fluorescent protein; LAMP2: lysosomal-associated membrane protein 2; MAP1LC3/LC3: microtubule-associated protein 1 light chain 3; MAP2: microtubule-associated protein 2; nmAβ: non-modified amyloid-β; npAβ: non-phosphorylated amyloid-β; pAβ: phosphorylated amyloid-β; p-Ser26Aβ: amyloid-β phosphorylated at serine residue 26; p-Ser8Aβ: amyloid-β phosphorylated at serine residue 8; RAB: RAB, member RAS oncogene family; RFP: red fluorescent protein; SQSTM1/p62: sequestome 1; YFP: yellow fluorescent protein.

Keywords: Alzheimer’s disease; autophagic flux; neurodegeneration; phosphorylated Aβ; post-translationally modified Aβ; vesicular trafficking.


Conflict of interest statement

No potential conflict of interest was reported by the authors.

Figures
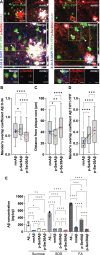
Figure 1.
Figure 1.
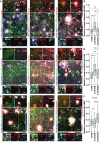
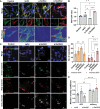
Differential intraneuronal deposition of pAβ species in APP-PSEN1dE9 transgenic mice. (A) Immunohistochemistry depicting differential intraneuronal and extracellular deposition of p-Ser8Aβ (stained with antibody 1E4E11, red) and p-Ser26Aβ (stained with antibody 5H11C10, red) compared to non-modified Aβ (nmAβ, stained with antibody 7H3D6, gray) in brain sections of APP-PSEN1dE9×THY1-YFP transgenic mouse cortex (7.4 m, female). Scale bar: 50 µm; zoomed panels, Scale bar: 10 µm. White arrowheads indicate colocalized punctate staining between red and gray channels in THY1-YFP-positive neurons. Source data have been provided in figure S8A. (B) Mander’s coefficient of overlap between nmAβ (A, gray channel; B, blue data points), p-Ser8Aβ (A, red channel; B, green data points) and p-Ser26Aβ (A, red channel; B, red data points) with X-34 (plaque core, blue channel). (C) Quantification of plaque association of nmAβ, p-Ser8Aβ and p-Ser26Aβ species. Distance from the plaque core was measured using Fiji ImageJ concentric circle processing module. (D) Mander’s coefficient of overlap between nmAβ (blue data points), p-Ser8Aβ (green data points) and p-Ser26Aβ (red data points) with respect to THY1-YFP-positive neurons (green channel) respectively. Box plot depicts the overall distribution of data, and each data point represents average values from an individual mouse, (A-B, n = ~100 cortical plaques), N = 3 transgenic mice. *p = 0.05; **p = 0.01; ***p = 0.001; ****p = 0.0001 (One-way ANOVA, GraphPad Prism). (E) Bar plots depicting the quantification of Aβ levels (pg/µg) in sucrose, SDS and formic acid (FA) soluble fractions by ELISA using phosphorylation-state specific antibodies, respectively (see the Materials and Methods section). Values represent mean ± S.D., from four different mouse brains per cohort, from two independent experiments, n = 4 mice, N = 2. *p = 0.05; **p = 0.01; ***p = 0.001; ****p = 0.0001 (two-way ANOVA, GraphPad Prism). Transgenic expression of human APP and accumulation of Aβ was verified by western immunoblotting (Figure S1). Additional information and further ELISA characterization of mouse brain lysates are provided in tables S1-S2, respectively.
Figure 2.
Figure 2.
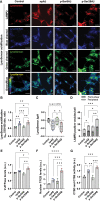
Differential intraneuronal colocalization of pAβ with vesicular marker proteins in APP-PSEN1dE9 transgenic mice. (A, C, E) Immunohistochemistry depicting differential intraneuronal colocalization of Aβ species in brain sections of APP-PSEN1dE9×THY1-YFP transgenic mouse cortex (7.3 m, female) stained with different phosphorylation-state specific Aβ antibodies (nmAβ-7H3D6, p-Ser8Aβ-1E4E11 and p-Ser26Aβ-5H11C10; red channels respectively) along with antibodies against EEA1 (gray, A); LC3 (gray, C) and LAMP2 (gray, E) and DAPI + X-34 (nuclei and plaque core, blue). Scale bar: 50 µm; zoomed panels, 10 µm. White arrowheads indicate colocalized punctate staining between red and gray channels in THY1-YFP-positive neurons. Source data have been provided in figure S8B-D. (B, D, F) Mander’s coefficient of overlap between red channels (npAβ, blue; p-Ser8Aβ, green and p-Ser26Aβ, red data points) with respect to gray channels (EEA1, B; LC3, D and LAMP2, F), quantified within THY1-YFP-positive neurons respectively. Box plot depicts the overall distribution of data, and each data point represents average values from an individual mouse, N = 3 transgenic mice. ns > 0.05; *p = 0.05; **p = 0.01; ***p = 0.001; ****p = 0.0001 (One-way ANOVA, GraphPad Prism). Additional staining and antibody control experiments are provided in figure S2.
Figure 3.
Figure 3.
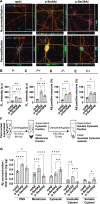
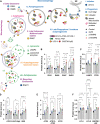
Phosphorylation-state dependent uptake and accumulation of Aβ in primary neurons. (A) Immunocytochemistry depicting Aβ accumulation in primary cortical neurons treated with the indicated Aβ variants (500 nM, 4 h). Cells were processed without permeabilization or with permeabilization to detect surface associated Aβ and internalized Aβ, respectively, by staining with anti-Aβ antibody 82E1 (green). Cells were co-stained with Alexa555-conjugated phalloidin (actin, red) and DAPI (nuclei, blue). Scale bar: 10 μm. (B, C) Bar plots depicting average values of absolute fluorescence intensities in the green channel (Aβ signals) in non-permeabilized cells (P-, B) and permeabilized cells (P+, C), analyzed by immunocytochemistry. Dotted line depicts the fluorescence signals in cells treated without Aβ (control). (D, E) bar plots depicting the quantification of neurons with surface bound Aβ (P-, E) and internalized Aβ (P+, D). Values represent mean ± S.D.; n = ~200 neurons, N = 4. *p = 0.05; **p = 0.01; ***p = 0.001; ****p = 0.0001 (One-way ANOVA, GraphPad Prism). (F) Workflow representation for fractionation of cellular protein based on differential centrifugation. (G) Quantification of absolute Aβ levels in different cellular fractions by ELISA (PNS, post nuclear supernatant) using anti-Aβ antibody 82E1. Values represent mean ± S.D.; n = 6, N = 3. *p = 0.05; **p = 0.01; ***p = 0.001; ****p = 0.0001 (two-way ANOVA, GraphPad Prism). Additional data and respective quantifications are shown in figure S3.
Figure 4.
Figure 4.
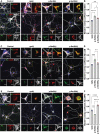
Phosphorylation-state specific intraneuronal sorting of Aβ to endo-lysosomal and autophagic compartments. (A, C, E) Primary cortical neurons were incubated without (control) or with the indicated Aβ variants (500 nM, 4 h) and co-stained with antibodies against the microtubule-associated protein 2 as neuronal markers (MAP2, gray), Aβ (82E1, green) and EEA1 (A, red), LC3 (C, red) or LAMP2 (E, red). Nuclei were stained with DAPI (blue). Scale bar: 10 µm. Dotted boxes indicate the regions zoomed in the merged panels (above) and individual channels (below). (B, D, F) Mander’s overlap coefficients between Aβ (green channel) with early endosomes, EEA1 (B); autophagic vesicles, LC3 (D) and lysosomes, LAMP2 (F) (respective red channels), analyzed by the Fiji ImageJ colocalization processing module. Values represent mean ± S.D.; n = 6, N = 3. * p = 0.05; ** p = 0.01; *** p = 0.001; **** p = 0.0001 (One-way ANOVA, GraphPad Prism). Additional data are shown in figure S4.
Figure 5.
Figure 5.
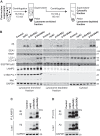
Phosphorylation-state dependent vesicular localization of Aβ. Primary cortical neurons treated with Aβ variants (500 nM, 4 h) were subjected to lysosome enrichment (A-B) or immunoisolation of LAMP2 (C) or LC3-positive compartments (D). (A) Workflow representation for lysosome enrichment based on differential centrifugation. (B) Immunoblot analysis of lysosome-enriched, lysosome-depleted, and cytosolic fractions depicting the differential separation of Aβ with the indicated endo-lysosomal and autophagy associated proteins. (C-D) Immunoisolation of intact lysosomes using LAMP2 (C) or autophagic vesicles (D) from cellular homogenate of primary cortical neurons treated with Aβ variants (500 nM, 4 h). Aβ in the isolated vesicles was detected with anti-Aβ antibody 82E1 via western immunoblotting. GAPDH and Aβ (82E1) were used as loading/starting controls. Results are representative of two independent experiments. IP, immunoprecipitation; IB, immunoblot. Respective quantifications and additional analyses are shown in figure S5.
Figure 6.
Figure 6.
Phosphorylation-state specific effects of Aβ on autophagic vesicles. (A-E) Immunocytochemical analysis of SH-SY5Y cells expressing tandem reporter constructs GFP-LC3-RFP-LC3Δ (A-B) or mCherry-GFP-LC3B (C-E) upon treatment with different Aβ variants (1 µM, 24 h). Cells were co-stained with DAPI (nuclei, blue). Scale bar: 10 μm. Dotted boxes indicate the region zoomed in the panels below. (A) Merged channel images for GFP (green) and RFP (red) signals along with DAPI (nuclei, blue, upper row). Single channel images and RFP/GFP ratiometric images are shown in the middle and lower row, respectively. (B) Bar plot showing the ratio of RFP:GFP fluorescence intensities, respectively. Readings were normalized to cells incubated without Aβ (control). Values represent mean ± S.D.; n = 6, N = 3. *p = 0.05; **p = 0.01; ***p = 0.001; ****p = 0.0001 (One-way ANOVA, GraphPad Prism). (C) Merged channel images depict GFP (green) and mCherry (red) signals along with DAPI (nuclei, blue). Independent zoom regions below depict GFP (green), mCherry (red) and Aβ (gray) channels, respectively. (D) Quantification of the number of dual fluorescent (mCherry+ GFP+) and only mCherry-positive (mCherry+ GFP) vesicles per cell representing differential autophagic flux. Values represent mean ± S.D.; n = 8, N = 4. (E) Mander’s overlap coefficient analysis of Aβ (gray channel) with GFP (green channel) and mCherry (red channel) positive vesicles analyzed using the Fiji ImageJ colocalization processing module. Values represent mean ± S.D.; n = 8, N = 4. *p = 0.05; **p = 0.01; ***p = 0.001; ****p = 0.0001 (Two-way ANOVA, GraphPad Prism). Additional analyses are shown in figure S7A-B.
Figure 7.
Figure 7.
Differential effects of phosphorylated Aβ species on lysosomes. (A-C) SH-SY5Y cells loaded with LysoSensor-dextran complex were treated without or with the indicated Aβ variants (1 μM, 24 h). After incubation, cells were co-stained with anti-LAMP2 antibody to visualize lysosomes (red, A). Scale bar: 10 μm. Green/blue channel ratiometric images (lower panel, scale 0–255) indicate acidification of the LysoSensor. (B) Absolute ratios of fluorescence emission intensities (λEm 535 and 450 nm) measured at λEx 380 nm were computed to determine the ratiometric response of LysoSensor acidification in SH-SY5Y cells treated with different Aβ variants (1 µM, 24 h). Values represent mean ± S.D.; n = 12, N = 4. *p = 0.05; **p = 0.01; ***p = 0.001; **** p = 0.0001 (One-way ANOVA, GraphPad Prism). (C) Change in LysoSensor pH (ΔpH) was quantified using the formula ΔpH = pHfinal (control/Aβ, t = 24 h) − pHinitial (control, t = 0 h). Box plot depicts the overall distribution of data, and each data point represents average values from an independent experiment; n = 12, N = 4. *p = 0.05; **p = 0.01; ***p = 0.001; ****p = 0.0001 (repeated measures one-way ANOVA, GraphPad Prism). (D) Quantification of the number of LAMP2-positive compartments within the perinuclear (<2 µm from nucleus) or peripheral space (>2 µm from nucleus until cell periphery) per cell. Values represent mean ± S.E.M.; n = 12, N = 3. *p = 0.05; **p = 0.01; ***p = 0.001; ****p = 0.0001 (One-way ANOVA, GraphPad Prism). (E-F) Quantification of western immunoblot data from SH-SY5Y cells upon treatment without (control) or with the indicated Aβ variants (1 μM, 24 h), for the ATP6V0A1 subunit of the V-ATPase in the PNS fraction (E) and TFEB (transcription factor EB) in the nuclear material (F). Values were normalized to control cells and are presented as mean ± S.D.; n = 6, N = 3. (G) SH-SY5Y cells treated with Aβ variants (1 µM, 24 h) or without (control) were examined for CTSD and CTSE activity (per µg of total cellular protein) using a CTSD and CTSE cleavable fluorogenic substrate. Readings were normalized to control cells; values represent mean ± S.D.; n = 6, N = 3. *p = 0.05; **p = 0.01; ***p = 0.001; ****p = 0.0001 (One-way ANOVA, GraphPad Prism). Time-dependent lysosomal acidification analysis and additional controls are shown in figure S7C-F.
Figure 8.
Figure 8.
Dysregulation of autophagy-endo-lysosomal pathway by different Aβ species. (A) Schematic depicting major components in the distinct phases of the autophagy-endo-lysosomal pathway. Respective symbols indicate the localization of p-Ser8Aβ (green triangles) and p-Ser26Aβ (red diamonds) in comparison to npAβ (blue squares) peptide. (B-F) Quantification of western immunoblot data from SH-SY5Y cells for proteins involved in the individual phases of autophagy and endo-lysosomal function upon treatment without (control) or with the indicated Aβ variants (1 μM, 24 h). Values represent mean ± S.E.M.; n = 6, N = 3. Representative data are provided in figure S8E.

References

    1. Selkoe DJ. Cell biology of the amyloid beta-protein precursor and the mechanism of Alzheimer’s disease. Annu Rev Cell Biol. 1994;10(1):373–403. doi: 10.1146/annurev.cb.10.110194.002105 - DOI - PubMed
    1. Cuello AC. Intracellular and extracellular Aβ, a tale of two neuropathologies. Brain Pathol. 2005;15(1):66–71. doi: 10.1111/j.1750-3639.2005.tb00101.x - DOI - PMC - PubMed
    1. Selkoe DJ, Hardy J. The amyloid hypothesis of Alzheimer’s disease at 25 years. EMBO Mol Med. 2016;8(6):595–608. doi: 10.15252/emmm.201606210 - DOI - PMC - PubMed
    1. Okazawa H. Intracellular amyloid hypothesis for ultra-early phase pathology of Alzheimer’s disease. Neuropathol. 2021;41:93–98. doi: 10.1111/neup.12738 - DOI - PMC - PubMed
    1. Gouras GK, Tampellini D, Takahashi RH, et al. Intraneuronal β-amyloid accumulation and synapse pathology in Alzheimer’s disease. Acta Neuropathol. 2010;119(5):523–541. doi: 10.1007/s00401-010-0679-9 - DOI - PMC - PubMed

Publication types