Mapping temperature-sensitive mutations at a genome scale to engineer growth switches in Escherichia coli
- PMID: 37642940
- PMCID: PMC10568205
- DOI: 10.15252/msb.202311596
Mapping temperature-sensitive mutations at a genome scale to engineer growth switches in Escherichia coli
Abstract
Temperature-sensitive (TS) mutants are a unique tool to perturb and engineer cellular systems. Here, we constructed a CRISPR library with 15,120 Escherichia coli mutants, each with a single amino acid change in one of 346 essential proteins. 1,269 of these mutants showed temperature-sensitive growth in a time-resolved competition assay. We reconstructed 94 TS mutants and measured their metabolism under growth arrest at 42°C using metabolomics. Metabolome changes were strong and mutant-specific, showing that metabolism of nongrowing E. coli is perturbation-dependent. For example, 24 TS mutants of metabolic enzymes overproduced the direct substrate metabolite due to a bottleneck in their associated pathway. A strain with TS homoserine kinase (ThrBF267D ) produced homoserine for 24 h, and production was tunable by temperature. Finally, we used a TS subunit of DNA polymerase III (DnaXL289Q ) to decouple growth from arginine overproduction in engineered E. coli. These results provide a strategy to identify TS mutants en masse and demonstrate their large potential to produce bacterial metabolites with nongrowing cells.
Keywords: CRISPR-Cas9 genome editing; growth-switches; metabolic valves; metabolomics; temperature-sensitive mutations.
© 2023 The Authors. Published under the terms of the CC BY 4.0 license.
Conflict of interest statement
The authors declare that they have no conflict of interest. Open Access funding enabled and organized by Projekt DEAL.
Figures

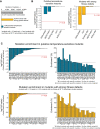
Schematic of the CRISPR screen. 16,038 sgRNAs plus repair templates (barcodes) were designed to introduce amino acid changes in 346 essential proteins (step 1). 15,120 of the barcodes were present in the final CRISPR library (step 2). The CRISPR library was cultured at 30 and at 42°C (n = 2 replicates). Strain‐specific barcodes (sgRNA and repair template) were sequenced every 2 h to determine the composition of the library (step 3).
K‐means clustering of fitness scores of 8,884 strains in the CRISPR library. Time‐course data were clustered into k = 6 clusters per temperature. The fitness scores were calculated by normalizing the read counts of the barcode of each mutant to the total number of reads per sample and to the first time point. Gray curves are the moving average of the mean of two replicates. Colored lines are cluster means and shaded areas their standard deviation (blue: 4 clusters with high fitness, yellow: 1 cluster with reduced fitness, red: 1 cluster with low fitness). Dashed lines indicate a fitness score of 1.
Relative composition of the CRISPR library at 30 and 42°C. Blue indicates high fitness, yellow a reduced fitness, and red low fitness. The bar graph in the middle connects the 30 and 42°C data. The light blue box indicates putative TS mutants.
Examples of fitness score dynamics of two strains that show temperature sensitivity (MurEW381Q and FtsQI74Q). Dots show data from two replicates per temperature. The lines are the moving average through the means. Blue: 30°C culture. Red: 42°C culture. Dashed lines indicate a fitness score of 1.

The bar plot shows the total number of mutants in our CRISPR library after recombination (gray), the number of putative temperature‐sensitive (TS) mutants (blue), and the number of mutants with strong fitness defects (yellow), which are strains with less than 15 reads at the start of the pooled fitness assay (t = 0 h) and strains that have a low fitness at 30°C based on cluster analysis.
The bar plots show the P‐values for testing an enrichment of mutations in alpha helices, beta sheets, turns, binding, and active sites among the putative TS mutants (blue bars) and strong fitness defect mutants (yellow bars). We used a one‐tailed Fisher's exact test (also see Dataset EV3) and considered conditions with P‐values < 0.05 as enriched.
The left bar plots show P‐values of the indicated mutations that were tested for an enrichment in the putative TS mutants (upper chart) and fitness defect mutants (lower chart) by a one‐tailed Fisher's exact test. We considered conditions with P‐values < 0.05 as enriched. The right bar plots show the %‐enrichment between the putative TS and all other mutants (upper chart) and the growth defect mutants and all other mutants (lower chart).


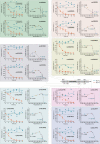
Relative abundance of strains in the pooled sublibrary of 250 putative TS mutants. The strain library was constructed twice (replicate 1 and 2), and dots are the mean of two technical sequencing replicates. The black lines indicate the difference between the two technical replicates. The read counts of single strains were normalized to the total number of reads. Yellow dots indicate 94 TS mutants that were isolated from the pooled sublibrary.
Maximal specific growth rates of 94 TS mutants and a control strain at 10 different temperatures between 30 and 44°C. Dots are the mean (n = 3 biological replicates for each temperature and each of the 95 strains). Vertical lines indicate standard deviations. Black squares and the line indicate the control strain. The box‐whisker plots show the median and 25th/75th percentiles. Two‐sample t‐tests (two‐tailed) were performed for each mutant against the control strain (also see Dataset EV7). At 42 and 43°C, all P‐values were below the respective indicated values.
Examples of maximal specific growth rates of the TS mutants AccDV120W and FolAM92P at different temperatures (Fig EV2 shows all 94 TS mutants). Dots are the mean, and vertical black lines indicate the standard deviation (n = 3). The black line was calculated by fitting an Arrhenius‐type function to the data (also see Appendix Fig S9).
Growth dynamics of the MurEW381Q strain (green) and the HisCI336D strain (yellow) during a temperature shift from 30 to 42°C. Dots show data from two replicates, and the lines connect the mean.


Location of TS mutants in the metabolic network. Sixty‐six TS mutations affect metabolic enzymes (yellow dots). Twenty‐two TS mutations affect nonmetabolic enzymes (green dots). Seven TS mutations affect proteins without enzymatic function (gray boxes).
Subset of the metabolome data. Shown are substrate metabolites that increase in 24 TS mutants (blue dots). Each strip of the dot plot shows one metabolite in all 94 TS mutants (mod. z‐score normalized). Dots are means (n = 3). Lines indicate standard deviations (calculated with error propagation). Each metabolite is the substrate for at least one TS mutant enzyme, which is indicated next to each strip of the dot plot.
Pathway‐focused analysis of the metabolome data. Pathways with metabolite increases (mod. z‐score > 3) are highlighted in the heatmap. The color code indicates if one, two, or more than two metabolites increase in a particular pathway. Target pathways (yellow boxes) are defined as pathways that involve a TS mutant enzyme.
Number of pathways that respond per strain (each dot is one strain, shown are 95 strains), and number of TS mutants that led to responses in a pathway (each dot is one pathway, shown are 93 pathways). A “response” means that at least one metabolite increases in a pathway (mod. z‐score > 3). The box‐whisker plot indicates the median (yellow line), and the 25th/75th percentiles (gray box). Analysis is based on mean values of the metabolome data from three biological replicates.

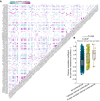
The heatmap shows the Pearson correlation coefficients (PCC) between metabolite data of all pair‐wise combinations of 94 TS mutants and a control strain. The metabolite levels were measured by FI‐MS after cultivation of the strains in 96‐well microtiter plates at 42°C for 16 h (n = 3). Data of 325 metabolites (mod. z‐scores) were used to calculate the PCC values.
The dot plot shows all PCC values from (A) (given under “all combinations”), the PCC values from pairs of genes that are in the same metabolic pathway (given under “pathway internal combinations”), and from genes, whose proteins form a complex (given under “protein complex internal combinations”). The box‐whisker plot indicates the median (red line), and the 25th and 75th percentiles (each dot is a combination, shown are all 4,465 combinations, 272 pathway internal combinations, and 8 protein complex internal combinations). We tested for differences between the PCC values in the three groups using a Wilcoxon rank‐sum test (two‐tailed) and indicate the respective P‐values. Analysis is based on mean values of the metabolome data from three biological replicates.

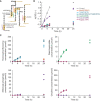
Two TS mutants, MetAF285W and ThrBF267D, at the homoserine branchpoint. MetA catalyzes the first step in the methionine biosynthesis pathway in E. coli, and ThrB catalyzes the first step in the threonine biosynthesis pathway.
Biomass‐specific concentration of the pool of homoserine and threonine (LC–MS/MS could not separate homoserine and threonine). Shown are cultures of the MetAF285W strain (red), the ThrBF267D strain (blue), and the control strain (gray). The strains were grown in shaking flasks at the indicated temperatures. Dots show samples from two replicates (n = 2). Lines connect mean values. Lower charts show the optical density (OD) in the same cultures.

Schematic of biosynthesis pathways of chorismate, lysine, methionine, isoleucine, and arginine. Dots represent metabolites. Valve symbols indicate TS mutant enzymes.
The chart shows the natural logarithm of biomass data (OD) from shaking flask cultivations of TS mutants and a control strain at 42°C. Dots are data from two replicates, and the lines connect the means.
The charts show the concentrations (μmol/l) of indicated metabolites during the cultivations from (B). The concentrations were quantified in samples of the whole culture broth by LC–MS/MS. Dots are data from two replicates, and the lines connect the means.

Arginine overproduction strain with the TS mutation DnaXL289Q for growth control. Dysregulation of the arginine pathway was achieved by deleting argR (removes transcriptional feedback) and inserting the ArgAH15Y mutation (removes allosteric feedback). The arginine exporter ArgO was overexpressed from a plasmid.
OD of the engineered arginine overproduction strain during cultivations at 42°C in shaking flasks. Dots are samples from two replicates (n = 2), and the line connects the means.
Arginine concentration (μmol/l) during the same cultivation (shown in B). Arginine levels were quantified in the whole culture broth by LC–MS/MS and calibrated with an authentic arginine standard. Dots show samples from two replicates (n = 2). The volumetric arginine production rate qV in the initial 6 h of cultivation was determined using a linear regression model (R 2 = 0.99, SE: standard error of the slope qV). The bar plot shows final arginine concentrations that were determined after 23 and 24 h.
Similar articles
-
High-throughput enrichment of temperature-sensitive argininosuccinate synthetase for two-stage citrulline production in E. coli.Metab Eng. 2020 Jul;60:14-24. doi: 10.1016/j.ymben.2020.03.004. Epub 2020 Mar 13. Metab Eng. 2020. PMID: 32179161 Free PMC article.
-
Temperature-Sensitive Mutants in the Influenza A Virus RNA Polymerase: Alterations in the PA Linker Reduce Nuclear Targeting of the PB1-PA Dimer and Result in Viral Attenuation.J Virol. 2015 Jun;89(12):6376-90. doi: 10.1128/JVI.00589-15. Epub 2015 Apr 8. J Virol. 2015. PMID: 25855727 Free PMC article.
-
Multiplex Design of the Metabolic Network for Production of l-Homoserine in Escherichia coli.Appl Environ Microbiol. 2020 Oct 1;86(20):e01477-20. doi: 10.1128/AEM.01477-20. Print 2020 Oct 1. Appl Environ Microbiol. 2020. PMID: 32801175 Free PMC article.
-
The Escherichia coli DNA polymerase III holoenzyme contains both products of the dnaX gene, tau and gamma, but only tau is essential.J Bacteriol. 1993 Sep;175(18):6018-27. doi: 10.1128/jb.175.18.6018-6027.1993. J Bacteriol. 1993. PMID: 8376347 Free PMC article.
-
Let's think again about using mammalian temperature-sensitive mutants to investigate functional molecules-The perspectives from the studies on three mutants showing chromosome instability.J Cell Biochem. 2018 Sep;119(9):7143-7150. doi: 10.1002/jcb.27205. Epub 2018 Jun 26. J Cell Biochem. 2018. PMID: 29943840 Review.
Cited by
-
The rise and future of CRISPR-based approaches for high-throughput genomics.FEMS Microbiol Rev. 2024 Sep 18;48(5):fuae020. doi: 10.1093/femsre/fuae020. FEMS Microbiol Rev. 2024. PMID: 39085047 Free PMC article. Review.
-
Turning up the heat on essential E. coli genes.Mol Syst Biol. 2023 Oct 12;19(10):e11933. doi: 10.15252/msb.202311933. Epub 2023 Sep 18. Mol Syst Biol. 2023. PMID: 37718698 Free PMC article.
-
Refuse in order to resist: metabolic bottlenecks reduce antibiotic susceptibility.Mol Syst Biol. 2025 Mar;21(3):211-213. doi: 10.1038/s44320-025-00089-2. Epub 2025 Feb 18. Mol Syst Biol. 2025. PMID: 39966554 Free PMC article.
-
Metabolic mutations reduce antibiotic susceptibility of E. coli by pathway-specific bottlenecks.Mol Syst Biol. 2025 Mar;21(3):274-293. doi: 10.1038/s44320-024-00084-z. Epub 2025 Jan 2. Mol Syst Biol. 2025. PMID: 39748127 Free PMC article.
-
Approaches to Study Proteins Encoded by Essential Genes.Proteins. 2025 Aug 15:10.1002/prot.70039. doi: 10.1002/prot.70039. Online ahead of print. Proteins. 2025. PMID: 40817436 Review.
References
-
- Berlyn MKB (1999) CGSC: the E.coli genetic stock center database. In Bioinformatics: databases and systems, Letovsky S (ed), pp 175–183. Boston, MA: Springer US;
Grants and funding
LinkOut - more resources
Full Text Sources
Molecular Biology Databases
Research Materials

