. 2023 Nov 6;220(11):e20222105.
doi: 10.1084/jem.20222105. Epub 2023 Aug 29.

A novel molecular class that recruits HDAC/MECP2 complexes to PU.1 motifs reduces neuroinflammation

Affiliations

A novel molecular class that recruits HDAC/MECP2 complexes to PU.1 motifs reduces neuroinflammation

William T Ralvenius et al. J Exp Med. .

Abstract

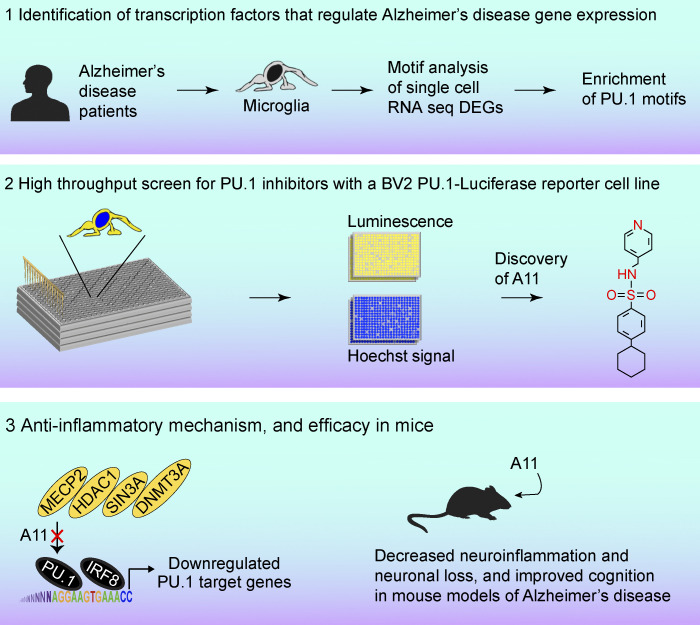
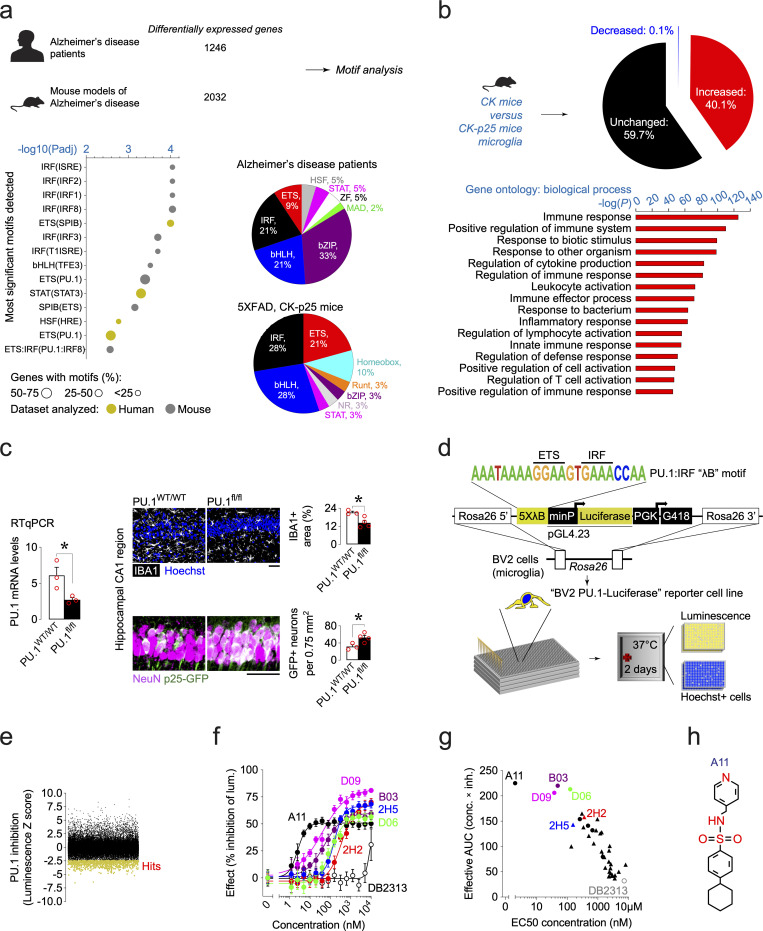
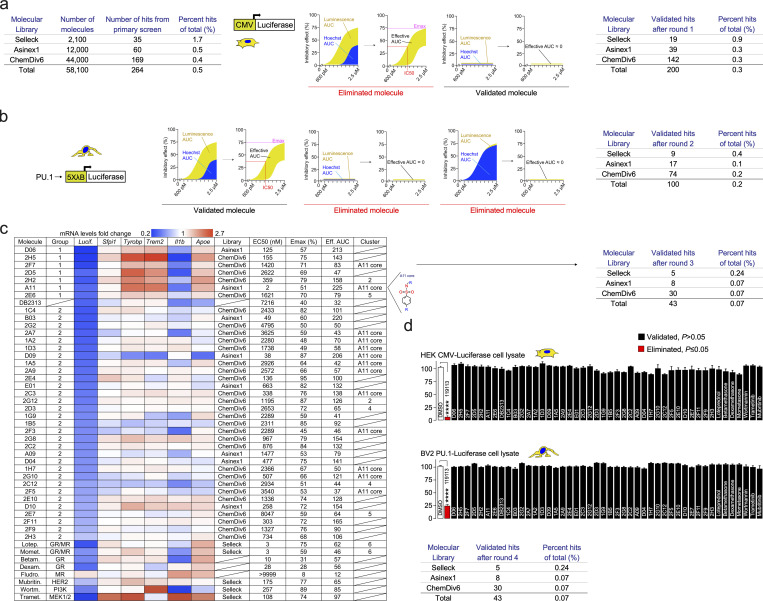
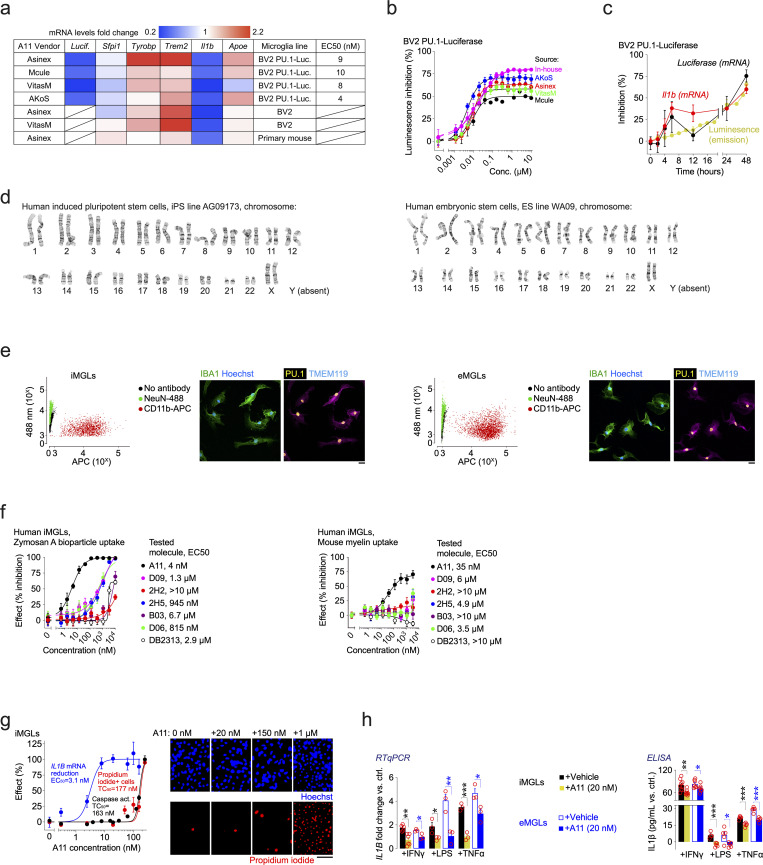
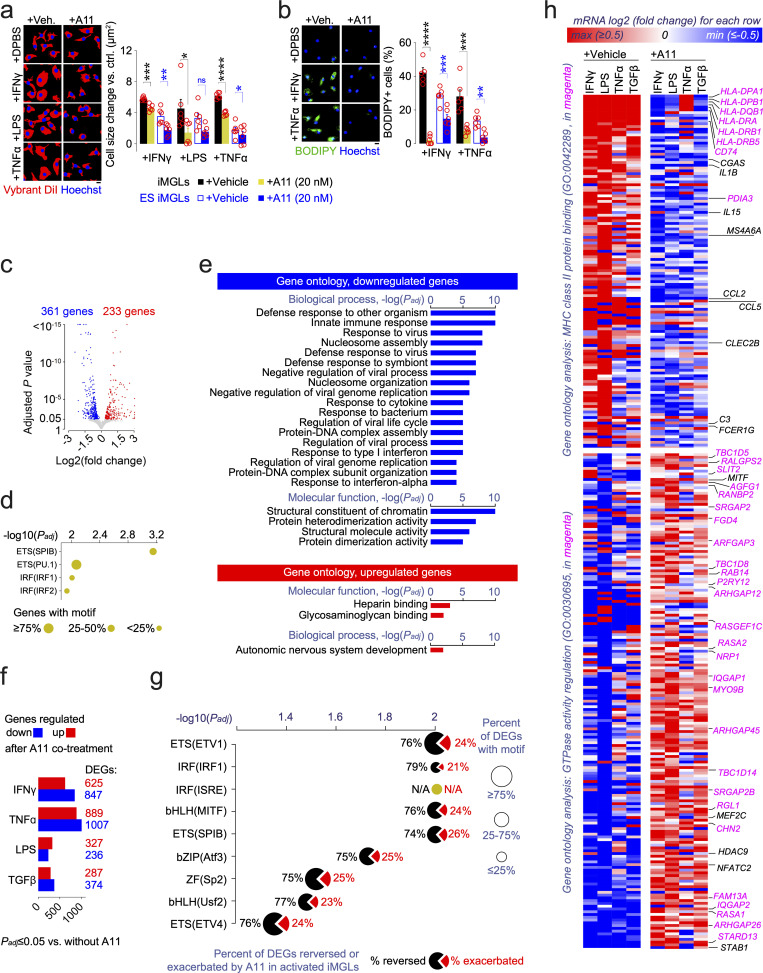
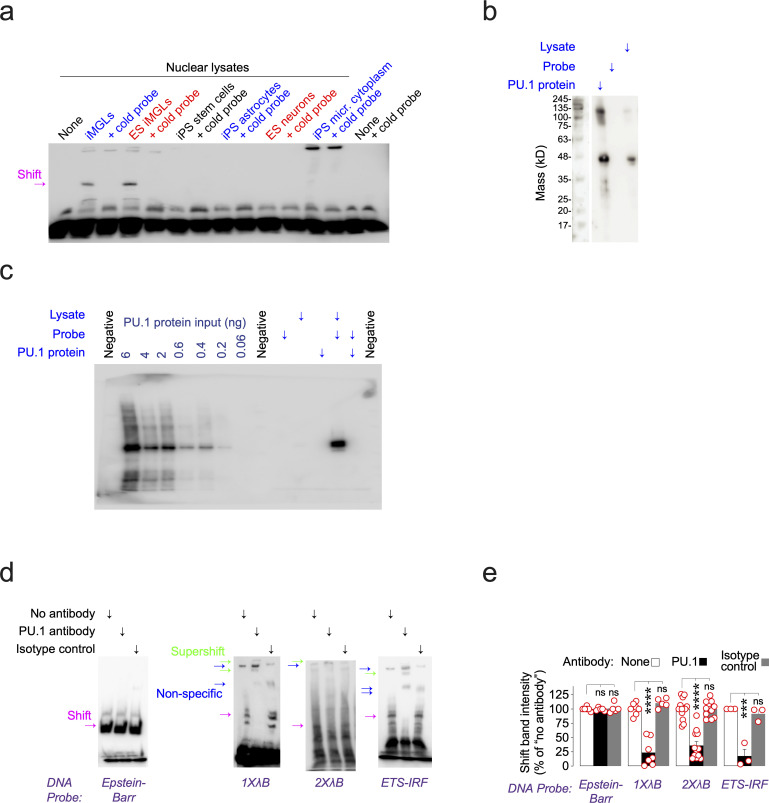
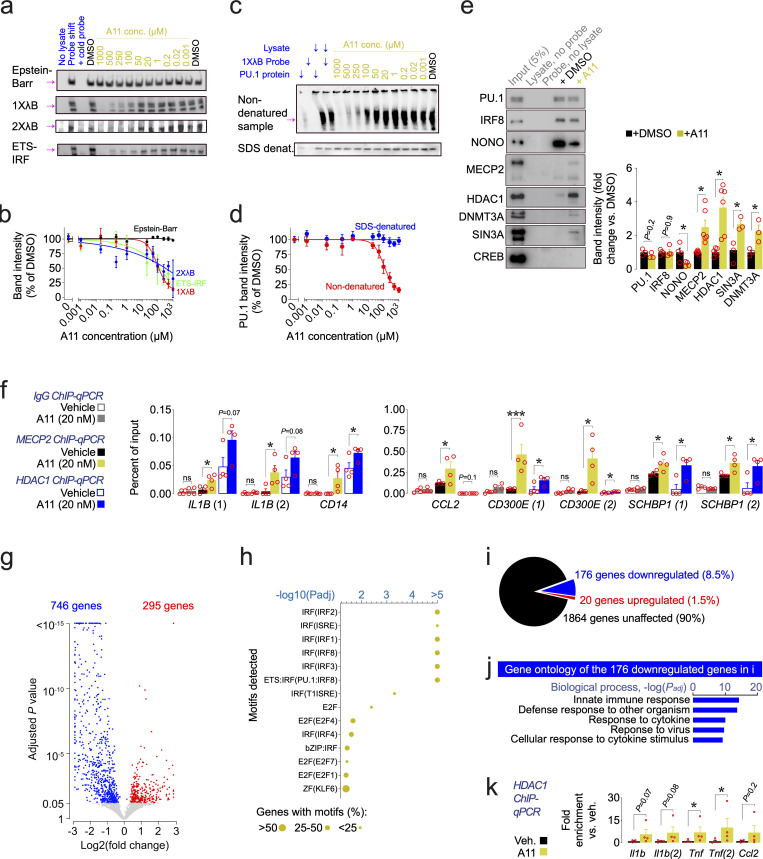
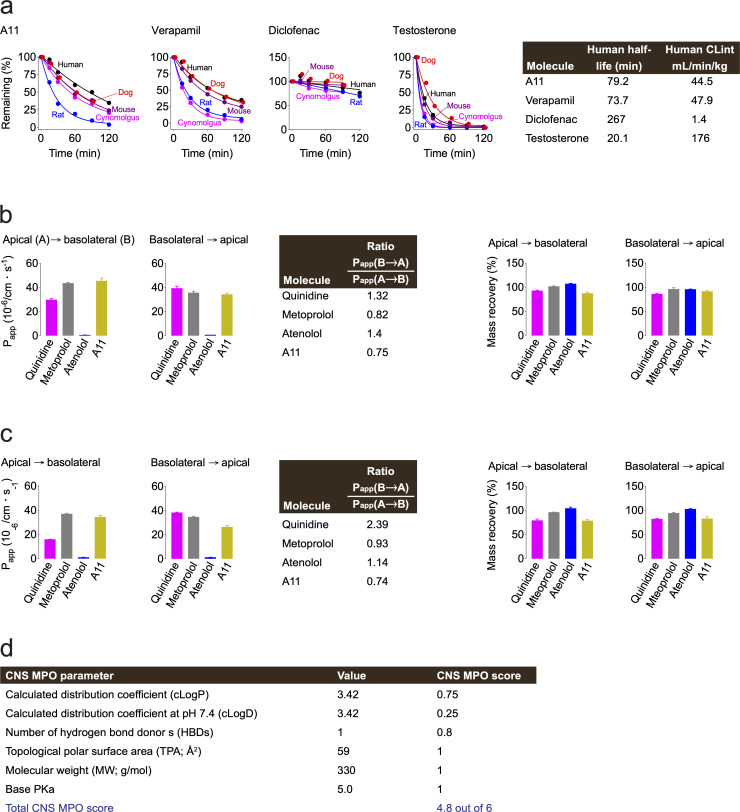
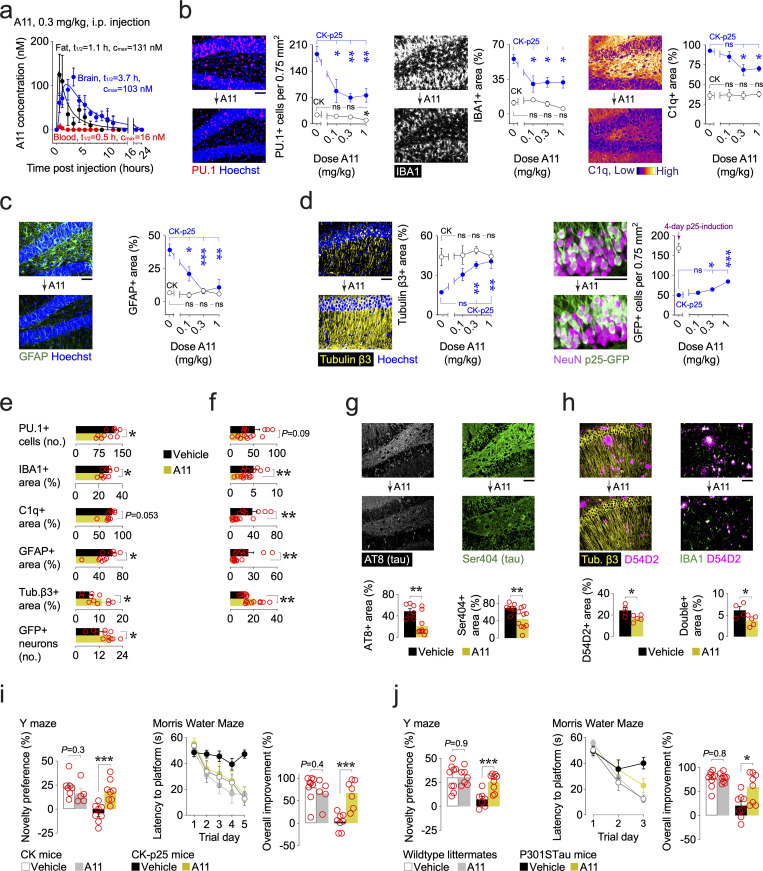
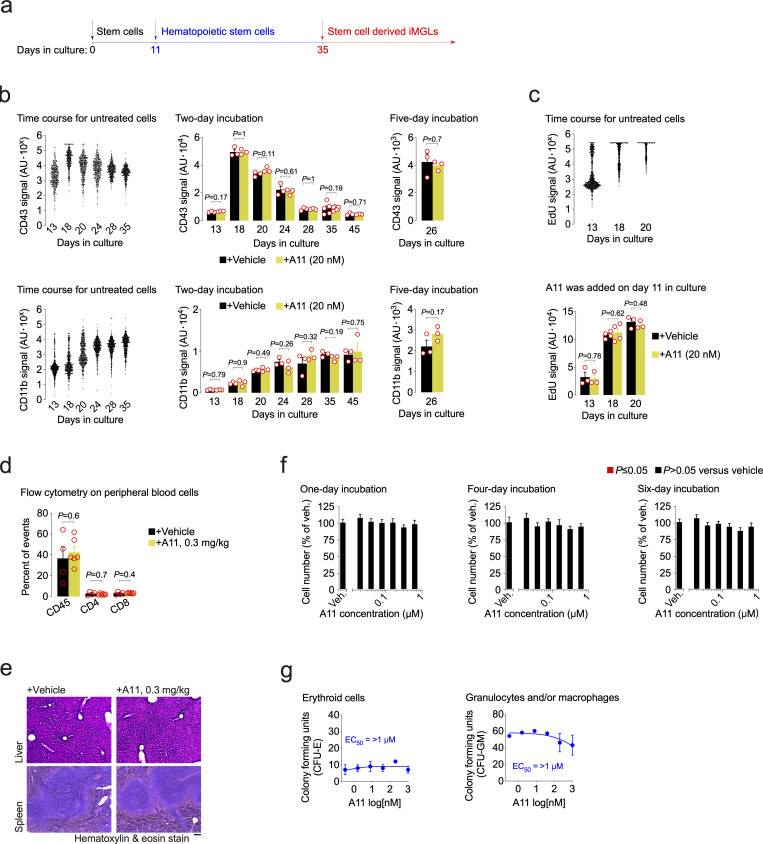
Pervasive neuroinflammation occurs in many neurodegenerative diseases, including Alzheimer's disease (AD). SPI1/PU.1 is a transcription factor located at a genome-wide significant AD-risk locus and its reduced expression is associated with delayed onset of AD. We analyzed single-cell transcriptomic datasets from microglia of human AD patients and found an enrichment of PU.1-binding motifs in the differentially expressed genes. In hippocampal tissues from transgenic mice with neurodegeneration, we found vastly increased genomic PU.1 binding. We then screened for PU.1 inhibitors using a PU.1 reporter cell line and discovered A11, a molecule with anti-inflammatory efficacy and nanomolar potency. A11 regulated genes putatively by recruiting a repressive complex containing MECP2, HDAC1, SIN3A, and DNMT3A to PU.1 motifs, thus representing a novel mechanism and class of molecules. In mouse models of AD, A11 ameliorated neuroinflammation, loss of neuronal integrity, AD pathology, and improved cognitive performance. This study uncovers a novel class of anti-inflammatory molecules with therapeutic potential for neurodegenerative disorders.


Conflict of interest statement

Disclosures: W.T. Ralvenius reported patent WO2021051016A1 for systems and assays for identifying PU.1 inhibitors. C.G. Fernandez, W.J. Ray, and A. Beckmann reported a patent to WO2022217239A1 pending. A. Goate reported personal fees from Genentech, Muna Therapeutics, VIB Leuven, and Biogen outside the submitted work. L.-H. Tsai reported a patent to US-2022-0340983-A1 pending. No other disclosures were reported.

Figures

None
Graphical abstract
Figure 1.
Figure 1.
Small molecule targeting of AD-associated transcriptional regulators in immune cells. (a) Motif analysis of published datasets of single cell or nucleus RNA sequencing using HOMER software at ± 2,000 bp from the transcription start site of DEGs detected in single cell/nucleus RNA sequencing of microglia/immune cells from human AD patients (1,246 genes) and from mouse models of AD (CK-p25 and 5XFAD mice, 2,032 genes). Circle size indicates the percentage of DEGs harboring the motif. The list shows the 14 most significant motifs. Padj represents Benjamini corrected q-values. Pie charts represent all detected motifs with a Padj ≤ 0.05 for the human (top) and mouse (bottom) datasets. (b) Top: Pie chart shows the percent of PU.1 ChIP-Seq peaks that were unchanged, decreased, or increased in hippocampal tissue of CK-p25 mice after a 6-wk p25 induction. Bottom: Gene ontology analysis of genes with increased PU.1 ChIP-Seq peaks. (c) Effect of induced PU.1 knockout in the hippocampus of 6-wk male p25-induced CK-p25 mice. Left: RT-qPCR quantification of hippocampal tissue, normalized to Actb. Right: Confocal micrographs of the hippocampal CA1 region, stained above for microglial cell bodies (IBA1) and nuclei (Hoechst) and below for neuronal nuclei (NeuN) and cell bodies of excitatory neurons (p25-GFP). Quantification to the right. n = 3 for PU.1WT/WT (CK-p25:CX3CR1CreERT2/+:PU.1WT/WT) and 4 for PU.1fl/fl (CK-p25:CX3CR1CreERT2/+:PU.1fl/fl) mice. Student’s unpaired, two-sided t test; *P ≤ 0.05, n = 4 for all conditions. Bars are mean ± SEM; each data point represents a well. Scale bar, 50 µm. (d) Illustration of the reporter construct. Insertion of five tandem tracks of the PU.1-binding motif λB (5XλB) into a pGL4.23 luciferase plasmid, subcloning into the pROSA26-1 plasmid, and integration into the Rosa26 locus of BV2 microglia. The resulting “BV2 PU.1-Luciferase” cells were plated in 384-well plates, incubated with molecules for 2 d, and then subjected to luminescence and Hoechst signal quantification. (e) Hits from the primary screen; yellow indicates a Z-score ≤ −2.5. (f) Validation of the top six hits, titrated from 600 pM to 10 µM in twelve 1:2 dilution steps. (g) Relationship between EC50 (concentration at which half-maximal luminescence inhibition occurs, calculated using Hill’s equation) and “effective AUC” (AUC for luminescence inhibition minus AUC for Hoechst signal reduction, measuring PU.1 inhibition not due to cell death). Results in this panel were repeated in three separate batches of experiments. (h) Molecular structure of the most potent hit A11.
Figure S1.
Figure S1.
Four rounds of validation applied to the hits from the primary screen. (a) Left: Table details the number of molecules, primary screen hits, and hit rate represented in Fig. 1 e, for each library included in the high-throughput drug screen. Middle: The subsequent elimination of false-positive luciferase quenchers using the HEK CMV-Luciferase cell line by calculating the effective AUC between 600 pM and 2.5 µM in twelve 1:2 dilution steps for luminescence inhibition, in the first round of validation. Molecules with a P value ≤0.05 (ANOVA, Dunnett’s post hoc test versus DMSO) were considered non-specific luciferase quenchers and were eliminated. The remaining hits are listed in the far-right table. Results in this panel were repeated in three separate batches of experiments. (b) The second round of validation based on effective AUC between 600 pM and 2.5 µM for luminescence inhibition in BV2 PU.1-Luciferase cells. Molecules with a P value ≤0.05 were considered validated for efficacy (ANOVA, Dunnett’s post hoc test versus DMSO). The remaining hits after the second round of validation are listed in the far-right table. The results in this panel were repeated in two separate batches of experiments. (c) In round 3, only molecules that reduced luciferase mRNA in BV2 PU.1-Luciferase cells in RT-qPCR experiments (P value ≤0.05, Student’s unpaired, two-sided t test versus DMSO, n ≥ 3 for all molecules) were retained. The RT-qPCR results in this panel were repeated in two separate batches of experiments. Table lists each molecule (column 1), grouped according to RT-qPCR results (column 2) with each color indicating mRNA fold change after a 2-d, 1.25-µM treatment normalized to Actb (columns 3–8). The bottom part of the table shows the hits from the Selleck library, grouped according to known mechanism of action. Columns 9–14 show originating library, EC50 (calculated using Hill’s equation), Emax (maximal percentage of luminescence inhibition), effective AUC, subdivision of molecules into clusters using maximum common substructure analysis with the Pipeline Pilot (Dassault Systèmes), respectively. Retained hits are listed in the far-right table. (d) Fourth and final validation round, testing for luminescence reduction in lysates of BV2 PU.1-Luciferase and HEK CMV-Luciferase cells with all the molecules listed in the table in panel c, using the known luciferase quencher 119113 used as the positive control. ANOVA, Dunnett’s post hoc test versus DMSO; ****P ≤ 0.0001, n ≥ 3 for all molecules. Bars are mean ± SEM. The results in this panel were repeated in two separate batches of experiments. Final results and remaining hits are shown in the bottom table.
Figure S2.
Figure S2.
Validating A11 sourced from multiple vendors, in multiple cell lines, and in time course experiments. (a) Column 1 lists the vendor of A11. (b) Columns 2–7 shows colored coding of mRNA fold change in RT-qPCR experiments after A11 treatment (2 d, 1.25 µM), normalized to Actb, in the microglial cell line listed in column 8. Column 9 lists EC50 for luminescence inhibition between 600 pM and 2.5 µM, also shown in panel b, fitted to Hill’s equation. The results in this panel were repeated in two separate batches of experiments. (c) Time course of effects of A11 for luminescence reduction and mRNA reduction of Luciferase and Il1b expression normalized to Actb. Results were repeated in two separate batches of experiments. (d) Karyotyping of the iPSC (AG09173) and ES line (WA09), left and right panels, respectively, obtained from two female donors. (e) Purity of microglia cultures assessed with flow cytometry on iMGLs (left panel) and ES iMGLs (right panel) for CD11b versus NeuN, as well as for microglial markers IBA1, TMEM119 and PU.1, and counterstained with Hoechst in the blue channel. Scale bar, 50 µm. Ordinate and abscissa values are defined as signals above background as determined using non-labeled negative control cells. Laser intensities were selected so that the data points of the labeled samples fall within the linear range. The results in this panel were repeated in three separate batches of experiments. (f) Titration from 600 pM to 2.5 µM in twelve 1:2 dilution steps of the top six hits: flow cytometry experiments in iMGLs measuring inhibition of uptake of either Zymosan A bioparticles (left panel) or mouse myelin (right panel) fitted to Hill’s equation. The results in this panel were repeated in three separate batches of experiments. (g) RT-qPCR experiment shows concentration-dependent efficacy of A11, as measured by IL1B mRNA reduction in iMGLs (% of maximal possible inhibition, blue line). Toxicity was measured using the caspase 3/7-Glo luminescence (black line) and propidium iodide uptake assay (red line; percent of 1-d media starved microglia in DPBS only), fitted to Hill’s equation. The right panel shows epifluorescent micrographs of iMGLs in the propidium iodide assay, counterstained with Hoechst in the blue channel. n ≥ 3 for all data points. Scale bar, 100 µm. The results in this panel were repeated in three separate batches of experiments. (h) Left: RT-qPCR for IL1B mRNA normalized to ACTB. Right: ELISA for IL1β protein in cell culture supernatant after a 2-d, 25 ng/ml treatment with either IFNγ, LPS, or TNFα in black and open blue bars for iMGLs and ES iMGLs, respectively, and in yellow and filled blue bars when co-applied with A11 treatment (20 nM), for iMGLs and ES iMGLs, respectively. Student’s unpaired, two-sided t test; ***P ≤ 0.001, **P ≤ 0.01, *P ≤ 0.05, n ≥ 3 for all data points. Bars are mean ± SEM; each data point represents a well. The results in this panel were repeated in two separate batches of experiments.
Figure 2.
Figure 2.
Functional and transcriptomic analysis of A11. (a) Left: Epifluorescence micrographs of the cellular membrane of iMGLs labeled with Vybrant DiI, counterstained with Hoechst. Effect of a 2-d treatment with DPBS (10 µl/ml) or 25 ng/ml of either IFNγ, LPS, or TNFα with co-application of vehicle or A11. Scale, bar 10 µm. Quantification: Total Vybrant-positive (red channel) surface area divided by the number of Hoechst-positive cells per field of view with the “+DPBS +Veh.” condition set as baseline (“ctrl.”). Results in this panel were repeated in two separate batches of experiments. (b) Epifluorescence micrographs of intracellular neutral lipid aggregates in iMGLs, stained with BODIPY (green channel). Effect of a 2-d treatment with DPBS (10 µl/ml) or 25 ng/ml of either IFNγ or TNFα with co-application of vehicle of A11. Scale bar, 10 µm. Quantification: percentage of cells with >2 aggregates per cell. Quantification of panels a and b: Student’s unpaired, two-sided t test; ****P ≤ 0.0001, ***P ≤ 0.001, **P ≤ 0.01, *P ≤ 0.05, n = 6 for all conditions. Bars are mean ± SEM; each data point represents a well. Results in this panel were repeated in two separate batches of experiments. (c) Volcano plot of DEGs (Padj ≤ 0.05; calculated with apeglm [Zhu et al., 2019]; bulk RNA sequencing) of iMGLs treated with A11 (20 nM, 2 d) compared to treatment with vehicle (1% DMSO in DPBS, 2 d). (d) Motif analysis of the DEGs in panel c using HOMER software ±2,000 bp from the transcription start site. Padj represents Benjamini corrected q-values. (e) Gene ontology analysis of the up- and downregulated genes from panel c with (Padj ≤ 0.05, −1 > log2(fold change) > 1) using Toppgene, accessed November 11, 2022. Padj represents Bonferroni corrected P values. (f) Bars show the number of DEGs (3,740 unique genes in total) after A11 co-treatment in cells treated with 25 ng/ml for 2 d with either IFNγ, LPS, TNFα, or TGFβ. Cut-off for inclusion was set at Padj ≤ 0.05, log2(fold change) > ±0.2. (g) Motif analysis of the 3,740 DEGs from panel f using Homer software ± 2,000 bp from the transcription start site. Padj represents Benjamini corrected q-values. Circle size indicates the percentage of DEGs harboring the motif. Circles are then subdivided into pie sections. The black and red section indicates DEGs regulated in the opposite or same direction, respectively, after A11 co-treatment with inflammatory treatment (average fold change caused by IFNγ, LPS, TNFα, or TGFβ treatment compared to co-treatment with A11). Genes were extracted from datasets with the GEO accession numbers GSM537988 (PU.1), GSM1167584 (MITF), GSM1370276 (SPIB), GSM1057024 (IRF1), GSM970261 (IRF2), GSE36030 (USF2), GSE21521 (PU.1); ENCODE accession numbers ENCFF624RGO (ENCODE, ETV4) and ENCFF444VWF (ENCODE, Sp2); and GEO accession numbers GSM558677 (ETV1) and GSE33912 (ATF3) using input files as control file when available, otherwise “blacklisted” regions were extracted from ENCODE for the relevant genome build (Amemiya et al., 2019). Cut-off for inclusion in the heat map was set at log2(fold change) > ±0.2. (h) The AD-associated genes from Fig. 1 a were compared for fold change, directionality, and gene ontology in iMGLs after treatment as in panel f. Fold change minimum and the maximum was set to ±0.5, and the color scheme is relative to each row, using the minimum and maximum values in each row to convert values to colors. Cut-off for inclusion in the heat map was set at log2(fold change) > ±0.2.
Figure S3.
Figure S3.
DNA-binding control experiments. (a) Lysates from different iPSC-derived cell types were compared on the basis of whether they could generate a shift in the EMSA. The results in this panel were repeated in two separate batches of experiments. (b) PU.1 Western blot on recombinant PU.1 protein, λB DNA probe and iMGL lysate added alone. The results in this panel were repeated in two separate batches of experiments. (c) Lanes 2–7 show the dilution of recombinant PU.1 protein loaded onto the gel, and lanes 10–14 show under what conditions the pulldown of PU.1 with the λB probe was possible. (d) EMSA experiments with the addition of PU.1 antibody, added to generate supershifts (indicated with green arrows) in instances where the shift (indicated with magenta arrows) involved PU.1 protein. Non-specific bands are indicated with blue arrows and are defined as being present in the “No antibody” and/or “Isotype control” condition. The results in this panel were repeated in three separate batches of experiments. Shifts are quantified in panel e. ANOVA, Dunnett’s post hoc test versus no antibody condition, two-sided t test; ****P ≤ 0.0001, ***P ≤ 0.001. For the Epstein-Barr probe, n = 6 (no antibody), n = 5 (PU.1 antibody), n = 5 (IgG control). For the 1XλB probe, n = 7 (no antibody), n = 7 (PU.1 antibody), n = 5 (IgG control). For the 2XλB probe, n = 14 (no antibody), n = 12 (PU.1 antibody), n = 11 (IgG control). For the ETS-IRF probe, n = 3 (no antibody), n = 3 (PU.1 antibody), n = 3 (IgG control). Bars are mean ± SEM; each data point represents a well. Source data are available for this figure: SourceData FS3.
Figure 3.
Figure 3.
Mechanism of action of A11. (a) EMSA using 20 fmol of biotinylated DNA probes, or 4 pmol non-biotinylated “cold” probes as negative control. The “Probe shift” condition of lane 2 represents the presence of lysate and biotinylated probe, whereas lane 1 lacks the lysate and lane 3 has a cold probe added in excess. Lanes 4–15 are identical to probe shift but with either DMSO or different concentrations of A11 added. Probes contained no PU.1 motif (Epstein-Barr), a single PU.1 motif (λB; sequence shown in Fig. 1 d), a double PU.1 motif (2XλB), or a previously published ETS-IRF motif (Eisenbeis et al., 1993). EMSA was repeated in four separate batches of experiments. (b) Quantification of band intensity versus DMSO, fitted to Hill’s equation. (c) Shift-western: EMSA Western blots were generated under native or SDS-denatured conditions and stained with a PU.1 antibody. Lane 1 shows only 0.5 ng of recombinant PU.1 protein. Lane 2 shows only probe. Lane 3 shows lysate and PU.1 protein. Lane 4 shows lysate and probe added. Lanes 5–15 are identical to lane 4 but with either DMSO or A11 added at different concentrations. Results in this panel were repeated in three separate batches of experiments. (d) Quantification of band intensity versus DMSO (indicated by magenta arrow for non-denatured sample), fitted to Hill’s equation. (e) Pulldown of the biotinylated λB motif using streptavidin beads, followed by SDS-denaturing before gel loading and then Western blotting with antibodies for various binding partners of PU.1. Lane 1 sample contains 5% input (iMGL lysate) only. Lane 2 sample contains iMGL lysate without biotinylated probe. Lane 3 contains biotinylated probe but no lysate. Lanes 4 and 5 contain biotinylated probe and iMGL lysates, in addition to DMSO and 500 µM A11. Band intensity quantification to the right, with DMSO set as 1. Student’s unpaired, two-sided t test. Bars are mean ± SEM; each data point represents a well. Results in this panel were repeated in three separate batches of experiments. (f) ChIP using a MECP2 antibody and HDAC1 antibody, followed by qPCR for several PU.1 target genes. (1) and (2) after the gene name denotes that two separate primer pairs used. Student’s unpaired, two-sided t test; ***P ≤ 0.001, *P ≤ 0.05, n = 4 for all conditions. Bars are mean ± SEM; each data point represents a well. (g) Volcano plot of DEGs (Padj ≤ 0.05; calculated with apeglm (bulk RNA sequencing) of mouse microglia isolated by FACS from mice treated with A11 (0.3 mg/kg intraperitoneally, every day, for 2 wk) compared to treatment with vehicle (1% DMSO in DPBS). (h) Motif analysis of the DEGs in g using HOMER software ± 2,000 bp from the transcription start site. Padj represents Benjamini corrected q-values. (i) Effect of A11 on the 2060 PU.1 target genes upregulated in CK-p25 mice (from Fig. 1 b). (j) Gene ontology analysis of the downregulated genes from panel i with (Padj ≤ 0.05, −1 > log2(fold change) > 1) using Toppgene, accessed March 4, 2023. Padj represents Bonferroni corrected P values. (k) ChIP using a HDAC1 antibody, followed by qPCR for several PU.1 target genes. (1) and (2) after the gene name denotes that two separate primer pairs are used. Student’s unpaired, two-sided t test; *P ≤ 0.05, n = 4 for all conditions. Bars are mean ± SEM; each data point represents a well. Source data are available for this figure: SourceData F3.
Figure S4.
Figure S4.
Physiochemical properties of A11. (a) Hepatocytes from different species (mouse, rat, dog, cynomolgus monkey, and human) were incubated with A11 and compared with verapamil, the slowly metabolized diclofenac and the rapidly metabolized testosterone, for 120 min. Results in this panel were repeated in two separate batches of experiments. (b) MDCK cells were used to assess the permeability of A11 with metoprolol as a highly permeable control, atenolol as lowly permeable control, and quinidine as a P-gp transporter effluxed control. All compounds were added at 5 µM for 90 min at 37°C. Papp = 100 × (VA/(area × time) × ([drug]acceptor/[drug]initial, donor) × dilution factor), where VA is the volume of the acceptor well, area is the surface area of the membrane and time is total transport time in seconds. Recovery (%) = 100 × ([total drug]donor,90min × dilution factor + [total drug]receiver,90min)/([total drug]donor,0min × dilution factor). Transepithelial/transendothelial electrical resistance value of wild-type MDCK monolayers from randomly selected wells was 1,654 ± 35 Ω × cm2 (mean ± SD). Results in this panel were repeated in two separate batches of experiments. (c) Same as in panel b but using MDR1 cells that express the P-gp transporter on the basolateral (B) side. Transepithelial/transendothelial electrical resistance value of MDR1-MDCK monolayers from randomly selected wells was 453 ± 18 Ω × cm2 (mean ± SD). Experiments were performed in duplicates. (d) CNS MPO characteristics of A11 calculated with Chemdraw (PerkinElmer). Results in this panel were repeated in two separate batches of experiments.
Figure 4.
Figure 4.
Effect of A11 in mouse models of AD-related neurodegeneration, tauopathy, and β-amyloid deposition. (a) Pharmacokinetic analysis: Wild-type mice had their blood plasma, brain (cerebral cortex), and peripheral ingual fat collected at various timepoints after injection of 0.3 mg/kg of A11. HPLC results were fitted to a log-normal distribution with half-life (t1/2) and maximal concentration (cmax) calculated with the equation: Y = (A/x)*e^(−0.5*(ln(x/GeoMean)/ln(GeoSD))^2), where x represents a time point after injection in hours. For brain, blood, and fat, A = 282.7, 9.8, and 118.1, respectively; GeoMean = 4.4, 0.7, and 2, respectively; and GeoSD = 2.6, 1.3, and 3.5, respectively. Data points represent mean ± SEM. The pharmacokinetic results were repeated in four separate batches of experiments. (b–d) CK-p25 mice induced for 2 wk were injected daily with 0.3 mg/kg A11, intraperitoneally. Confocal micrographs of the dentate gyrus of the hippocampus and signal quantification after staining for panel b microglial inflammation markers PU.1, IBA1, or C1q; (c) astroglial GFAP; and (d) neuronal Tubulin β3 (in the CA1 region), and NeuN and GFP nuclei (in the granule layer). C1q images were converted to 8-bit and colorized with the ImageJ Lookup table Fire. Nuclei were counterstained with Hoechst. Quantification shows dose-response in CK-p25 mice (blue circles) injected with either vehicle or 0.1, 0.3, or 1 mg/kg A11 (n = 4, 4, 5, 4, respectively) and in CK mice (open black circles; n = 4, 3, 4, 4, respectively). ANOVA, Dunnett’s post hoc against vehicle (“0 mg/kg”) treatment. ***P ≤ 0.001, **P ≤ 0.01, *P ≤ 0.05. Scale bar, 50 µm. Results in this panel were repeated in two separate batches of experiments. (e and f) Quantification of the markers as described in panel c for 6 wk induced CK-p25 mice, and (f) 1-yr-old P301STau mice, respectively. Student’s unpaired, two-sided t test; **P ≤ 0.01, *P ≤ 0.05, n = 8 for CK-p25 mice treated with either vehicle or A11, and n = 7 and 10 for P301STau mice treated with vehicle and A11, respectively. Bars are mean ± SEM; each data point represents a mouse. Scale bar, 50 µm. Results in this panel were repeated in two separate batches of experiments. (g) Confocal micrographs of the hippocampus of 1-yr-old P301STau mice stained for tau hyperphosphorylation with two different antibodies (the AT8 and Ser404 antibodies, left and right panel, respectively), with quantification below. Statistical test and n’s as in panel f. Scale bar, 50 µm. Results in this panel were repeated in two separate batches of experiments. (h) Confocal micrograph of the hippocampus of 1-yr-old 5XFAD mice stained for β-amyloid (using the D54D2 antibody) and microglial cell body, with quantification below, statistical test as in panel f, n = 4 for vehicle and A11-treated mice. Scale bar, 50 µm. Results in this panel were repeated in two separate batches of experiments. (i and j) Mice were injected daily, intraperitoneally, with vehicle (white and gray bars, respectively) or A11, 0.3 mg/kg (black and yellow bars, respectively) for 6 wk, showing CK-p25 mice in panel i and P301STau mice in panel j. n for (genotype, treatment) = 7 (CK, vehicle), 5 (CK, A11), 8 (CK-p25, vehicle), 8 (CK-p25, A11), and 9 (wild-type, vehicle), 9 (wild-type, A11), 8 (P301STau, vehicle), and 8 (P301STau, A11), respectively. Bar plots show from left to right: novel arm preference in the Y maze per 10-min trial, time-course of average latency in the Morris water maze required to locate a submerged platform (mean of three 1-min trials) over several consecutive days, quantification of percent improvement in the Morris water maze from first to last day. In every graph, Student’s unpaired, two-sided t test was performed between vehicle and A11 treatment; bars represent mean ± SEM, and each data point represents a mouse. ***P ≤ 0.001, **P ≤ 0.01, *P ≤ 0.05. Results in this panel were repeated in two separate batches of experiments.
Figure S5.
Figure S5.
Assessment of human iPSC-derived hematopoietic stem cells and iMGLs, hematological side effects of A11 in C57BL/6J mice, human hematopoietic stem cells (line AG09173) and in human bone marrow–derived cells. (a) Differentiation protocol for the generation of iMGLs out of hematopoietic stem cells derived from human stem cells. (b) Flow cytometry experiments. The top panel shows results for CD43, and the bottom panel shows results for the CD11b signal. The left panel shows time course for untreated hematopoietic stem cells, y axis is in log scale, n = 418 and 630 per day in culture for CD43 and CD11b, respectively. The middle panel shows the CD43 signal in the vehicle (black bars) and A11-treated (2 d, 20 nM; yellow bars) hematopoietic stem cells. Y axis is in linear scale. Student’s unpaired, two-sided t test; n = 3 for all conditions (except, n = 5 for CD43 at day 35). Bars are mean ± SEM; each data point represents a well. The far-right panel shows the effect of a 5-d incubation with A11, starting on the 21st day in culture. Results in this panel were repeated in two separate batches of experiments. (c) The left panel shows the time course for untreated hematopoietic stem cells; y axis is in log scale; n = 1,000 per day in culture. The right panel shows EdU signal in vehicle (black bars) and A11-treated (2 d, 20 nM; yellow bars) hematopoietic stem cells, with EdU and either A11 or vehicle added on day 11 in culture. Y axis is in linear scale. Student’s unpaired, two-sided t test; n = 3, 4, 3 for days 13, 18, and 20 in culture, respectively. Bars are mean ± SEM; each data point represents a well. Results in this panel were repeated in two separate batches of experiments. (d) Flow cytometry on blood obtained by decapitation from C57BL/6J mice injected for 6 wk with either vehicle or A11, using the markers CD45, CD4, and CD8. Student’s unpaired, two-sided t test; n = 4 for vehicle (black bars) and n = 5 for A11 (yellow bars). Bars are mean ± SEM; each data point represents a mouse. Results in this panel were repeated in two separate batches of experiments. (e) 40 µm sections of liver and spleen from the mice in panel d, stained with hematoxylin and eosin. Scale bar, 50 µm. (f) A11 was incubated at concentrations between 20 nM and 1 µM in five 1:2 dilution steps in stem cell derived hematopoietic stem cells (bottom panel; n = 12, 7, 14 per bar for 1, 4 and 6-d incubation, respectively). Red bar color would indicate P ≤ 0.05, ANOVA followed by Dunnett’s post hoc test versus vehicle, no red bars are present due to lack of significant effect. Bars are mean ± SEM. Results in this panel were repeated in two separate batches of experiments. (g) CFUs of human bone marrow–derived erythroid cells (left panel) and granulocytes and macrophages right (panel). Curves were fitted with Hill’s equation. Results in this panel were repeated in two separate batches of experiments.

Similar articles

Cited by

References

    1. Alexianu, M.E., Kozovska M., and Appel S.H.. 2001. Immune reactivity in a mouse model of familial ALS correlates with disease progression. Neurology. 57:1282–1289. 10.1212/WNL.57.7.1282 - DOI - PubMed
    1. Alzheimer, A. 1907. Über eine eigenartige Erkrankung der Hirnrinde. Allg. Zeitschr. Psychiatr. 64:146–148.
    1. Alzheimer’s Association . 2014. 2014 Alzheimer’s disease facts and figures. Alzheimers Dement. 10:e47–e92. 10.1016/j.jalz.2014.02.001 - DOI - PubMed
    1. Amemiya, H.M., Kundaje A., and Boyle A.P.. 2019. The ENCODE blacklist: Identification of problematic regions of the genome. Sci. Rep. 9:9354. 10.1038/s41598-019-45839-z - DOI - PMC - PubMed
    1. Antony-Debré, I., Paul A., Leite J., Mitchell K., Kim H.M., Carvajal L.A., Todorova T.I., Huang K., Kumar A., Farahat A.A., et al. . 2017. Pharmacological inhibition of the transcription factor PU.1 in leukemia. J. Clin. Invest. 127:4297–4313. 10.1172/JCI92504 - DOI - PMC - PubMed

Publication types