. 2023 Oct 2;220(10):e20230104.
doi: 10.1084/jem.20230104. Epub 2023 Aug 29.

EEF2-inactivating toxins engage the NLRP1 inflammasome and promote epithelial barrier disruption

Affiliations

EEF2-inactivating toxins engage the NLRP1 inflammasome and promote epithelial barrier disruption

Miriam Pinilla et al. J Exp Med. .

Abstract

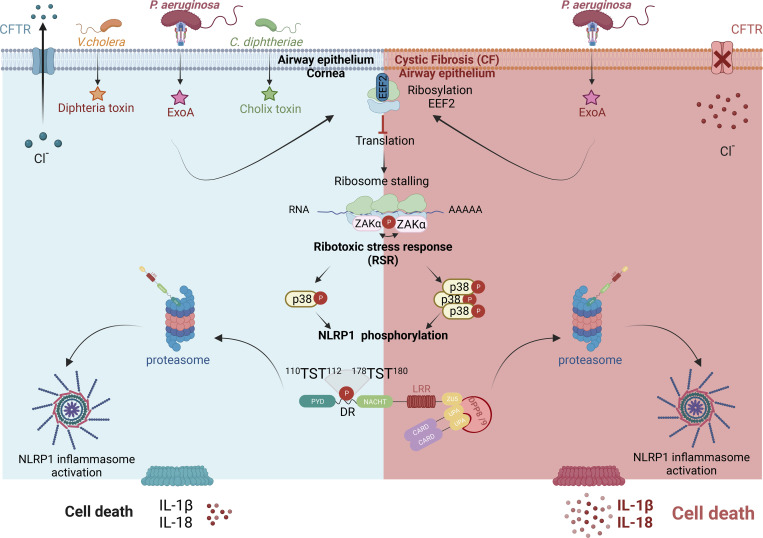
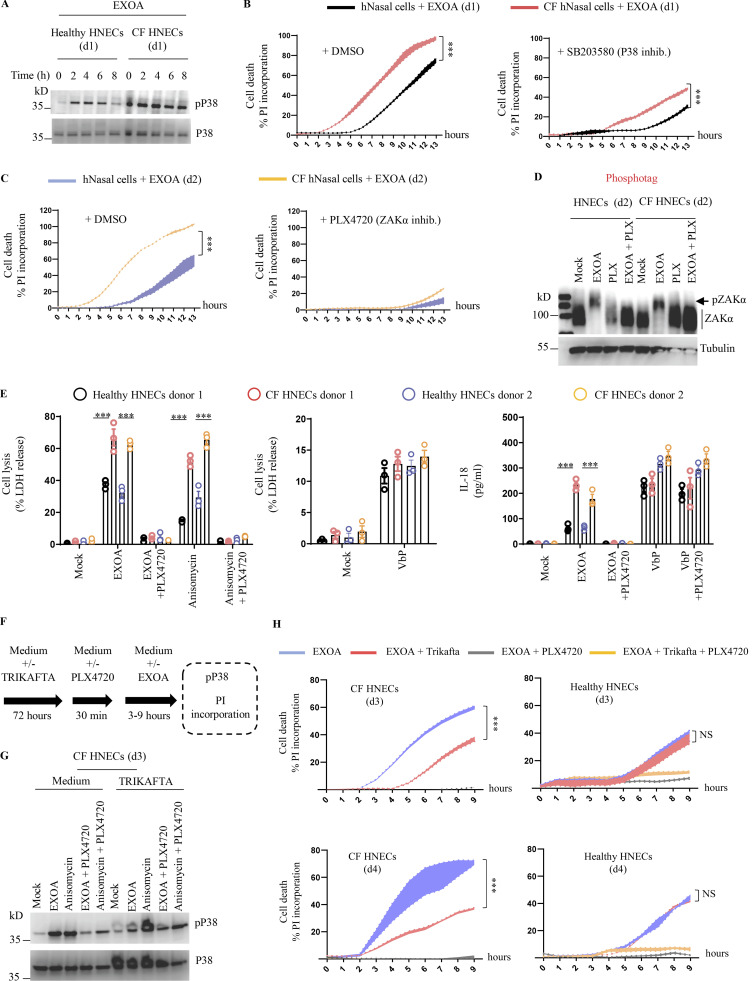
Human airway and corneal epithelial cells, which are critically altered during chronic infections mediated by Pseudomonas aeruginosa, specifically express the inflammasome sensor NLRP1. Here, together with a companion study, we report that the NLRP1 inflammasome detects exotoxin A (EXOA), a ribotoxin released by P. aeruginosa type 2 secretion system (T2SS), during chronic infection. Mechanistically, EXOA-driven eukaryotic elongation factor 2 (EEF2) ribosylation and covalent inactivation promote ribotoxic stress and subsequent NLRP1 inflammasome activation, a process shared with other EEF2-inactivating toxins, diphtheria toxin and cholix toxin. Biochemically, irreversible EEF2 inactivation triggers ribosome stress-associated kinases ZAKα- and P38-dependent NLRP1 phosphorylation and subsequent proteasome-driven functional degradation. Finally, cystic fibrosis cells from patients exhibit exacerbated P38 activity and hypersensitivity to EXOA-induced ribotoxic stress-dependent NLRP1 inflammasome activation, a process inhibited by the use of ZAKα inhibitors. Altogether, our results show the importance of P. aeruginosa virulence factor EXOA at promoting NLRP1-dependent epithelial damage and identify ZAKα as a critical sensor of virulence-inactivated EEF2.


Conflict of interest statement

Disclosures: The authors declare no competing interests exist.

Figures

None
Graphical abstract
Figure 1.
Figure 1.
P. aeruginosa triggers human NLRP1 inflammasome activation in corneal and nasal epithelial cells. (A) Cell lysis (LDH) and IL-1β/IL-18 release evaluation in pHCECs and pHNECs upon P. aeruginosa (PAO1, 1.105 bacteria) co-culture for 24 h. When specified, the pan Caspase inhibitor (Z-VAD, 20 µM), Caspase-1 inhibitor (Z-YVAD, 20 µM), Caspase-3/7 inhibitor (Z-DEVD, 20 µM), and Caspase-8 inhibitor (Z-IETD, 20 µM) were used. ***P ≤ 0.001, two-way ANOVA with multiple comparisons. Values are expressed as mean ± SEM. Graphs show one experiment performed in triplicates at least three times. (B) Immunoblotting examination of NLRP1, NLRP3, and Tubulin in resting, PAO1-exposed as in A or LPS-primed pHCECs and pHNECs or in pHCECs and pHNECs genetically invalidated for NLRP1 using CRISPR-Cas9. PMA (100 µg/ml)- or LPS (100 ng/ml)-primed THP1 monocytic cell line was used as a positive control for NLRP3 expression. Immunoblots show lysates from one experiment performed three times. (C) Florescence microscopy and associated quantifications of ASC-GFP specks in A549NLRP1+/ASC-GFP and A549NLRP1−/ASC-GFP reporter cell lines exposed to P. aeruginosa (PAO1, 1.105 bacteria) for 24 h. ASC-GFP (green) pictures were taken in the dish after the infection. Images shown are from one experiment and are representative of n = 3 independent experiments; scale bars, 10 µm. ASC complex percentage was performed by determining the ratios of cells positive for ASC speckles on the total nuclei (Hoechst). At least 10 fields from each experiment were analyzed. Values are expressed as mean ± SEM. ***P ≤ 0.001, one-way ANOVA. (D) Immunoblotting characterization of genetic invalidation of NLRP1 in pHCECs and pHNECs population using CRISPR-Cas9 and microscopy visualization of plasma membrane permeabilization (PI incorporation, orange) in pHCECs co-cultured with PAO1 (1.105 bacteria) for 24 h. (E) sgRNA CD8 (SgCD8) was used as control and served as WT cells during subsequent experiments described in E. Images shown are from one experiment and are representative of n = 3 independent experiments; scale bars, 20 µm. Cell lysis (LDH), IL-18 release, and CFU evaluation in WT (SgCD8, D) or NLRP1-deficient pHCECs and pHNECs, upon VbP (15 µM) treatment or P. aeruginosa (PAO1, 1.105 bacteria) co-culture for 24 h. For CFU analysis 1 × 10⁴ (MOI 1) or 1 × 10⁵ (MOI 10) bacteria were used. ***P ≤ 0.001, two-way ANOVA with multiple comparisons. Values are expressed as mean ± SEM. Graphs show one experiment performed in triplicates at least three times. Source data are available for this figure: SourceData F1.
Figure S1.
Figure S1.
P. aeruginosa–activated hNLRP1 inflammasome requires proteasome activity. (A) Fluorescence microscopy and associated quantifications of ASC-GFP specks in A549NLRP1+/ASC-GFP reporter cell lines exposed to 1 × 10⁵ P. aeruginosa clinical isolates from patients with infected lung (strains 3039 1533 and 2348 4390) or with infected cornea (strain 0236 1921) for 24 h. ASC-GFP (green) pictures were taken in the dish after infection. Images shown are from one experiment and are representative of n = 3 independent experiments; scale bars, 10 µm. ASC complex percentage was performed by determining the ratios of cells positive for ASC speckles on the total nuclei (Hoechst). At least 10 fields from each experiment were analyzed. Values are expressed as mean ± SEM. One-way ANOVA. (B) Schematic drawing of P. aeruginosa co-culture experiments performed with human corneal epithelial cells. (C) Immunoblotting of NLRP1, Gasdermin-D, and Tubulin in pHCECs upon VbP (15 µM) treatment or P. aeruginosa (PAO1, 1.105 bacteria) co-culture for 24 h in presence/absence of proteasome inhibitor bortezomib. Immunoblots show lysates from one experiment performed at least three times. (D) Cell lysis (LDH) and IL-1B release evaluation in pHCECs and pHNECs, upon VbP (15 µM) treatment or P. aeruginosa (PAO1, 1.105 bacteria) co-culture for 24 h in presence/absence of proteasome inhibitor bortezomib. ***P ≤ 0.001, two-way ANOVA with multiple comparisons. Values are expressed as mean ± SEM from one experiment (in triplicate) performed at least three times. Source data are available for this figure: SourceData FS1.
Figure 2.
Figure 2.
P. aeruginosa EEF2-inactivating EXOA promotes NLRP1 inflammasome response. (A) Florescence microscopy and associated quantifications of ASC-GFP specks in A549NLRP1+/ASC-GFP reporter cell lines exposed to 1 × 10⁵ P. aeruginosa (PAO1) and associated isogenic mutants for various secretion systems (PAO1ΔT3SS, PAO1ΔT2SS, PAO1ΔT1SS) for 24 h. ASC-GFP (green) pictures were taken in the dish after infection. Images shown are from one experiment and are representative of n = 3 independent experiments; scale bars, 10 µm. ASC complex percentage was performed by determining the ratios of cells positive for ASC speckles on the total nuclei (Hoechst). At least 10 fields from n = 3 independent experiments were analyzed. Values are expressed as mean ± SEM. ***P ≤ 0.001, one-way ANOVA. (B) Florescence microscopy and associated quantifications of ASC-GFP specks in A549NLRP1+/ASC-GFP reporter cell lines exposed to 1 × 10⁵ P. aeruginosa (PAO1) and associated isogenic mutants for various T2SS virulence effectors (PAO1ΔPLCN, PAO1ΔPLCH, PAO1ΔLASB, and PAO1ΔEXOA) for 24 h. ASC-GFP (green) pictures were taken in the dish after infection. Images shown are from one experiment and are representative of n = 3 independent experiments; scale bars, 10 µm. ASC complex percentage was performed by determining the ratios of cells positive for ASC speckles on the total nulcei (Hoechst). At least 10 fields from n = 3 independent experiments were analyzed. Values are expressed as mean ± SEM. ***P ≤ 0.001, one-way ANOVA. (C) Florescence microscopy and associated quantifications of ASC-GFP specks in A549NLRP1+/ASC-GFP reporter cell lines exposed to EXOA (10 ng/ml) or its catalytically dead mutant EXOAH426A (500 ng/ml) for 10 h. ASC-GFP (green) pictures were taken in the dish after toxin exposure. Images shown are from one experiment and are representative of n = 3 independent experiments; scale bars, 10 µm. ASC complex percentage was performed by determining the ratios of cells positive for ASC speckles (green, GFP) on the total nuclei (Hoechst). At least 10 fields from n = 3 independent experiments were analyzed. Values are expressed as mean ± SEM. ***P ≤ 0.001, one-way ANOVA. (D) Schematic mechanism of P. aeruginosa EXOA and related toxins at mediating EEF2 ribosylation and inactivation and subsequent ribosome inactivation. (E) Immunoblotting characterization of genetic invalidation of DPH1 in A549NLRP1+/ASC-GFP cells using CRISPR-Cas9. The red arrow shows the selected KO cells for subsequent experiments. (F) Fluorescence microscopy and associated quantifications of ASC-GFP specks in A549NLRP1+/ASC-GFP and A549NLRP1+/ASC-GFP/DPH1− reporter cell lines exposed to VbP (15 µM), EXOA (10 ng/ml), cholix toxin (CT, 10 ng/ml), and diphtheria toxin (DT, 20 ng/ml) for 10 h. ASC-GFP (green) pictures were taken in the dish after toxin exposure. Images shown are from one experiment and are representative of n = 3 independent experiments; scale bars, 10 µm. ASC complex percentage was performed by determining the ratios of cells positive for ASC speckles (green, GFP) on the total nuclei (Hoechst). At least 10 fields from n = 3 independent experiments were analyzed. Values are expressed as mean ± SEM. ***P ≤ 0.001, one-way ANOVA. (G) Plasma membrane permeabilization determination over time using PI incorporation in WT or NLRP1-deficient pHCECs exposed to VbP (15 µM), EXOA (10 ng/ml) or EXOAH426A (10 ng/ml) for indicated times. ***P ≤ 0.001, T test. Values are expressed as mean ± SEM from one experiment (in triplicate) performed at least three times. Source data are available for this figure: SourceData F2.
Figure S2.
Figure S2.
Multiple EEF2-targeting toxins activate the hNLRP1 inflammasome in a ZAKα-dependent manner. (A) Schematic mechanism of EXOA and related toxin-mediated translation inhibition. tRNA, transfer RNA; E, exit; P, peptidyl; A, aminoacyl. (B) Determination of ribosome inactivation in A549NLRP1+/ASC-GFP and A549NLRP1−/ASC-GFP reporter cell lines exposed to EXOA (10 ng/ml) for 2 and 6 h by measuring ribosome polysome accumulation and puromycin incorporation. Images are representative of one experiment performed at least three times. (C) Immunoblotting of ADP-ribosylated proteins, EEF2, and Tubulin in A549NLRP1+/ASC-GFP cell lysates treated or not with VbP (15 µM) or EXOA (10 ng/ml) in the presence of Nicotinamide adenine dinucleotide-Biotin (NAD-Biot). Immunoblots show lysates from one experiment performed at least three times. (D) Immunoblotting of NLRP1, Tubulin, and phosphorylated P38 and JNK in A549NLRP1+ and A549NLRP1− reporter cell lines exposed or not to EXOA (10 ng/ml) or its inactive mutant EXOAH426A for 3 h. Immunoblots show lysates from one experiment performed at least three times. (E) Immunoblotting characterization of genetic invalidation of P38α and P38β in A549NLRP1+/ASC-GFP cells using CRISPR-Cas9. Immunoblots show lysates from one experiment performed at least three times. (F) Fluorescence microscopy of ASC-GFP specks in A549NLRP1+/ASC-GFP and A549NLRP1+/ASC-GFP/ZAKα- reporter cell lines expressing hACE2 infected for 24 h with various SARS-CoV-2 MOI. ASC-GFP (green) pictures were taken in the dish after viral infection. Images shown are from one experiment and are representative of n = 3 independent experiments; scale bars, 10 µm. Source data are available for this figure: SourceData FS2.
Figure 3.
Figure 3.
EEF2 inactivation drives ZAKα and P38 MAPK activation and subsequent NLRP1 inflammasome nucleation. (A) Immunoblotting of P38, JNK, ZAKα, NLRP1, Tubulin, and phosphorylated P38 and JNK in A549NLRP1+ and A549NLRP1+/ZAKα- reporter cell lines exposed or not to EXOA (10 ng/ml) for 3 h. Immunoblots show lysates from one experiment performed at least three times. (B) Cell lysis (LDH release), florescence microscopy, and associated quantifications of ASC-GFP specks in A549NLRP1+/ASC-GFP and A549NLRP1+/ASC-GFP/ZAKα- reporter cell lines exposed to EXOA (10 ng/ml) for 10 h. ASC-GFP (green) pictures were taken in the dish after toxin exposure. Images shown are from one experiment and are representative of n = 3 independent experiments; scale bars, 10 µm. ASC complex percentage was performed by determining the ratios of cells positives for ASC speckles (green, GFP) on the total nuclei (Hoechst). At least 10 fields from n = 3 independent experiments were analyzed. Values are expressed as mean ± SEM. ***P ≤ 0.001, one-way ANOVA. Graphs show one experiment performed in triplicates at least three times. (C) Cell lysis (LDH release), fluorescence microscopy, and associated quantifications of ASC-GFP specks in A549NLRP1+/ASC-GFP and A549NLRP1+/ASC-GFP/P38α/β- reporter cell lines exposed to EXOA (10 ng/ml) for 10 h. ASC-GFP (green) pictures were taken in the dish after toxin exposure. Images shown are from one experiment and are representative of n = 3 independent experiments; scale bars, 50 µm. ASC complex percentage was performed by determining the ratios of cells positive for ASC speckles (green, GFP) on the total nuclei (Hoechst). At least 10 fields from n = 3 independent experiments were analyzed. Values are expressed as mean ± SEM. ***P ≤ 0.001, one-way ANOVA. Graphs show one experiment performed in triplicate at least three times. (D) Western blot examination of NLRP1 using an anti-NLRP1 N-terminal antibody (aa 1–323) in A549ASC-GFP reporter cells reconstituted with hNLRP1 or hNLRP1 plasmid constructs mutated for 112TST114/112AAA114 or 178TST180/178AAA180 after 4 h exposure to EXOA (10 ng/ml) or VbP (15 µM). Images shown are from one experiment and are representative of n = 3 independent experiments. (E) Cell lysis (LDH release), fluorescence microscopy, and associated quantifications of ASC-GFP specks in A549ASC-GFP reporter cells reconstituted with hNLRP1 or hNLRP1 plasmid constructs mutated for 112TST114/112AAA114 or 178TST180/178AAA180 after 10 h exposure to EXOA (10 ng/ml) or VbP (15 µM). ASC-GFP (green) pictures were taken in the dish after toxin exposure. Images shown are from one experiment and are representative of n = 3 independent experiments; scale bars, 10 µm. ASC complex percentage was performed by determining the ratios of cells positive for ASC speckles (green, GFP) on the total nuclei (Hoechst). At least 10 fields from n = 3 independent experiments were analyzed. Values are expressed as mean ± SEM. ***P ≤ 0.001, two-way ANOVA with multiple comparisons. Graphs show one experiment performed in triplicate at least three times. Source data are available for this figure: SourceData F3.
Figure S3.
Figure S3.
CF cells show exacerbated sensitivity to undergo cell death upon ribotoxic stress. (A) Information regarding healthy and CF patient samples used in this study. (B) Immunoblotting of NLRP1, Gasdermin-D (GSDMD), and Tubulin in pHNECsWT and pHNECsCF from healthy (WT) and CF patients exposed to EXOA (10 ng/ml) or not for 12 h in presence or absence of PLX420 (ZAKα inhibitor, 10 µM). Immunoblots show combined supernatants and lysates from one experiment performed at least three times. (d2) stands for donor 2 from CF or healthy (WT) patients. Immunoblots show lysates from one experiment performed at least two times. (C) IL-18 release in pHNECsWT and pHNECsCF co-cultured with PAO1 or PAO1ΔEXOA (1.105 bacteria) for 24 h. ***P ≤ 0.001, T test. Values are expressed as mean ± SEM from one experiment (in triplicate) from one independent donor (d2, CFd2) performed at least three times. (D) IL-18 release evaluation in pHNECsWT and pHNECsCF upon EXOA (10 ng/ml), treatment for 18 h in presence/absence of Bortezomib (Bort., proteasome inhibitor, 1 µM) or MCC950 (NLRP3 inflammasome inhibitor, 10 µM). ***P ≤ 0.001, T test. Values are expressed as mean ± SEM from one experiment (in triplicate) from one independent donor (d2, CFd2) performed at least two times. (E) Fluorescence microscopy of PI (red) incorporation into pHNECWT (donor 2) and pHNECCF (donor 1) after exposure to anisomycin or EXOA for 16 h in presence or not of the ZAKα inhibitor PLX4720 (10 µM). Images shown are from one experiment and are representative of n = 3 independent experiments; scale bars, 50 µm. Source data are available for this figure: SourceData FS3.
Figure 4.
Figure 4.
CF airway epithelial cells show exacerbated sensitivity to EXOA-driven pyroptosis, which is reversed by ZAKα inhibition. (A) Immunoblotting of P38 and phosphorylated P38 in pHNECsWT and pHNECsCF from healthy (WT) and CF patients exposed to EXOA (10 ng/ml) or not for 8 h. Immunoblots show lysates from one experiment performed at least two times. (d1) stands for donor 1 from CF or healthy (WT) patients. Images shown are from one experiment and are representative of n = 2 independent experiments. (B and C) Plasma membrane permeabilization determination over time using PI incorporation in pHNECsWT or pHNECsCF exposed to EXOA (10 ng/ml) for indicated times. When specified, SB203580, an inhibitor of P38 activity (10 µM) or PLX420 (bRaf, ZAKα inhibitor, 10 µM) were used. (d1) and (d2) stand for donors 1 or 2, respectively. ***P ≤ 0.001, T test. Values are expressed as mean ± SEM from one experiment (in triplicate) from one independent donor (d1/d2, CFd1/CFd2) performed at least three times. (D) Phosphotag blotting of phosphorylated ZAKα in pHNECsWT and pHNECsCF from healthy (WT) and CF patients exposed to EXOA (10 ng/ml) or not for 8 h. When specified, PLX420 (bRaf, ZAKα inhibitor, 10 µM) was used. Immunoblots show lysates from one experiment performed at least two times. (d2) stands for donor 2 from CF or healthy (WT) patients. Images shown are from one experiment and are representative of n = 3 independent experiments. (E) Cell lysis (LDH) and IL-18 release evaluation in pHNECsWT and pHNECsCF upon EXOA (10 ng/ml), anisomycin (1 µg/ml), or VbP (15 µM) treatment for 18 h in presence/absence of PLX420 (ZAK inhibitor, 10 µM). ***P ≤ 0.001, T test. Values are expressed as mean ± SEM from one experiment (in triplicate) from one independent donor (d1/d2, CFd1/CFd2) performed at least three times. (F) Graphical representation of CFTR correctors Ivacaftor (10 µM), Tezacaftor (10 µM), and Elexacaftor (5 µM) (TRIKAFTA) treatment to CF cells. (G) Immunoblotting of P38 and phosphorylated P38 in pHNECsCF treated or not for 72 h with TRIKAFTA and exposed to EXOA (10 ng/ml) or anisomycin (1 µg/ml) for 6 h. Immunoblots show lysates from one experiment performed at least two times. When specified, PLX420 (bRaf, ZAKα inhibitor, 10 µM) was used. Immunoblots show lysates from one experiment performed at least two times. (d3) stands for donor 3 from CF patients. (H) Plasma membrane permeabilization determination over time using PI incorporation in pHNECs or pHNECsCF in the presence/absence of TRIKAFTA and subsequently exposed to EXOA (10 ng/ml) for indicated times. When specified, PLX420 (bRaf, ZAKα inhibitor, 10 µM) was used. (d3) and (d4) stand for donors 3 or 4, respectively. ***P ≤ 0.001, T test. Values are expressed as mean ± SEM from one experiment (in triplicate) from one independent donor (d3/d4, CFd3/CFd4) performed at least three times. Source data are available for this figure: SourceData F4.

Comment in

References

    1. Allison, A.C. 1954. Protection afforded by sickle-cell trait against subtertian malareal infection. Br. Med. J. 1:290–294. 10.1136/bmj.1.4857.290 - DOI - PMC - PubMed
    1. Armstrong, S., and Merrill A.R.. 2004. Toward the elucidation of the catalytic mechanism of the mono-ADP-ribosyltransferase activity of Pseudomonas aeruginosa exotoxin A. Biochemistry. 43:183–194. 10.1021/bi034772u - DOI - PubMed
    1. Balakrishnan, A., Karki R., Berwin B., Yamamoto M., and Kanneganti T.D.. 2018. Guanylate binding proteins facilitate caspase-11-dependent pyroptosis in response to type 3 secretion system-negative Pseudomonas aeruginosa. Cell Death Discov. 4:3. 10.1038/s41420-018-0068-z - DOI - PMC - PubMed
    1. Bauernfried, S., Scherr M.J., Pichlmair A., Duderstadt K.E., and Hornung V.. 2021. Human NLRP1 is a sensor for double-stranded RNA. Science. 371:eabd0811. 10.1126/science.abd0811 - DOI - PubMed
    1. Bérubé, J., Roussel L., Nattagh L., and Rousseau S.. 2010. Loss of cystic fibrosis transmembrane conductance regulator function enhances activation of p38 and ERK MAPKs, increasing interleukin-6 synthesis in airway epithelial cells exposed to Pseudomonas aeruginosa. J. Biol. Chem. 285:22299–22307. 10.1074/jbc.M109.098566 - DOI - PMC - PubMed

Publication types