. 2023 Oct 9;8(19):e161563.
doi: 10.1172/jci.insight.161563.

ST6GAL1 sialyltransferase promotes acinar to ductal metaplasia and pancreatic cancer progression

Affiliations

ST6GAL1 sialyltransferase promotes acinar to ductal metaplasia and pancreatic cancer progression

Nikita Bhalerao et al. JCI Insight. .

Abstract

The role of aberrant glycosylation in pancreatic ductal adenocarcinoma (PDAC) remains an under-investigated area of research. In this study, we determined that ST6 β-galactoside α2,6 sialyltransferase 1 (ST6GAL1), which adds α2,6-linked sialic acids to N-glycosylated proteins, was upregulated in patients with early-stage PDAC and was further increased in advanced disease. A tumor-promoting function for ST6GAL1 was elucidated using tumor xenograft experiments with human PDAC cells. Additionally, we developed a genetically engineered mouse (GEM) model with transgenic expression of ST6GAL1 in the pancreas and found that mice with dual expression of ST6GAL1 and oncogenic KRASG12D had greatly accelerated PDAC progression compared with mice expressing KRASG12D alone. As ST6GAL1 imparts progenitor-like characteristics, we interrogated ST6GAL1's role in acinar to ductal metaplasia (ADM), a process that fosters neoplasia by reprogramming acinar cells into ductal, progenitor-like cells. We verified ST6GAL1 promotes ADM using multiple models including the 266-6 cell line, GEM-derived organoids and tissues, and an in vivo model of inflammation-induced ADM. EGFR is a key driver of ADM and is known to be activated by ST6GAL1-mediated sialylation. Importantly, EGFR activation was dramatically increased in acinar cells and organoids from mice with transgenic ST6GAL1 expression. These collective results highlight a glycosylation-dependent mechanism involved in early stages of pancreatic neoplasia.

Keywords: Cancer; Glycobiology; Oncogenes; Oncology.


Figures
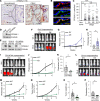
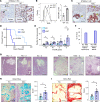
Figure 1
Figure 1. ST6GAL1 is upregulated in human PDAC and promotes tumor growth in xenograft models.
(A) ST6GAL1 IHC in normal and malignant human pancreata. Scale bar: 100 μm; original magnification, 200×. (B) PDAC specimens costained for ST6GAL1 and the Golgi marker, GM130. (C) ST6GAL1-positive cells in human pancreatic tissues. Data analyzed by a Kruskal-Wallis test with follow-up analyses. For nontumor specimens, n = 48; stage I, n = 115; stage IIA, n = 216; stage IIB, n = 48; and stage III/IV, n = 55; **P < 0.001; ****P < 0.0001. (D) ST6GAL1 upregulation in the metastatic S2-013 and S2-LM7AA subclones relative to Suit2 parental cells. (E) ST6GAL1 was overexpressed (OE) in Suit2 cells or knocked down (KD) in the S2-013 and S2-LM7AA subclones. EV, empty vector control; shC, nontargeting shRNA control. (F) Representative bioluminescence imaging (BLI) of tumors formed from Suit2 EV and OE cells implanted into the pancreas. (G) Quantification of Suit2 EV and OE tumor growth by BLI (n = 7 mice/group). Results analyzed by 2-way ANOVA. *P < 0.05. (H) Livers were extracted from Suit2 EV and OE cohorts and imaged by BLI to detect metastases (n = 7). Data analyzed using a Mann-Whitney test, *P < 0.05. (I) Representative BLI of tumors formed from S2-LM7AA shC and KD cells implanted into the pancreas. (J) Quantification of S2-LM7AA shC and KD tumor growth by BLI (n = 7 mice/group). Two-way ANOVA, *P < 0.05. (K) Quantification of liver metastases by BLI (n = 7). Mann-Whitney test, *P < 0.05. (L) Representative BLI of tumors formed from S2-013 shC and KD cells implanted into the flank. (M) Quantification by BLI of flank tumors formed from S2-013 shC and KD cells (n = 11 mice/group). Two-way ANOVA, *P < 0.05. (N) Tumor volume was calculated from caliper measurements (n = 11). Two-way ANOVA, *P < 0.05. (O) Weights of tumors extracted at the endpoint (n = 11). Mann-Whitney test, *P < 0.05. (P) BLI quantification of metastatic tumors in the lungs (n = 11). Mann-Whitney test, *P < 0.05.
Figure 2
Figure 2. KSC mice exhibit accelerated PDAC progression and mortality compared with KC mice.
(A) ST6GAL1 expression in the pancreas of SC mice (with Pdx1-Cre–driven expression of ST6GAL1), and WT mice (littermate controls expressing the LSL-ST6GAL1 transgene, but not Pdx1-Cre). Scale bar: 100 μm; original magnification, 200×. (B) Cells dissociated from WT and SC pancreata were stained with SNA to detect surface α2,6 sialylation. Left: representative experiment; right: MFI values from 3 mice/genotype. Data analyzed using a Student’s t test. *P < 0.05. (C) ST6GAL1 IHC on KC and KSC pancreata depicting strong ST6GAL1 expression in PanINs (arrows). No detectable ST6GAL1 is noted in adjacent, normal KC acinar cells, whereas ST6GAL1 is highly expressed in normal KSC acinar cells (arrowhead), reflecting transgene expression. Scale bar: 100 μm. (D) Kaplan-Meier survival analysis indicates a median survival of 4.3 months for KSC mice and 13.6 months for KC mice (n = 10 mice/group). P < 0.0001. (E) H&E-stained pancreata from 20-week-old KC and KSC mice showing the percentage of overall tissue area represented by PanINs of varying grades (n = 9 mice/group). Data analyzed using a Student’s t test. *P < 0.05. (F) Percentage of 20-week-old KC and KSC mice that present with PDAC or distal metastases (n = 9 mice/group). (G) Representative pancreatic tissues showing more advanced disease in KSC mice (images from 3 individual mice/genotype). Scale bar: 200 μm. (H) Alcian blue staining for mucinous tumor cells in 20-week-old KC and KSC pancreata (n = 9 mice/group). Staining was quantified stereologically and analyzed using a Student’s t test. *P < 0.05. Scale bar: 100 μm. (I) Sirius red staining for collagen deposition in 20-week-old KC and KSC pancreata (n = 9 mice/group). Staining was quantified stereologically and data were analyzed using a Student’s t test. *P < 0.05. Scale bar: 100 μm. KC, Pdx1-Cre LSL-KrasG12D; KSC, Pdx1-Cre LSL-ST6GAL1 LSL-KrasG12D.
Figure 3
Figure 3. RNA-Seq of GEM pancreata reveals that ST6GAL1 promotes a stem and ductal phenotype and enhances activation of EGFR and other ERBB family members.
(A) Ingenuity Pathway Analysis (IPA) of RNA-Seq data from 20-week-old SC and WT pancreata. The 5 top-scoring IPA networks altered in SC versus WT mice are shown (n = 3 mice/genotype). (B) GSEA indicates that compared with WT mice, SC mice have an upregulation in stemness networks (ESC pluripotency, Notch, Wnt, Hedgehog) as well as networks associated with a pancreatic ductal cell program and pancreatic cancer. NES and FDR values are as follows: ESC pluripotency: NES = 2.04, FDR = 0.011; Wnt: NES = 1.48, FDR = 0.103; Notch: NES = 1.70, FDR = 0.008; Hedgehog: NES = 1.89, FDR = 0.003; ductal: NES = 1.59, FDR = 0.018; pancreatic cancer: NES = 1.44, FDR = 0.135. NES, normalized enrichment score. (C) Heatmap of select genes from the pancreatic ductal network upregulated in SC mice (n = 3 mice/genotype). (D) GSEA reveals activation of EGFR and other receptor tyrosine kinases in SC mice. EGFR: NES = 2.22, FDR = 0.003; ERBB family: NES = 1.96, FDR = 0.015; ERBB2: NES = 1.96, FDR = 0.049; ERBB4: NES = 1.78, FDR = 0.023; MET: NES = 2.04, FDR = 0.010. (E) IPA of RNA-Seq data from 20-week-old KSC and KC pancreata depicting the 5 top-scoring IPA networks (n = 3 mice/genotype). (F) GSEA indicates that compared with KC mice, KSC mice have an upregulation in stemness-associated networks (ESC pluripotency, Notch, Wnt, and Hedgehog) and networks associated with a ductal phenotype and pancreatic cancer. NES and FDR values are as follows: ESC pluripotency: NES = 1.84, FDR = 0.033; Wnt: NES = 1.49, FDR = 0.123; Notch: NES = 1.38, FDR = 0.077; Hedgehog: NES = 2.09, FDR < 0.0005; ductal: NES = 1.65, FDR = 0.019; pancreatic cancer: NES = 1.26, FDR = 0.280.
Figure 4
Figure 4. Acinar cells from mice with ectopic expression of ST6GAL1 have upregulated expression of SOX9 and other ductal markers.
(A) IHC staining of pancreata from 20-week-old mice reveals SOX9 expression (arrows) in the acinar cells of SC, but not WT, mice. Scale bar: 20 μm. (B) SOX9-expressing acinar cells were quantified from IHC-stained SC and WT pancreata (n = 8 mice/genotype, with 3 tissue sections evaluated per mouse). Data analyzed using a Student’s t test. *P < 0.05. (C) IHC staining for SOX9 in pancreata from 20-week-old KC and KSC mice. “P” denotes PanINs, which are positive for SOX9. Scale bar: 100 μm; original magnification, 200×. Insets show upregulation of SOX9 (arrows) in the adjacent, normal-appearing acinar cells of KSC, but not KC, mice. (D) Quantification of SOX9-positive cells in the normal-appearing KC and KSC acinar cells (n = 8 mice/genotype, with 3 tissue sections evaluated per mouse). Data analyzed using a Student’s t test. *P < 0.05. (E) WT and SC pancreata were stained for ST6GAL1 (red) and cytokeratin 8 (KRT8, green) and counterstained with Hoechst (blue). KRT8 expression is observed in the acinar cells of SC, but not WT, mice. KRT8 is also expressed in the ductal cells of both WT and SC mice, as expected. Scale bar: 25 μm. (F) WT and SC pancreata were stained for ST6GAL1 (red) and cytokeratin 19 (KRT19, green) and counterstained with Hoechst (blue). KRT19 expression is observed in the acinar cells of SC, but not WT, mice. KRT19 is also expressed in the ductal cells of both WT and SC mice, as expected. Scale bar: 25 μm.
Figure 5
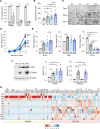
Figure 5. ST6GAL1 activity enhances the initiation and growth of GEM-derived organoids and promotes changes in gene expression consistent with a more progenitor-like state.
(A) Cells dissociated from WT organoids were seeded into either organoid (ORG) culture, which maintains stemness properties, or monolayer (ML) culture in media with reduced stem cell factors, which induces cell differentiation. qRT-PCR analyses revealed that, similar to the stemness genes Axin2 and Lgr5, endogenous St6gal1 mRNA expression is downregulated in ML cultures (n = 3). Data analyzed using a Student’s t test. *P < 0.05. qRT-PCR, quantitative reverse transcriptase PCR; RQ, relative quantification. (B) Cells were dissociated from organoid lines and 2,000 cells seeded into fresh organoid culture. The number of organoids formed at day 3 was enumerated (n = 3 independent experiments, with 3 wells per genotype counted). Data analyzed by 1-way ANOVA, *P < 0.05. (C) Cells were dissociated from organoids, then seeded into fresh organoid culture, and organoid growth was monitored over time. Scale bar: 100 μm. (D) At days 3, 6, and 9 following the seeding of 2,000 organoid-derived cells into fresh organoid culture, organoids were dissociated, and the total number of cells was quantified (n = 4). Data analyzed using a Student’s t test. *P < 0.05. (E) Sox9, Hes1, and Ptf1a mRNA was quantified by qRT-PCR (n = 3). Data analyzed by 1-way ANOVA. *P < 0.05. (F) Organoids were lysed and immunoblotted for SOX9 and ST6GAL1. Densitometric analyses were conducted on blots from 4 independent organoid lysates. Data analyzed by 1-way ANOVA. *P < 0.05. Relative D.U., densitometric units normalized to β-tubulin. (G) RNA-Seq was conducted on organoid lines generated from 3 distinct mice per genotype. The heatmap depicts canonical acinar and ductal genes. Color key indicates z score.
Figure 6
Figure 6. ST6GAL1 activity is important for a progenitor-like phenotype in KC organoids and in the 266-6 cell ADM model.
(A) KC organoids were transduced with lentivirus encoding St6gal1 shRNA (KC-KD) or a control shRNA vector (KC-shC). Knockdown of St6gal1 was verified by qRT-PCR (n = 3). Data analyzed using a Student’s t test. *P < 0.05. (B) Cells were dissociated from the KC-shC and KC-KD organoids, and 2,000 cells were seeded into fresh organoid culture. The number of organoids formed at day 3 was enumerated (n = 3 independent experiments with 3 wells counted per genotype). Data analyzed using a Student’s t test. *P < 0.05. (C) Images of the KC-shC and KC-KD organoids. Scale bar: 100 μm. (D) At days 3, 6, and 9, organoid cultures were dissociated, and the total number of cells was quantified (n = 4). Data analyzed using a Student’s t test. *P < 0.05. (E) Sox9, Hes1, and Ptf1a mRNA was quantified by qRT-PCR (n = 3). Data analyzed using a Student’s t test. *P < 0.05. (F) ST6GAL1 was overexpressed (OE) or knocked down (KD) in the 266-6 pancreatic cancer cell line (EV, empty vector control). The expression of SOX9, HES1, and PTF1A was measured by immunoblotting. Graphs depict densitometric analyses of blots from 4 independent lysates. Data analyzed using a Student’s t test. *P < 0.05.
Figure 7
Figure 7. ST6GAL1 promotes ADM in the cerulein-induced pancreatitis model.
(A) WT and SC mice were injected i.p. with saline (control) or cerulein to induce pancreatitis. Cerulein-induced damage to the pancreas was confirmed by H&E. Scale bar: 50 μm. (B) Pancreata from mice injected with saline or cerulein were evaluated for coexpression of SOX9 (green), ST6GAL1 (red), and the acinar marker, amylase (white; note that amylase is expressed throughout the cytosol, consistent with localization to zymogen granules). Nuclei were stained with Hoechst (blue). In WT mice (left panels), ADM-like cells coexpressing ST6GAL1, SOX9, and amylase were identified in the cerulein-treated, but not saline-treated, cohorts. In SC pancreata (right panels), SOX9-positive acinar cells were detected in both the saline- and cerulein-treated mice. Scale bar: 25 μm. (C) Mice injected with cerulein had increased serum amylase levels, verifying induction of pancreatitis (n = 3 mice/group). Data analyzed by 2-way ANOVA. *P < 0.05. (D) Cells were dissociated from the pancreata of WT and SC mice treated with saline or cerulein. Flow cytometry was conducted on cells stained with UEA lectin (acinar marker), anti-CD133 (ductal marker), anti-EpCAM (epithelial marker), anti-CD45 (immune marker), and Aqua live/dead stain (marker for nonviable cells). UEA and anti-CD133 staining was quantified on viable, singlet epithelial cells (EpCAM positive, CD45 negative, Aqua dye negative). Cells undergoing ADM coexpress UEA ligands and CD133. (E) Quantification of cells undergoing ADM (UEAlighi/CD133hi) in cerulein- or saline-treated mice (n = 4 mice/group). Data analyzed by 2-way ANOVA. *P < 0.05.
Figure 8
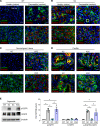
Figure 8. EGFR is activated in pancreatic tissues and organoids from mice with ectopic expression of ST6GAL1.
(A) Upper panels: Healthy (saline) and pancreatitis (cerulein) WT tissues were stained for ST6GAL1 (red) and p-EGFR (pY-1068, green). Lower panels: Tissues stained for ST6GAL1 (red) and t-EGFR (green). Nuclei were stained with Hoechst. The acinar cells of healthy WT tissues lack detectable p-EGFR, whereas weak p-EGFR staining is noted in WT ductal cells (arrow). EGFR is strongly activated in WT acinar cells in pancreatitis tissues. Furthermore, endogenous ST6GAL1 is upregulated in WT acinar cells exposed to pancreatitis. Scale bar: 25 μm. (B) Upper panels: SC healthy and pancreatitis tissues were stained for ST6GAL1 (red) and p-EGFR (pY-1068, green). Lower panels: Tissues stained for ST6GAL1 (red) and t-EGFR (green). Nuclei were stained with Hoechst. Robust expression of p-EGFR is observed in SC acinar cells in both healthy and pancreatitis tissues. Scale bar: 25 μm. (C) Upper panels: Adjacent, nonmalignant tissues from KC and KSC mice were stained for ST6GAL1 (red) and p-EGFR (green). Lower panels: Nonmalignant tissues were stained for ST6GAL1 (red) and t-EGFR (green). EGFR was activated in the nonmalignant acinar cells of KSC, but not KC, mice. Scale bar: 25 μm. (D) Upper panels: PanIN lesions were stained for ST6GAL1 (red) and p-EGFR (green). Lower panels: PanINs were stained for ST6GAL1 (red) and t-EGFR (green). EGFR was activated in the PanINs of both KC and KSC mice. Additionally, endogenous ST6GAL1 was upregulated in the PanINs of KC mice. Scale bar: 25 μm. (E) Organoid lysates were immunoblotted for p-EGFR (pY-1068) and t-EGFR. Graphs depict densitometric units (D.U.) measured on blots from 3 independent organoid lysates. D.U. were normalized to values for β-tubulin. Data analyzed by 1-way ANOVA. *P < 0.05.

Similar articles

Cited by

References

    1. Siegel RL, et al. Cancer statistics, 2021. CA Cancer J Clin. 2021;71(1):7–33. doi: 10.3322/caac.21654. - DOI - PubMed
    1. Storz P. Acinar cell plasticity and development of pancreatic ductal adenocarcinoma. Nat Rev Gastroenterol Hepatol. 2017;14(5):296–304. doi: 10.1038/nrgastro.2017.12. - DOI - PMC - PubMed
    1. Li S, Xie K. Ductal metaplasia in pancreas. Biochim Biophys Acta Rev Cancer. 2022;1877(2):188698. doi: 10.1016/j.bbcan.2022.188698. - DOI - PubMed
    1. Hezel AF, et al. Genetics and biology of pancreatic ductal adenocarcinoma. Genes Dev. 2006;20(10):1218–1249. doi: 10.1101/gad.1415606. - DOI - PubMed
    1. Halbrook CJ, et al. Pancreatic cancer: advances and challenges. Cell. 2023;186(8):1729–1754. doi: 10.1016/j.cell.2023.02.014. - DOI - PMC - PubMed

Publication types