. 2023 Oct 16;133(20):e169234.
doi: 10.1172/JCI169234.

Patient-derived enteroids provide a platform for the development of therapeutic approaches in microvillus inclusion disease

Affiliations

Patient-derived enteroids provide a platform for the development of therapeutic approaches in microvillus inclusion disease

Meri Kalashyan et al. J Clin Invest. .

Abstract

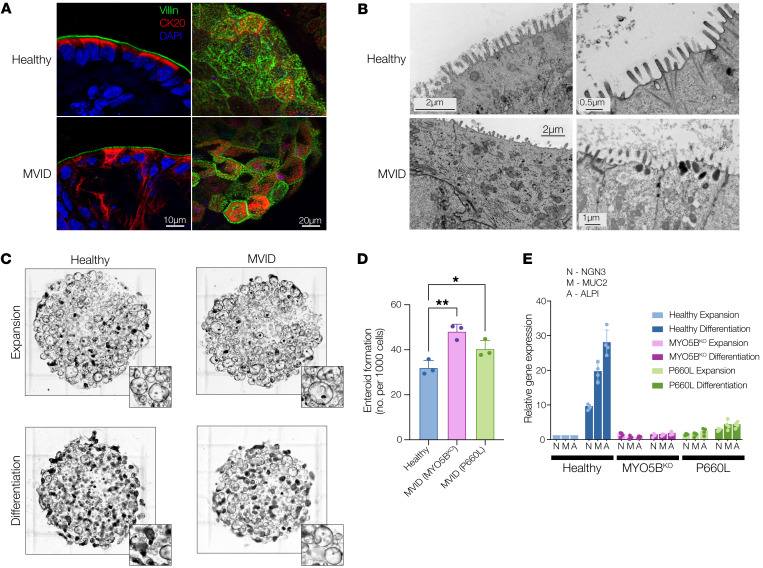
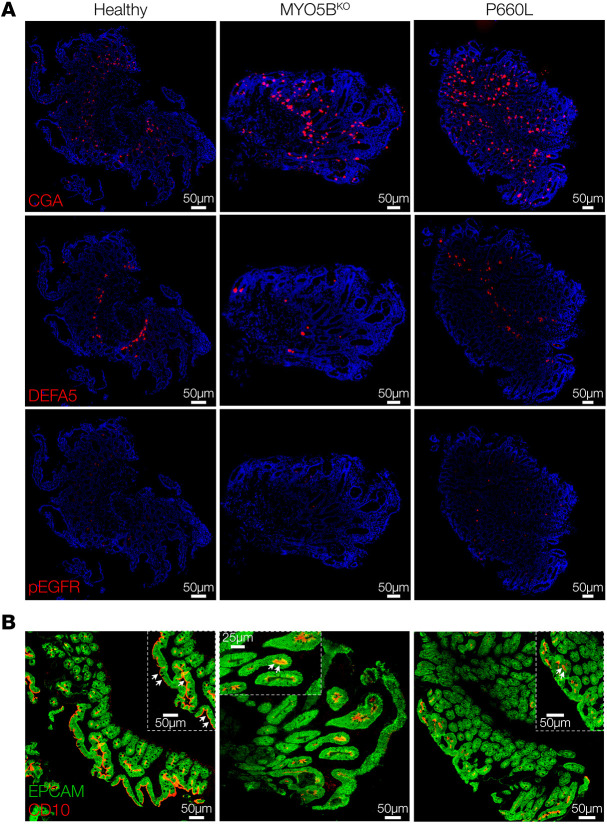
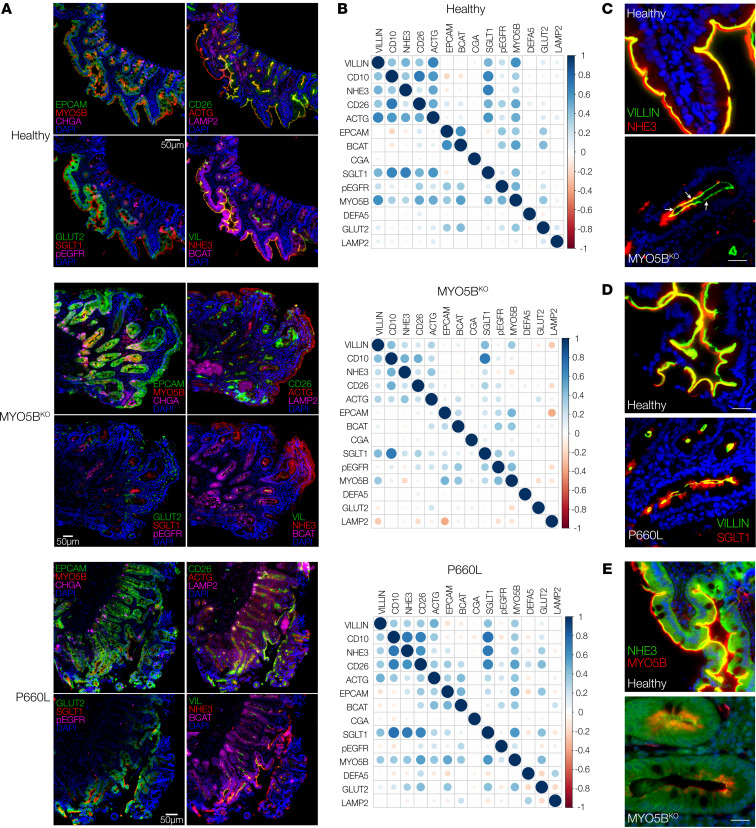
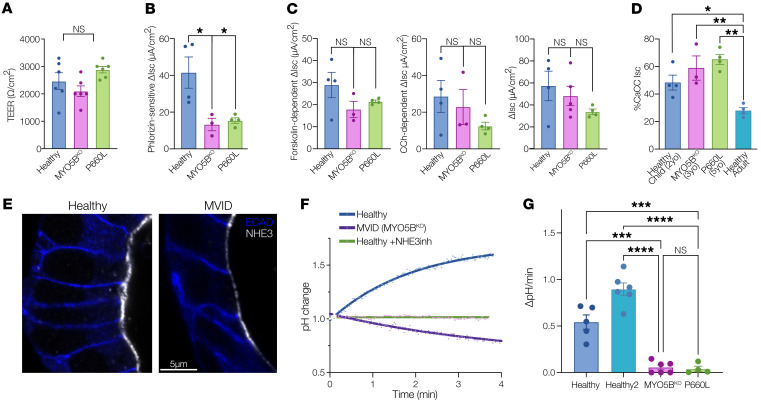
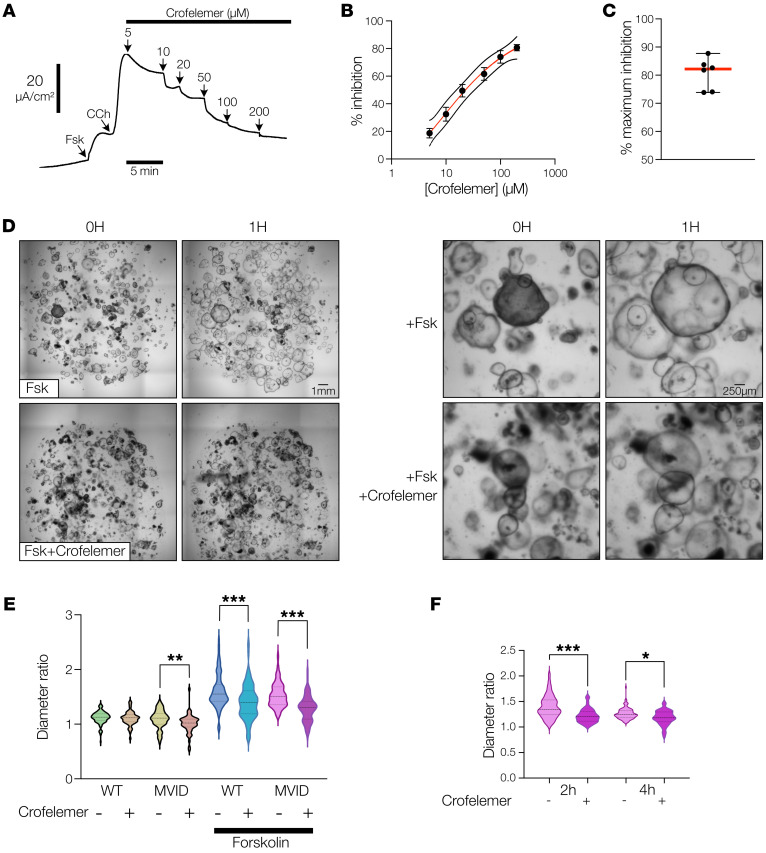
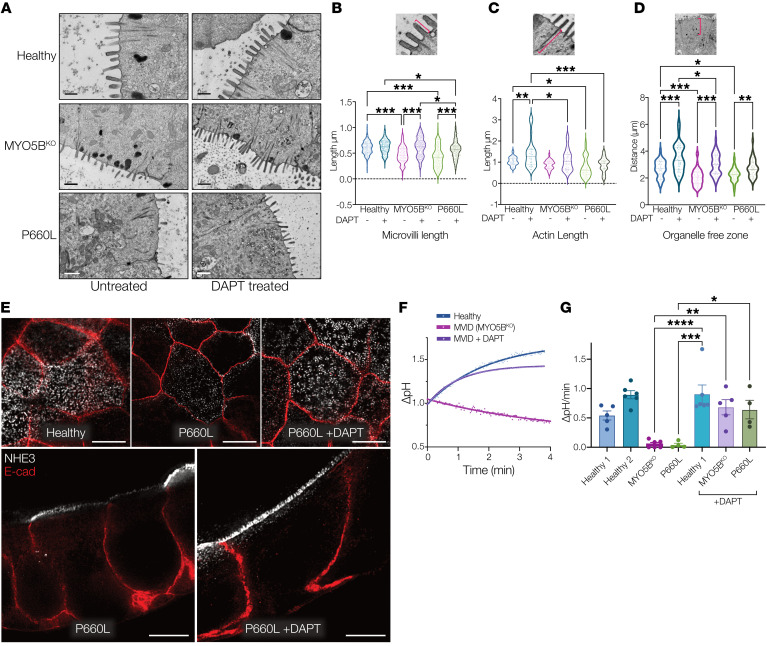
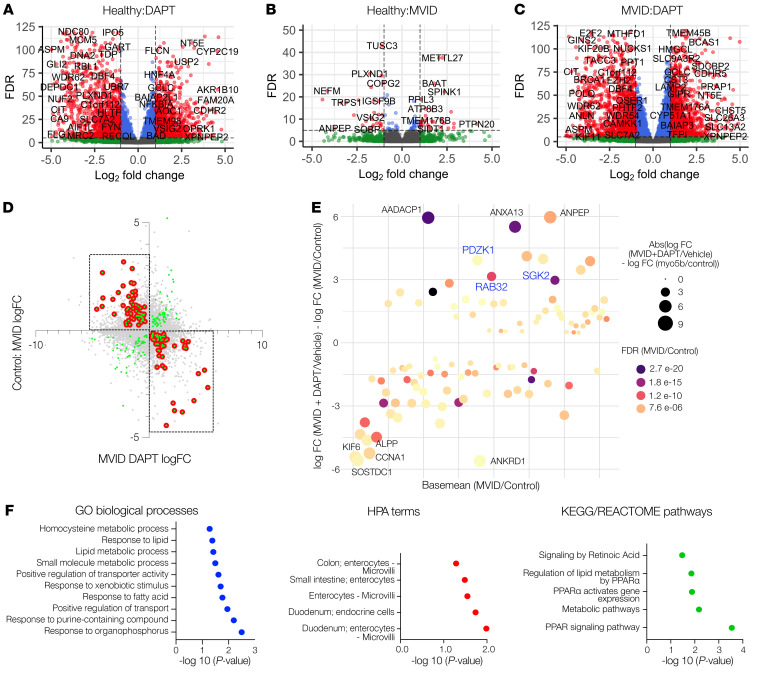
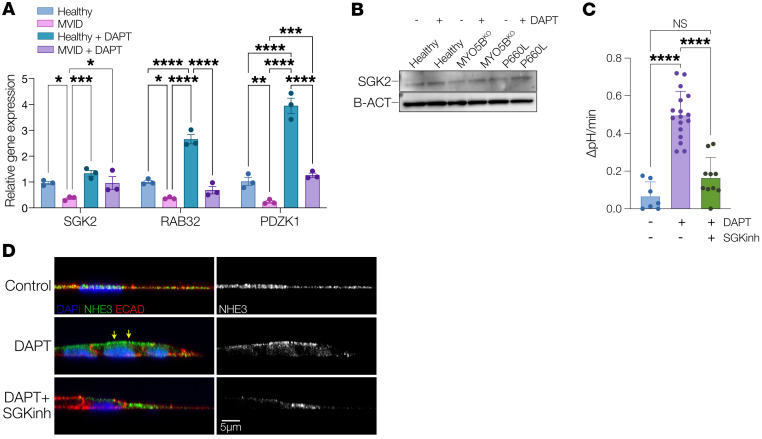
Microvillus inclusion disease (MVID), caused by loss-of-function mutations in the motor protein myosin Vb (MYO5B), is a severe infantile disease characterized by diarrhea, malabsorption, and acid/base instability, requiring intensive parenteral support for nutritional and fluid management. Human patient-derived enteroids represent a model for investigation of monogenic epithelial disorders but are a rare resource from MVID patients. We developed human enteroids with different loss-of function MYO5B variants and showed that they recapitulated the structural changes found in native MVID enterocytes. Multiplex immunofluorescence imaging of patient duodenal tissues revealed patient-specific changes in localization of brush border transporters. Functional analysis of electrolyte transport revealed profound loss of Na+/H+ exchange (NHE) activity in MVID patient enteroids with near-normal chloride secretion. The chloride channel-blocking antidiarrheal drug crofelemer dose-dependently inhibited agonist-mediated fluid secretion. MVID enteroids exhibited altered differentiation and maturation versus healthy enteroids. γ-Secretase inhibition with DAPT recovered apical brush border structure and functional Na+/H+ exchange activity in MVID enteroids. Transcriptomic analysis revealed potential pathways involved in the rescue of MVID cells including serum/glucocorticoid-regulated kinase 2 (SGK2) and NHE regulatory factor 3 (NHERF3). These results demonstrate the utility of patient-derived enteroids for developing therapeutic approaches to MVID.

Keywords: Drug therapy; Epithelial transport of ions and water; Gastroenterology; Genetic diseases.


Conflict of interest statement

Conflict of interest: The authors have declared that no conflict of interest exists.

Figures

Figure 1
Figure 1. MVID enteroids recapitulate native epithelial disease changes.
(A) Representative confocal images of villin (green), cytokeratin 20 (CK20, red), and nuclei (DAPI) of healthy and MVID (MYO5BKO) enteroids in cross section (left; scale bar: 10 μm) or en face (right; scale bar: 20 μm). Representative of 3 separate samples. (B) Representative electron micrographs of healthy and MVID enteroids (MYO5BKO). Representative of 2 separate samples. Scale bars: left, 2 μm; top right, 0.5 μm; bottom right, 1 μm. (C) Bright-field images of enteroid cultures grown in expansion versus differentiation medium. Inset images highlight changes in cultures with increased spheroid (stem-like) morphology in MVID differentiated cultures versus healthy. Representative of 6 separate experiments. (D) Enteroid formation assay showing new enteroid formation (at 4 days after plating) following enzymatic dissociation and replating. Data are shown as means ± SEM; n = 3 experiments; *P < 0.05, **P < 0.01; 2-way ANOVA with Tukey’s post hoc testing. (E) Relative gene expression (normalized to healthy expansion) for neurogenin 3 (NGN3), mucin 2 (MUC2), and alkaline phosphatase (ALPI) in healthy and MVID enteroids following switching to enteroid differentiation medium. Data are shown as means ± SD; n = 4 experiments; 2-way ANOVA with Tukey’s post hoc testing.
Figure 2
Figure 2. Altered secretory cell populations in MVID patient tissues.
(A) Immunofluorescence images of human duodenal biopsy sections stained for chromogranin A (CGA), defensin α5 (DEFA5), and phospho–epidermal growth factor receptor (p-EGFR). Representative of 3 separate sections per tissue. Scale bars: 50 μm. (B) Images of CD10 and epithelial cell adhesion molecule (EPCAM) showing reduced linear CD10 staining in MVID tissues. Representative of 3 separate sections per tissue. Scale bars: 50 μm, except middle inset, 25 μm.
Figure 3
Figure 3. Multiplex immunofluorescence highlights protein localization changes in patient tissues.
(A) Multiplex immunofluorescence panels representing 12 antigens on duodenal biopsy tissues. Scale bars: 50 μm. The Healthy and MYO5BKO panels include data from the same sample as in Figure 2A, MYO5BKO, rows 2 and 3, and Figure 2B, Healthy and MYO5BKO. (B) Cross-correlation matrices for paired antigens (Pearson’s coefficient) with dot color indicating direction of correlation and dot size indicating extent of correlation. (CE) Individual pairwise staining for Na+/H+ exchanger 3 (NHE3) and villin (C), sodium-glucose cotransporter 1 (SGLT1) and villin (D), and myosin Vb (MYO5B) and NHE3 (E). Scale bars: 10 μm.
Figure 4
Figure 4. Loss of sodium absorption and normal chloride secretion in MVID patient enteroids.
(A) Transepithelial electrical resistance (TEER) 10–14 days after plating on Transwell inserts. Data are shown as means ± SEM; n = 6 monolayers. (B) Glucose-stimulated (20 mM), phlorizin-inhibitable short-circuit current (Isc) in healthy and MVID monolayers. Data are shown as means ± SEM; n = 3–4 monolayers; *P < 0.05. (C) Left: Isc stimulated by 10 μM forskolin. Data are shown as means ± SEM; n = 3–4 monolayers. Middle: Isc stimulated by 50 μM carbachol (CCh). Data are shown as means ± SEM; n = 3–4 monolayers. Right: Isc stimulated by combined forskolin and CCh. Data are shown as means ± SEM; n = 3–4 monolayers. (D) Percentage CCh- (50 μM) and forskolin- (10 μM) stimulated Isc inhibited by CaCC inhibitor A01 (50 μM) in healthy control cells grown from a young donor (2 years old), an adult donor (20 years old), and MVID patients (3 and 5 years old). Data are shown as means ± SEM; n = 3–4 monolayers; *P < 0.05, **P < 0.01. (E) Super-resolution images (stimulated emission depletion [STED]) of NHE3 localization and abundance in healthy and MVID patient enteroids. Scale bar: 5 μm. (F) Example curves showing change in pH calculated from analysis of intensity changes of SNARF-5F fluorescence in healthy and MVID cells and healthy cells after pretreatment with the NHE3 inhibitor (10 μM). (G) Summary graph showing NHE3-dependent pH changes in healthy and MVID patient cells. Data are shown as means ± SEM; n = 4–6 experiments; ***P < 0.001, ****P < 0.0001; 2-way ANOVA with Tukey’s post hoc testing.
Figure 5
Figure 5. Crofelemer inhibits chloride and fluid secretion in MVID patient enteroids.
(A) Representative curve showing dose-dependent inhibition of forskolin- (10 μM) and carbachol-stimulated (50 μM) Isc by crofelemer. (B) Dose-response curve for crofelemer-induced inhibition of forskolin- and carbachol-stimulated Isc in MVID patient enteroids (MYO5B KO). Data are shown as means ± SEM; n = 6 monolayers. (C) Maximal percentage inhibition of agonist-stimulated current by crofelemer. Data are shown as means ± SEM; n = 6 monolayers. (D) Example bright-field images before and after forskolin (2 μM) ± crofelemer (200 μM) in MVID patient enteroids. Right panels show higher magnification of enteroid swelling. Representative of 4 separate experiments. Scale bars: left panels, 1 mm; right panels, 250 μm. (E) Violin plot showing increase in enteroid size (diameter ratio) in healthy and MVID enteroids at 1 hour ± forskolin and ± crofelemer (200 μM). Dotted lines, median ± interquartile range; >300 enteroids from 4 experiments. (F) Diameter ratio in MVID enteroids at 2 and 4 hours after stimulation ± crofelemer (200 μM). Dotted lines, median and interquartile range; n = 3 experiments; *P < 0.05, **P < 0.01, ***P < 0.001; 2-way ANOVA with Tukey’s post hoc testing.
Figure 6
Figure 6. γ-Secretase inhibition rescues MVID patient enteroid differentiation.
(A) Electron micrographs of healthy and MVID enteroids with and without DAPT treatment (10 μM). Scale bars: top panels, 0.5 μm; middle and bottom panels, 1 μm. (B) Analysis of electron microscopic images of microvillus length. (C) Subapical actin bundle length. (D) Distance of apical organelle free zone. Inset images above show example measured parameter. Graphs show measurements from at least 10 electron microscopic images. (E) Super-resolution confocal images (STED), en face (top) and cross section (bottom), of NHE3 localization and abundance in healthy and MVID patient enteroids following treatment with DAPT (10 μM). Scale bars: 5 μm. (F) Representative curves showing change in intracellular pH in healthy cells and MVID cells with and without DAPT. (G) Summary graph showing NHE3-dependent pH changes in healthy and MVID patient cells with and without DAPT. Data are shown as means ± SEM; n = 4–6 experiments; *P < 0.05, **P < 0.01, ***P < 0.001, ****P < 0.0001; 2-way ANOVA with Tukey’s post hoc testing.
Figure 7
Figure 7. Genome-wide transcriptomic analysis reveals potential targets for rescue of MVID enteroids.
(A) Volcano plot showing log2 fold change (FC) and false discovery rate (FDR) showing genes with significantly up- and downregulated expression (red) in healthy enteroids (n = 3) following DAPT treatment (10 μM). (B) Volcano plot showing genes with significantly up- and downregulated expression (red) between healthy enteroids and MVID enteroids (MYO5B KO) (n = 3). (C) Volcano plot showing genes with significantly up- and downregulated expression (red) in MVID enteroids (MYO5B KO) following DAPT treatment (10 μM). (D) Plot of genes with significantly altered expression (green dots) between MVID and healthy against MVID + DAPT. Red dots indicate genes changing in opposite directions following DAPT treatment (filtered genes). (E) Dot plot of filtered genes by change in expression and base mean expression, with dot size indicating fold change and color indicating FDR. Highlighted genes are based on previous functional data indicating a plausible biological role. (F) Pathway analysis showing most significant Gene Ontology (GO) terms, Human Protein Atlas (HPA) terms, and Kyoto Encyclopedia of Genes and Genomes (KEGG) pathways.
Figure 8
Figure 8. Analysis of genes potentially involved in DAPT-mediated rescue of MVID enteroids.
(A) qPCR analysis showing relative gene expression (normalized to healthy untreated) for serum/glucocorticoid-regulated kinase 2 (SGK2), Rab GTPase 32 (RAB32), and PDZ domain–containing 1 (PDZK1) in healthy and MVID enteroids with and without DAPT (10 μM). Data are shown as means ± SEM; n = 3 experiments. (B) Immunoblot of SGK2 protein changes with and without DAPT. (C) Summary graph showing NHE3-dependent pH changes in MVID patient enteroids with and without DAPT (10 μM) and MVID patient enteroids with and without DAPT and SGK inhibitor (GSK650394, 5 μM). Data are shown as means ± SEM; n = 3 experiments; ****P < 0.0001; 2-way ANOVA with Tukey’s post hoc testing. (D) Z-plane confocal images in P660L patient enteroids with and without DAPT (10 μM) and MVID patient enteroids with and without DAPT and SGK inhibitor (GSK650394, 5 μM) showing NHE3 (green), E-cadherin (red), and nuclei (blue) with composite (left) and NHE3 only (grayscale; right).

Update of

Similar articles

Cited by

References

    1. Müller T, et al. MYO5B mutations cause microvillus inclusion disease and disrupt epithelial cell polarity. Nat Genet. 2008;40(10):1163–1165. doi: 10.1038/ng.225. - DOI - PubMed
    1. van der Velde KJ, et al. An overview and online registry of microvillus inclusion disease patients and their MYO5B mutations. Hum Mutat. 2013;34(12):1597–1605. doi: 10.1002/humu.22440. - DOI - PubMed
    1. Bowman DM, et al. Altered MYO5B function underlies microvillus inclusion disease: opportunities for intervention at a cellular level. Cell Mol Gastroenterol Hepatol. 2022;14(3):553–565. doi: 10.1016/j.jcmgh.2022.04.015. - DOI - PMC - PubMed
    1. Babcock SJ, et al. The genetics of monogenic intestinal epithelial disorders. Hum Genet. 2022;142(5):613–654. - PMC - PubMed
    1. Erickson RP, et al. Navajo microvillous inclusion disease is due to a mutation in MYO5B. Am J Med Genet A. 2008;146A(24):3117–3119. doi: 10.1002/ajmg.a.32605. - DOI - PubMed

Publication types

MeSH terms

Supplementary concepts