. 2023 Aug 29;18(8):e0284834.
doi: 10.1371/journal.pone.0284834. eCollection 2023.

Comparative analysis of the myoglobin gene in whales and humans reveals evolutionary changes in regulatory elements and expression levels

Affiliations

Comparative analysis of the myoglobin gene in whales and humans reveals evolutionary changes in regulatory elements and expression levels

Charles Sackerson et al. PLoS One. .

Abstract

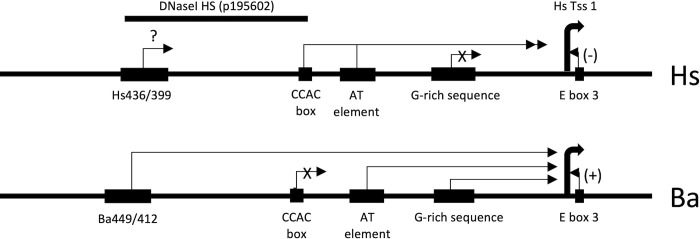
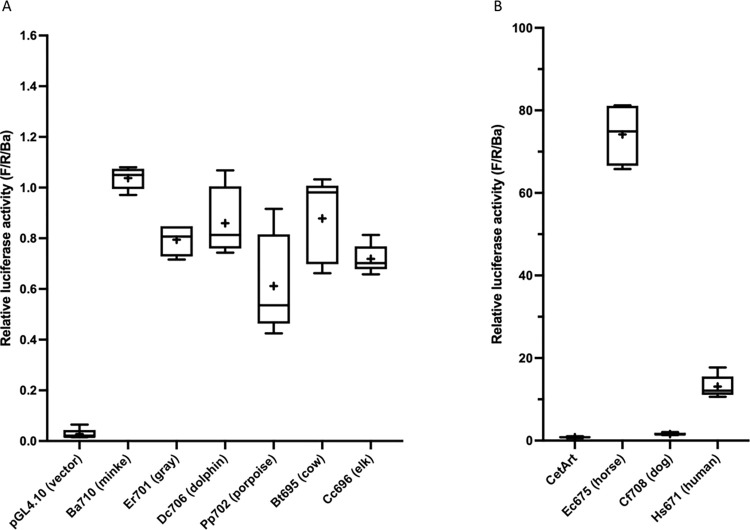
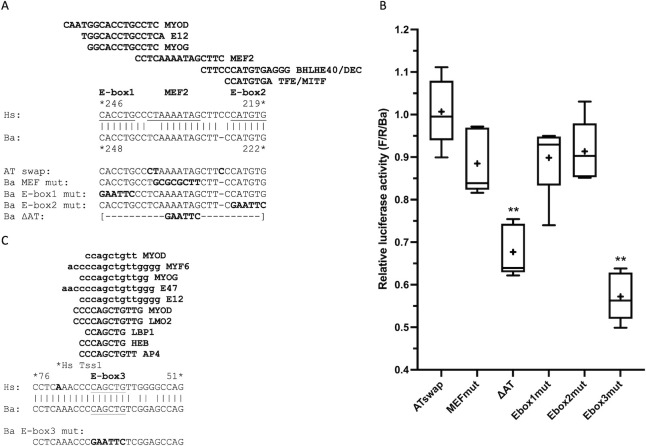
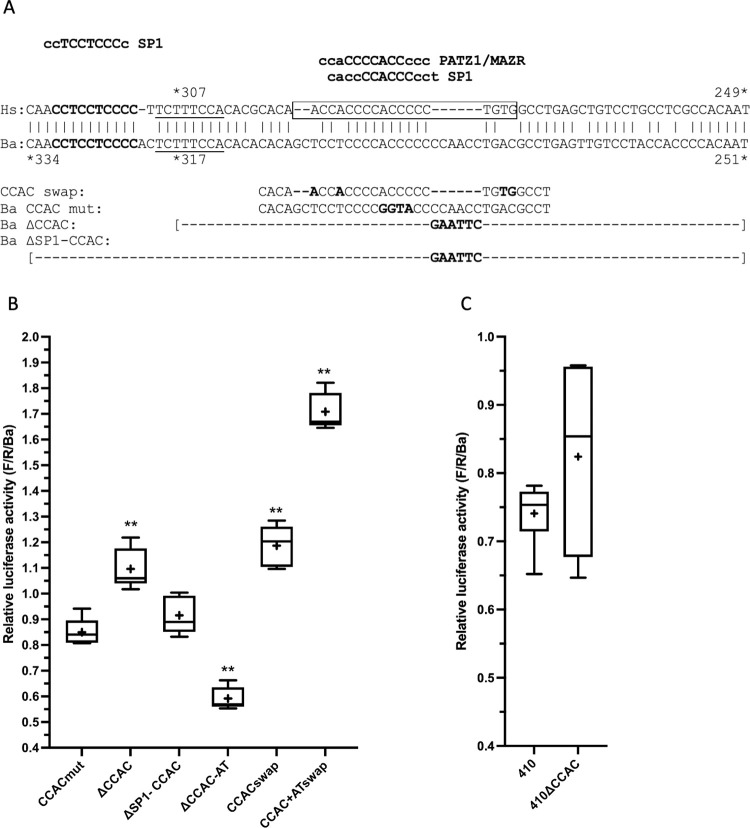
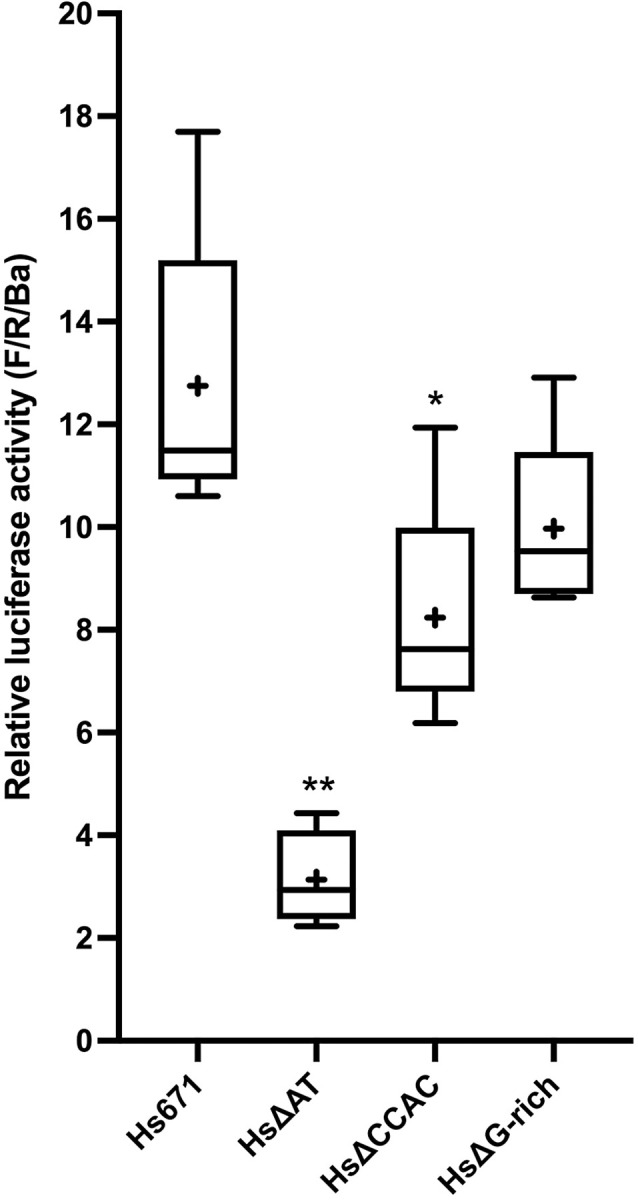
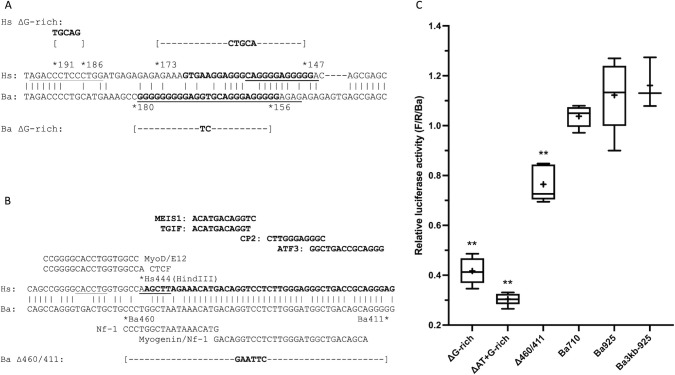
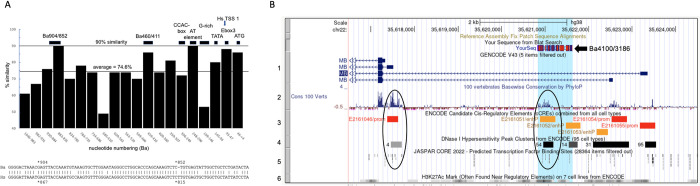
Cetacea and other diving mammals have undergone numerous adaptations to their aquatic environment, among them high levels of the oxygen-carrying intracellular hemoprotein myoglobin in skeletal muscles. Hypotheses regarding the mechanisms leading to these high myoglobin levels often invoke the induction of gene expression by exercise, hypoxia, and other physiological gene regulatory pathways. Here we explore an alternative hypothesis: that cetacean myoglobin genes have evolved high levels of transcription driven by the intrinsic developmental mechanisms that drive muscle cell differentiation. We have used luciferase assays in differentiated C2C12 cells to test this hypothesis. Contrary to our hypothesis, we find that the myoglobin gene from the minke whale, Balaenoptera acutorostrata, shows a low level of expression, only about 8% that of humans. This low expression level is broadly shared among cetaceans and artiodactylans. Previous work on regulation of the human gene has identified a core muscle-specific enhancer comprised of two regions, the "AT element" and a C-rich sequence 5' of the AT element termed the "CCAC-box". Analysis of the minke whale gene supports the importance of the AT element, but the minke whale CCAC-box ortholog has little effect. Instead, critical positive input has been identified in a G-rich region 3' of the AT element. Also, a conserved E-box in exon 1 positively affects expression, despite having been assigned a repressive role in the human gene. Last, a novel region 5' of the core enhancer has been identified, which we hypothesize may function as a boundary element. These results illustrate regulatory flexibility during evolution. We discuss the possibility that low transcription levels are actually beneficial, and that evolution of the myoglobin protein toward enhanced stability is a critical factor in the accumulation of high myoglobin levels in adult cetacean muscle tissue.


Conflict of interest statement

The authors have declared that no competing interests exist.

Figures

Fig 1
Fig 1. Summary of regulatory features in the myoglobin 5’ flanking region.
DNA sequence elements identified previously or in this work are schematized, to scale. The top line represents the human (Homo sapiens, Hs) gene, the lower line the minke whale (Balaenoptera acutorostrata, Ba) gene. Hs Tss1 is the human major transcription start site (Tss) [19]; the Ba Tss is presumed to be at the same nucleotide. The arrows represent positive regulatory inputs unless otherwise indicated. The “+” and “-” notation on the E-box3 arrows reflect its activating (positive) effect in the Ba gene and repressive (negative) effect in the Hs gene. The “X” on the Hs G-rich sequence arrow and the Ba CCAC-box arrow indicate a lack of effect. The “?” on the conserved Hs orthologue of the Ba449/412 region indicates that its effect on expression was not tested. DNaseI HS (p195602) indicates the extent of a DNaseI hypersensitive site identified in muscle cells by the ENCODE project as displayed in the UCSC Genome Browser [20, 21] (see Fig 7 for further details).
Fig 2
Fig 2. Species scan of MB promoter activity.
(A) Box-and-whisker plots of selected cetacean and artiodactylan species, normalized as described for Table 1. The Y-axis shows activity compared to the Ba710 control included in each transfected plate (relative activity of the Ba710 control = 1.0). The “+” in each box is the sample mean. Clone designations are as described for Table 1. (B) The mean of ten cetacean and artiodactylan species (“CetArt”, S2 File) is compared to horses (Ec675: E. caballus), dogs (Cf708: C. familiaris), and humans (Hs671: H. sapiens). Note that the axes differ in scale in A and B.
Fig 3
Fig 3. Deletion of the entire AT element is required to impact Ba promoter activity.
(A) Alignment of AT element sequences from Hs and Ba, with predicted transcription factor binding sites conserved in both species (rVISTA) and expressed in muscle (S7 File) shown above; the human binding site sequences are shown here and below for simplicity. The two E-boxes and the core of the MEF2 binding site [30] are underlined. Below are the mutations tested. rVISTA predicts that Ba MEF mut eliminates MEF2 binding but does not impact binding of other factors; Ba E-box1 mut eliminates MYOD, E12, and MYOG binding but has no impact on MEF2 or E-box2 binding; Ba E-box2 mut eliminates DEC and TFE binding without affecting E-box1 or MEF2 binding. Ba ΔAT is not predicted (rVISTA) to bind any of the transcription factors shown. (B) Activity of AT element mutations. To determine which samples differ from control, ATswap was used for the comparisons (relative activity of the Ba710 control = 1.0); samples indicated by ** had p <0.01 (see S3D File for details). ATswap: AT swap, mean = 101% of control. MEFmut: Ba MEF mut, mean = 88% of control. ΔAT: Ba ΔAT, mean = 68% of control, p <0.0001. Ebox1mut: Ba E-box1 mut, mean = 90% of control. Ebox2mut: Ba E-box2 mut, mean = 91% of control. Ebox3mut: Ba E-box3 mut, mean = 57% of control, p <0.0001. (C) Alignment of the E-box3 region from Hs and Ba (E-box3 is addressed in the text below), with predicted transcription factor binding sites expressed in muscle (S7 File) shown above. Binding site sequences in lower case were identified independently on the Hs and Ba sequences by LASAGNA; binding sites in upper case were identified as conserved in Hs and Ba by rVISTA. MYOD binding is also predicted by MATCH. The T → C difference at nt 59 does not prevent binding for any of the transcription factors shown (numbering from the ATG is the same in Hs and Ba for this region). The human major transcription start site is indicated at nt 72. Note that all three E-boxes received the same mutation: CAnnTG → GAATTC.
Fig 4
Fig 4. The Ba CCAC-box has little detectable activity in differentiated C2C12 cells.
(A) Alignment of the CCAC-box region from Hs and Ba, with predicted transcription factor binding sites conserved in both species (rVISTA) and expressed in muscle (S7 File) shown above. An NFAT site not found by rVISTA but previously identified [32] is underlined. The 5’ SP1 site targeted by Ba ΔSP1-CCAC is in bold. The region targeted by the Ba CCAC swap is boxed in the Hs sequence. Below are the mutations tested. rVISTA predicts that Ba CCAC mut eliminates the PATZ1/MAZR and SP1 sites but a new nonconserved SP1 site is predicted in the Ba CCAC swap (rVISTA: agctCCTCCCcgg); similarly, a new site is predicted in the Hs CCAC mut 3 [14] (rVISTA: acaaCCACCccgg/). (B) Activity of CCAC-box mutations. For analysis of statistical significance in this figure, Ba ΔSP1-CCAC was used for comparison; samples indicated by ** had p <0.01 (see S4C File for details). CCAC mut: Ba CCAC mut, mean = 85% of control. ΔCCAC: Ba ΔCCAC, mean = 110% of control, p = 0.001. ΔSP1-CCAC: Ba ΔSP1-CCAC, mean = 92% of control. ΔCCAC-AT: Ba ΔCCAC-AT, mean = 59% of control, p <0.0001. CCACswap: CCAC swap, mean = 119% of control, p <0.0001. CCAC+ATswap: CCAC+AT swap, mean = 171% of control, p <0.0001. CCACswap vs. CCAC+AT swap: p <0.0001. (C) Comparison of Ba410 to Ba410ΔCCAC. 410: Ba410, mean = 74% of control. 410ΔCCAC: Ba410 ΔCCAC, mean = 82% of control.
Fig 5
Fig 5. The human AT element and CCAC-box have detectable activity in differentiated C2C12 cells.
Activity of deletions in Hs671, normalized to Ba710 (F/R/Ba). Samples that differ from Hs671 are indicated by asterisks (* p <0.05, ** p < 0.01; see S5B File for details). Hs671: mean = 12.7-fold Ba710. Hs ΔAT: mean = 3.1-fold Ba710 (24% of Hs671), probability of a difference from Hs671 (p) = <0.0001. Hs ΔCCAC: mean = 8.2-fold Ba710 (65% of Hs671), p = 0.019. Hs ΔG-rich (the G-rich sequence is addressed in the text below): mean = 10.0-fold Ba710 (79% of Hs671), probability of a difference from Hs671 is not significant.
Fig 6
Fig 6. Sequences and activities of novel regulatory sequences in the Ba gene.
(A) Alignment of the region around the Hs and Ba G-rich sequences. The G-rich sequences Hs168/146 and Ba179/155 are in bold font. The sequences predicted (rVISTA) to bind SP1 are underlined; none of these predicted binding sites is conserved between Hs and Ba. An additional predicted SP1 binding site (MATCH) 5’ of the Hs G-rich sequence (Hs195/183) is also underlined. The Ba ΔG-rich mutant replaces Ba180/156 with a TC sequence; the Hs ΔG-rich mutant replaces Hs191/186 with a TGCAG sequence and Hs173/147 with a CTGCA. Analysis of both mutant sequences (rVISTA, MATCH) predicts no SP1 binding sites. (B) Alignment of the Ba449/412 conservation between Hs and Ba. In the Hs sequence, the 5’ end of a DNaseI hypersensitive region is in bold text and a nonconserved flanking CTCF binding site is indicated (from UCSC Genome Browser [20], see Fig 7B, Track 4). Above, conserved (rVISTA) sites for transcription factors expressed in muscle (S7 File) are indicated in bold. An E-box (CACCTG) is underlined and nonconserved MYOD and E12 (rVISTA) sites are indicated. A HindIII site (AAGCTT, at position -373 of Devlin et al. [13]) is shown for reference. In the Ba sequence, nonconserved NF1 and composite MYOG/NF1 sites (LASAGNA) are indicated. The Ba Δ460/411 deletion replaces Ba460/411 with a GAATTC sequence. (C) Activity of mutations in the novel Ba regulatory regions. For analysis of statistical significance in this figure, Ba710 was used for comparison; samples indicated by ** had p <0.01 (see S6C File for details). ΔG-rich: Ba ΔG-rich, mean = 42% of control, p <0.0001. ΔAT+G-rich: Ba ΔAT + ΔG-rich, mean = 30% of control, p <0.0001. Δ460/411: Ba Δ460/411, mean = 76% of control, p < 0.0001. 710: Ba710, mean = 104% of control. Ba925: Ba925, mean = 112% of control. Ba3kb-925, mean = 116% of control.
Fig 7
Fig 7. Two distal regions of high sequence conservation have no discernible activity.
(A) Graph of percent sequence similarity between Hs and Ba from nucleotide +4 (A of ATG = +1) to Ba1046 and Hs996, in blocks of 50 nts relative to the Hs sequence. The average nucleotide similarity across this region is 74.6%. Shown above are regulatory landmarks described in this work. Below is a BLASTn alignment of 100 nt of Ba and Hs sequence around the Ba904/852 conserved region. (B) Presentation of 8,000 nt of human chromosome 22 from the UCSC Genome Browser [20, 21] showing the 5’ end of the human myoglobin gene and about 7,000 nt of the 5’ flanking region. Selected browser tracks are numbered at left. Above Track 1, arrow, the Ba4100/3186 region tested as the putative “Ba3kb” enhancer is indicated. Circled at the left of the figure is the region shown in Fig 6B: this region has high sequence conservation, a predicted cis-regulatory element (E2161046), a DNase I hypersensitive region (labeled “4”), and a cluster of predicted transcription factor binding sites including a CTCF site. Circled in the center of the figure is the region of high sequence conservation tested as “Ba 3kb”, a predicted cis-regulatory element E2161051, a DNase I hypersensitive region, and a cluster of predicted transcription factor binding sites for NFAT, MYF, and MEF transcription factors. Track 1: the 4 most-proximal of the nine known transcription start sites; the one at the top is TSS 1, the major transcription start site, at coordinate chr22:35,617,329; transcription is right to left. Track 2: Sequence conservation across 100 vertebrates. Track 3: Computationally predicted candidate cis-regulatory elements based on ENCODE data. Track 4: DNaseI hypersensitive sites. Track 5: Selected transcription factor binding sites predicted by JASPAR. Track 6: Histone H3 lysine27 acetylation. This UCSC Genome Browser view can be accessed at: https://genome.ucsc.edu/s/csackerson/chr22%3A35%2C616%2C500%2D35%2C624%2C499.

Similar articles

References

    1. Thewissen JGM, Cooper LN, George JC, Bajpai S. From land to water: the origin of whales, dolphins, and porpoises. Evol Edu Outreach. 2009;2:272–288. doi: 10.1007/s12052-009-0135-2 - DOI
    1. Uhen MD. The origin (s) of whales. Annu Rev Earth Planet Sci. 2010;38:189–219. doi: 10.1146/annurev-earth-040809-152453 - DOI
    1. Foley NM, Springer MS, Teeling EC. Mammal madness: is the mammal tree of life not yet resolved? Philos Trans R Soc Lond B Biol Sci. 2016. Jul 19;371(1699):20150140. doi: 10.1098/rstb.2015.0140 ; PMCID: PMC4920340. - DOI - PMC - PubMed
    1. Kooyman GL, Ponganis PJ. The physiological basis of diving to depth: birds and mammals. Annu Rev Physiol. 1998;60:19–32. doi: 10.1146/annurev.physiol.60.1.19 . - DOI - PubMed
    1. Ordway GA, Garry DJ. Myoglobin: an essential hemoprotein in striated muscle. J Exp Biol. 2004. Sep;207(Pt 20):3441–6. doi: 10.1242/jeb.01172 . - DOI - PubMed

Publication types

LinkOut - more resources