

Morphometric similarity network alterations in COVID-19 survivors correlate with behavioral features and transcriptional signatures
- PMID: 37643521
- PMCID: PMC10474075
- DOI: 10.1016/j.nicl.2023.103498
Morphometric similarity network alterations in COVID-19 survivors correlate with behavioral features and transcriptional signatures
Abstract
Objectives: To explore the differences in the cortical morphometric similarity network (MSN) between COVID-19 survivors and healthy controls, and the correlation between these differences and behavioralfeatures and transcriptional signatures.
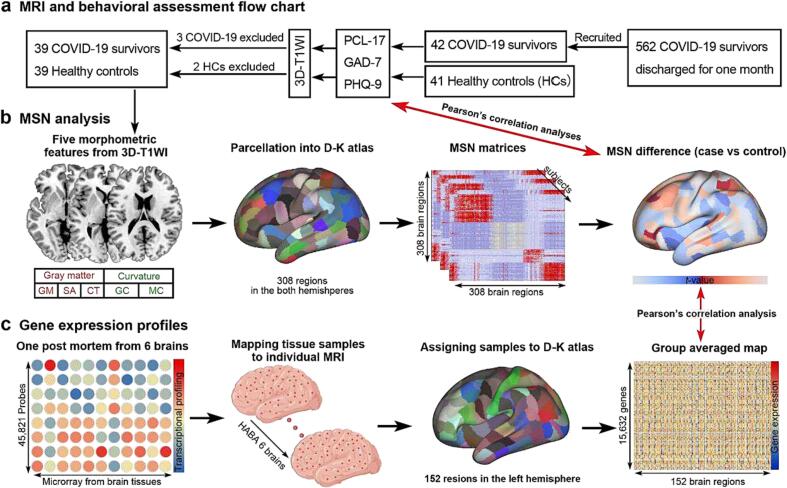
Materials & methods: 39 COVID-19 survivors and 39 age-, sex- and education years-matched healthy controls (HCs) were included. All participants underwent MRI and behavioral assessments (PCL-17, GAD-7, PHQ-9). MSN analysis was used to compute COVID-19 survivors vs. HCs differences across brain regions. Correlation analysis was used to determine the associations between regional MSN differences and behavioral assessments, and determine the spatial similarities between regional MSN differences and risk genes transcriptional activity.
Results: COVID-19 survivors exhibited decreased regional MSN in insula, precuneus, transverse temporal, entorhinal, para-hippocampal, rostral middle frontal and supramarginal cortices, and increased regional MSN in pars triangularis, lateral orbitofrontal, superior frontal, superior parietal, postcentral, and inferior temporal cortices. Regional MSN value of lateral orbitofrontal cortex was positively associated with GAD-7 and PHQ-9 scores, and rostral middle frontal was negatively related to PHQ-9 scores. The analysis of spatial similarities showed that seven risk genes (MFGE8, MOB2, NUP62, PMPCA, SDSL, TMEM178B, and ZBTB11) were related to regional MSN values.
Conclusion: The MSN differences were associated with behavioral and transcriptional signatures, early psychological counseling or intervention may be required to COVID-19 survivors. Our study provided a new insight into understanding the altered coordination of structure in COVID-19 and may offer a new endophenotype to further investigate the brain substrate.
Keywords: Allen Human Brain Atlas; Behavioral assessment; COVID-19; Gene transcription; Morphometric similarity network.
Copyright © 2023 The Author(s). Published by Elsevier Inc. All rights reserved.
Conflict of interest statement
Declaration of Competing Interest The authors declare that they have no known competing financial interests or personal relationships that could have appeared to influence the work reported in this paper.
Figures


Similar articles
-
Cortical morphometric vulnerability to generalised epilepsy reflects chromosome- and cell type-specific transcriptomic signatures.Neuropathol Appl Neurobiol. 2023 Feb;49(1):e12857. doi: 10.1111/nan.12857. Epub 2022 Nov 6. Neuropathol Appl Neurobiol. 2023. PMID: 36278258
-
Altered morphometric similarity networks in insomnia disorder.Brain Struct Funct. 2024 Jul;229(6):1433-1445. doi: 10.1007/s00429-024-02809-0. Epub 2024 May 27. Brain Struct Funct. 2024. PMID: 38801538
-
Age-associated cortical similarity networks correlate with cell type-specific transcriptional signatures.Cereb Cortex. 2024 Jan 14;34(1):bhad454. doi: 10.1093/cercor/bhad454. Cereb Cortex. 2024. PMID: 38037843
-
Common and distinct patterns of intrinsic brain activity alterations in major depression and bipolar disorder: voxel-based meta-analysis.Transl Psychiatry. 2020 Oct 19;10(1):353. doi: 10.1038/s41398-020-01036-5. Transl Psychiatry. 2020. PMID: 33077728 Free PMC article. Review.
-
Abnormalities of brain structure and function in cervical spondylosis: a multi-modal voxel-based meta-analysis.Front Neurosci. 2024 Jun 14;18:1415411. doi: 10.3389/fnins.2024.1415411. eCollection 2024. Front Neurosci. 2024. PMID: 38948928 Free PMC article.
Cited by
-
Cerebral blood flow alterations and host genetic association in individuals with long COVID: A transcriptomic-neuroimaging study.J Cereb Blood Flow Metab. 2025 Mar;45(3):431-442. doi: 10.1177/0271678X241277621. Epub 2024 Aug 23. J Cereb Blood Flow Metab. 2025. PMID: 39177056 Free PMC article.
-
Morphometric Similarity Patterning of Amyloid-β and Tau Proteins Correlates with Transcriptomics in the Alzheimer's Disease Continuum.Int J Mol Sci. 2024 Nov 29;25(23):12871. doi: 10.3390/ijms252312871. Int J Mol Sci. 2024. PMID: 39684582 Free PMC article.
-
Neuroimaging insights into lung disease-related brain changes: from structure to function.Front Aging Neurosci. 2025 Feb 20;17:1550319. doi: 10.3389/fnagi.2025.1550319. eCollection 2025. Front Aging Neurosci. 2025. PMID: 40051465 Free PMC article. Review.
References
-
- Anderson, K.M., Collins, M.A., Kong, R., Fang, K., Li, J., He, T., Chekroud, A.M., Yeo, B.T.T., Holmes, A.J., 2020. Convergent molecular, cellular, and cortical neuroimaging signatures of major depressive disorder. Proceedings of the National Academy of Sciences 117, 25138-25149. https://doi.org/10.1073/pnas.2008004117. - PMC - PubMed
Publication types
MeSH terms
LinkOut - more resources
Full Text Sources
Medical
Research Materials
Miscellaneous
