. 2023 Nov 1;22(11):1290-1303.
doi: 10.1158/1535-7163.MCT-22-0718.

Targeting Aggressive B-cell Lymphomas through Pharmacological Activation of the Mitochondrial Protease OMA1

Affiliations

Targeting Aggressive B-cell Lymphomas through Pharmacological Activation of the Mitochondrial Protease OMA1

Adrian Schwarzer et al. Mol Cancer Ther. .

Abstract

DLBCL are aggressive, rapidly proliferating tumors that critically depend on the ATF4-mediated integrated stress response (ISR) to adapt to stress caused by uncontrolled growth, such as hypoxia, amino acid deprivation, and accumulation of misfolded proteins. Here, we show that ISR hyperactivation is a targetable liability in DLBCL. We describe a novel class of compounds represented by BTM-3528 and BTM-3566, which activate the ISR through the mitochondrial protease OMA1. Treatment of tumor cells with compound leads to OMA1-dependent cleavage of DELE1 and OPA1, mitochondrial fragmentation, activation of the eIF2α-kinase HRI, cell growth arrest, and apoptosis. Activation of OMA1 by BTM-3528 and BTM-3566 is mechanistically distinct from inhibitors of mitochondrial electron transport, as the compounds induce OMA1 activity in the absence of acute changes in respiration. We further identify the mitochondrial protein FAM210B as a negative regulator of BTM-3528 and BTM-3566 activity. Overexpression of FAM210B prevents both OMA1 activation and apoptosis. Notably, FAM210B expression is nearly absent in healthy germinal center B-lymphocytes and in derived B-cell malignancies, revealing a fundamental molecular vulnerability which is targeted by BTM compounds. Both compounds induce rapid apoptosis across diverse DLBCL lines derived from activated B-cell, germinal center B-cell, and MYC-rearranged lymphomas. Once-daily oral dosing of BTM-3566 resulted in complete regression of xenografted human DLBCL SU-DHL-10 cells and complete regression in 6 of 9 DLBCL patient-derived xenografts. BTM-3566 represents a first-of-its kind approach of selectively hyperactivating the mitochondrial ISR for treating DLBCL.


Figures

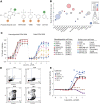
Figure 1. Pyrazolo-thiazole derivates are novel anticancer agents. A, Chemical structures of the BTM pyrazolo-thiazole series. BTM-3528 and BTM-3566 are active versions of the series. BTM-3532 is a closely related inactive member of the series. B, Summary of activity of BTM-3528 in 99 tumor cell lines from different tumor entities plotted as mean activity area (MAA, integrated potency and magnitude of cell growth inhibition, in the CellTiterGlo assay, see Materials and Methods) over tumor tissue of origin. C, Dose response curves of select hematopoietic tumor cell lines (left) and solid tumor lines (right) treated with BTM-3528. D, Annexin-PI staining performed in BJAB cells incubated with 2 μmol/L BTM3528 for 12, 24, and 36 hrs. The percentage of surviving cells is indicated in red font in the lower left quadrant. E, Induction of caspase-3/7 activity in selected DLBCL and solid tumor cell. All data are plotted as the mean (± SD, n = 3) as compared with vehicle.
Figure 1.
Pyrazolo-thiazole derivates are novel anticancer agents. A, Chemical structures of the BTM pyrazolo-thiazole series. BTM-3528 and BTM-3566 are active versions of the series. BTM-3532 is a closely related inactive member of the series. B, Summary of activity of BTM-3528 in 99 tumor cell lines from different tumor entities plotted as mean activity area (MAA, integrated potency and magnitude of cell growth inhibition, in the CellTiterGlo assay, see Materials and Methods) over tumor tissue of origin. C, Dose response curves of select hematopoietic tumor cell lines (left) and solid tumor lines (right) treated with BTM-3528. D, Annexin-PI staining performed in BJAB cells incubated with 2 μmol/L BTM3528 for 12, 24, and 36 hrs. The percentage of surviving cells is indicated in red font in the lower left quadrant. E, Induction of caspase-3/7 activity in selected DLBCL and solid tumor cell. All data are plotted as the mean (± SD, n = 3) as compared with vehicle.
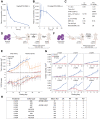
Figure 2. BTM-3566 has favorable pharmacokinetics and induces durable remissions in DLBCL-xenograft models. A, Plasma concentration of BTM-3566 after bolus intravenous administration of 1 mg/kg BTM-3566. N = 3 animals per condition. B, Plasma concentration of BTM-3566 after oral gavage dosing of 10 mg/kg BTM-3566. C, PK parameters for dosing of BTM-3566 in the mouse. D, Graphical representation of the Su-DHL-10 xenograft model: Cells were implanted subcutaneously in the flank of SCID beige (C.B-17/IcrHsd- Prkdc scidLystbg-J) mice and grown until tumor volume reached 200 mm3 prior to randomization into four groups. Mice were then dosed orally, once a day with vehicle or a solution of 10, 20, or 30 mg/kg BTM-3566 dissolved in 5%NMP/15% Solutol/10% PEG400/70% D5W. E, SU-DHL-10 xenograft model: top, tumor volume over time; bottom, body weight over time. The vertical line at day 21 represents the end of drug dosing. All data are the mean ± SD (n = 10 animals). F, Graphical representation of the DLBCL PDX-models: nine human DLBCL PDX tumors were established in SCID mice and grown for 11 to 23 days to reach 200 mm3 before randomization. All groups received drug or vehicle for 21 days. Treatment arms received BTM-3566, 20 mg/kg, orally, once a day. Tumor volume was measured and recorded every other day. G, Tumor growth curves over time in nine PDX models. All data represented as mean ± SD (n = 3 animals). • = Vehicle; • = BTM-3566. H, Tabulated results of PDX model testing. CR, complete response, no palpable tumor; PR, partial response, palpable tumor with volume >50% less than baseline; SD, stable disease, tumor volume is not increased above baseline; PD, progressing disease where tumor is larger than starting tumor volume.
Figure 2.
BTM-3566 has favorable pharmacokinetics and induces durable remissions in DLBCL-xenograft models. A, Plasma concentration of BTM-3566 after bolus intravenous administration of 1 mg/kg BTM-3566. N = 3 animals per condition. B, Plasma concentration of BTM-3566 after oral gavage dosing of 10 mg/kg BTM-3566. C, PK parameters for dosing of BTM-3566 in the mouse. D, Graphical representation of the Su-DHL-10 xenograft model: Cells were implanted subcutaneously in the flank of SCID beige (C.B-17/IcrHsd- Prkdc scidLystbg-J) mice and grown until tumor volume reached 200 mm3 prior to randomization into four groups. Mice were then dosed orally, once a day with vehicle or a solution of 10, 20, or 30 mg/kg BTM-3566 dissolved in 5%NMP/15% Solutol/10% PEG400/70% D5W. E, SU-DHL-10 xenograft model: top, tumor volume over time; bottom, body weight over time. The vertical line at day 21 represents the end of drug dosing. All data are the mean ± SD (n = 10 animals). F, Graphical representation of the DLBCL PDX-models: nine human DLBCL PDX tumors were established in SCID mice and grown for 11 to 23 days to reach 200 mm3 before randomization. All groups received drug or vehicle for 21 days. Treatment arms received BTM-3566, 20 mg/kg, orally, once a day. Tumor volume was measured and recorded every other day. G, Tumor growth curves over time in nine PDX models. All data represented as mean ± SD (n = 3 animals). • = Vehicle; • = BTM-3566. H, Tabulated results of PDX model testing. CR, complete response, no palpable tumor; PR, partial response, palpable tumor with volume >50% less than baseline; SD, stable disease, tumor volume is not increased above baseline; PD, progressing disease where tumor is larger than starting tumor volume.
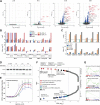
Figure 3. BTM-3528 activates the ATF4-linked mitochondrial stress response A) Volcano plots showing the adjusted P-value (−log10 P) versus the fold change (log2) for 14,287 genes after 2,4,6, and 8 hours of treatment with BTM-3528 versus vehicle. The dashed lines indicate the log2-FC cutoff = 1.0 and the Padj cutoff = 10–3. ATF4-target genes (71) are indicated by red font. B, qPCR analysis of a panel of cell lines treated with BTM-3528 for 8 hours. Bottom, gene changes expressed as mean log2-FC compared with vehicle (n = 3). Top, corresponding −logP value for each triplicate sample as compared with vehicle. C, BTM-3566 induces tumor ATF4 gene expression in a dose-dependent manner in vivo. On day 5 of dosing, tumor tissue was harvested for qPCR analysis of mRNA expression. All data are expressed as the mean fold change (bottom) and corresponding −logP (top) for the contrast BTM versus vehicle for each gene. D, Immunoblot of phosphorylated eIF2α in HCT-116 following treatment with BTM-3528 for the indicated time. E, Dose response of nuclear ATF4 protein abundance in HCT-116 cells treated with BTM3528 for the indicated time and dose. F, Gene set enrichment analysis (GSEA) of 1,773 canonical pathway gene sets from MSigDB C2 of BTM-3528–treated samples versus controls at 8 hours. Plotted are normalized enrichment scores (NES) against the false discovery rate (FDR). The enrichment cutoff (FDR < 0.05) is indicated by the dashed line. G, Top, GSEA for ATF6 target genes; middle, XBP1 target genes; bottom, mitostress signature in HCT116 cells treated with BTM3528 for 8 hours.
Figure 3.
BTM-3528 activates the ATF4-linked mitochondrial stress response A) Volcano plots showing the adjusted P-value (−log10 P) versus the fold change (log2) for 14,287 genes after 2,4,6, and 8 hours of treatment with BTM-3528 versus vehicle. The dashed lines indicate the log2-FC cutoff = 1.0 and the Padj cutoff = 10–3. ATF4-target genes (71) are indicated by red font. B, qPCR analysis of a panel of cell lines treated with BTM-3528 for 8 hours. Bottom, gene changes expressed as mean log2-FC compared with vehicle (n = 3). Top, corresponding −logP value for each triplicate sample as compared with vehicle. C, BTM-3566 induces tumor ATF4 gene expression in a dose-dependent manner in vivo. On day 5 of dosing, tumor tissue was harvested for qPCR analysis of mRNA expression. All data are expressed as the mean fold change (bottom) and corresponding −logP (top) for the contrast BTM versus vehicle for each gene. D, Immunoblot of phosphorylated eIF2α in HCT-116 following treatment with BTM-3528 for the indicated time. E, Dose response of nuclear ATF4 protein abundance in HCT-116 cells treated with BTM3528 for the indicated time and dose. F, Gene set enrichment analysis (GSEA) of 1,773 canonical pathway gene sets from MSigDB C2 of BTM-3528–treated samples versus controls at 8 hours. Plotted are normalized enrichment scores (NES) against the false discovery rate (FDR). The enrichment cutoff (FDR < 0.05) is indicated by the dashed line. G, Top, GSEA for ATF6 target genes; middle, XBP1 target genes; bottom, mitostress signature in HCT116 cells treated with BTM3528 for 8 hours.
Figure 4. BTM compound treatment fragments the mitochondria and induces OPA1 cleavage in an OMA1 dependent manner. A, Representative images from HCT116 cells stained with mitotracker green (MTG) and subjected to live-cell imaging using confocal laser microscopy. B, Mitochondrial aspect ratio and form factor are reduced following treatment with BTM-3528. Aspect ratio and form factor are the average of 4 independent experiments, n = 5 cells and 50 to 70 mitochondria identified per cell, t test; ***, P < 0.005. C and D, Representative Western blot analysis and quantification of BTM compound induced OPA-1 long forms (L) cleavage to short isoforms (S). HCT-116 Parental cells (+/+) and HCT-116 0MA1 −/− treated for 4 hours with BTM compounds; bar graph plotted as the average ± SEM, n = 3. ****, P < 0.0001. E and F, Western blot analysis and quantification of the ratio of the GAPDH normalized L1 OPA-1 to L2 isoforms in parental HCT-116 cells treated with compound for 30 minutes. Bar graph plotted as the Standardized Score calculated for each experiment. **, P < 0.005 (n = 3). G, Mitochondrial Membrane Potential in HCT-116 cells treated with 3 μmol/L BTM-3532, BTM-3528, and BTM-3566 for 4 hours then stained with TMRE and MTG. All images were quantified using merged channels indicating colocalization of the TMRE and MTG pixels. FCCP is a used as a positive control. H, Respirometry of HCT-116 cells treated with compounds for 30 minutes. All data are plotted as the mean ± SD (n = 3). I and J, Quantitation of the Basal, ATP linked, and uncoupled OCR rates (I) and bioenergetic efficiency in HCT-116 parental and OMA1 −/− cells (J). All data are the mean ± SD, n = 3, *, P < 0.01
Figure 4.
BTM compound treatment fragments the mitochondria and induces OPA1 cleavage in an OMA1 dependent manner. A, Representative images from HCT116 cells stained with mitotracker green (MTG) and subjected to live-cell imaging using confocal laser microscopy. B, Mitochondrial aspect ratio and form factor are reduced following treatment with BTM-3528. Aspect ratio and form factor are the average of 4 independent experiments, n = 5 cells and 50 to 70 mitochondria identified per cell, t test; ***, P < 0.005. C and D, Representative Western blot analysis and quantification of BTM compound induced OPA-1 long forms (L) cleavage to short isoforms (S). HCT-116 Parental cells (+/+) and HCT-116 0MA1 −/− treated for 4 hours with BTM compounds; bar graph plotted as the average ± SEM, n = 3. ****, P < 0.0001. E and F, Western blot analysis and quantification of the ratio of the GAPDH normalized L1 OPA-1 to L2 isoforms in parental HCT-116 cells treated with compound for 30 minutes. Bar graph plotted as the Standardized Score calculated for each experiment. **, P < 0.005 (n = 3). G, Mitochondrial Membrane Potential in HCT-116 cells treated with 3 μmol/L BTM-3532, BTM-3528, and BTM-3566 for 4 hours then stained with TMRE and MTG. All images were quantified using merged channels indicating colocalization of the TMRE and MTG pixels. FCCP is a used as a positive control. H, Respirometry of HCT-116 cells treated with compounds for 30 minutes. All data are plotted as the mean ± SD (n = 3). I and J, Quantitation of the Basal, ATP linked, and uncoupled OCR rates (I) and bioenergetic efficiency in HCT-116 parental and OMA1 −/− cells (J). All data are the mean ± SD, n = 3, *, P < 0.01
Figure 5. BTM compounds induce the ATF4 ISR via the OMA1-DELE1 mitochondrial quality control pathway. A, Western blot analysis of OMA1, OPA1, phospho-eIF2α, and ATF4 in parental, OMA1−/−, DELE1−/−, and OPA1ΔS1/ΔS1 BJAB cells following 4 hours of treatment with vehicle or 2 μmol/L BTM-3566. B, Cell death as quantified by Annexin-Propidium Iodide staining in OMA1−/−, DELE1−/−, and OPA1ΔS1Δ/S1 BJAB cells following treatment with 2 μmol/L BTM-3566 after 12, 24, and 48 hours of exposure. All data are plotted as the mean ± SD (n = 3). C, Western blot analysis of DELE1 isoforms in untransduced BJABwt (first lane) and BJAB DELE1.3xALFA cells treated with 2 μmol/L BTM3566 or oligomycin (OM) or BTM3532 for the indicated time. D, Western blot analysis of phospho-eIF2α and ATF4 levels in parental, HRI−/−; eIF2αSer49/Ser52 mutant and ATF4−/− BJAB cells following 4 hours of treatment with vehicle or 2 μmol/L BTM-3566. E, Cell death as assessed by Annexin-Propidium Iodide staining in parental, HRI−/−; eIF2αSer49/Ser52 mutant and ATF4−/− BJAB cells following treatment with 2 μmol/L BTM-3566 after 12, 24, and 48 hours of exposure. All data are plotted as the mean ± SD (n = 3). F, Immunoblot of c-Myc, CCND3, and MCL1 in parental, HRI−/−; eIF2αSer49/Ser52 mutant and ATF4−/− BJAB cells following 8 hours of treatment with vehicle or 2 μmol/L BTM-3566. G–J, Polysome profiles of parental (G); HRI−/− (H); eIF2αSer49/Ser52 (I), and ATF4−/− (J) treated with 2 μmol/L BTM-3566 or vehicle for 8 hours.
Figure 5.
BTM compounds induce the ATF4 ISR via the OMA1-DELE1 mitochondrial quality control pathway. A, Western blot analysis of OMA1, OPA1, phospho-eIF2α, and ATF4 in parental, OMA1−/−, DELE1−/−, and OPA1ΔS1/ΔS1 BJAB cells following 4 hours of treatment with vehicle or 2 μmol/L BTM-3566. B, Cell death as quantified by Annexin-Propidium Iodide staining in OMA1−/−, DELE1−/−, and OPA1ΔS1Δ/S1 BJAB cells following treatment with 2 μmol/L BTM-3566 after 12, 24, and 48 hours of exposure. All data are plotted as the mean ± SD (n = 3). C, Western blot analysis of DELE1 isoforms in untransduced BJABwt (first lane) and BJAB DELE1.3xALFA cells treated with 2 μmol/L BTM3566 or oligomycin (OM) or BTM3532 for the indicated time. D, Western blot analysis of phospho-eIF2α and ATF4 levels in parental, HRI−/−; eIF2αSer49/Ser52 mutant and ATF4−/− BJAB cells following 4 hours of treatment with vehicle or 2 μmol/L BTM-3566. E, Cell death as assessed by Annexin-Propidium Iodide staining in parental, HRI−/−; eIF2αSer49/Ser52 mutant and ATF4−/− BJAB cells following treatment with 2 μmol/L BTM-3566 after 12, 24, and 48 hours of exposure. All data are plotted as the mean ± SD (n = 3). F, Immunoblot of c-Myc, CCND3, and MCL1 in parental, HRI−/−; eIF2αSer49/Ser52 mutant and ATF4−/− BJAB cells following 8 hours of treatment with vehicle or 2 μmol/L BTM-3566. G–J, Polysome profiles of parental (G); HRI−/− (H); eIF2αSer49/Ser52 (I), and ATF4−/− (J) treated with 2 μmol/L BTM-3566 or vehicle for 8 hours.
Figure 6. FAM210B mRNA expression is correlated with and regulates cellular response to BTM compounds. A, BTM-3528 activity was assessed in 406 solid and hematopoietic tumor cell lines. Gene expression was correlated to AUC across 284 cell lines that found with gene expression data in the CCLE database. The data are expressed as the Spearman correlation coefficient versus the −logP value for each gene. B, Log2 expression of FAM210B in cell lines denoted as responsive or not to BTM-3528 (n = 284). Cells were classified as responder (AUC > 3.25) or nonresponder (AUC < 3.25) ***, P < 0.001. • Solid tumor lines; • Hematopoietic tumor lines; • B-cell lymphoma (BCL) lines. C, Waterfall plot of FAM210B mRNA expression data for screened cell lines. Data are plotted by descending standardized FAM210B expression level. D, FAM210B gene expression levels in normal human blood cells. All data from BioGPS (http://ds.biogps.org/?dataset=BDS_00001&gene=116151). E, Parental, FAM210B-tGFP, or HRI−/− BJAB cells were tested for sensitivity to BTM-3528, BTM-3566, BTM-3532, bortezomib, and FCCP. Cell death was determined by Annexin and YOYO staining. F, OPA1 cleavage was determined in HCT-116 parental and FAM210B-tGFP cells following a 3-hour treatment with 3 μmol/L BTM compounds.
Figure 6.
FAM210B mRNA expression is correlated with and regulates cellular response to BTM compounds. A, BTM-3528 activity was assessed in 406 solid and hematopoietic tumor cell lines. Gene expression was correlated to AUC across 284 cell lines that found with gene expression data in the CCLE database. The data are expressed as the Spearman correlation coefficient versus the −logP value for each gene. B, Log2 expression of FAM210B in cell lines denoted as responsive or not to BTM-3528 (n = 284). Cells were classified as responder (AUC > 3.25) or nonresponder (AUC < 3.25) ***, P < 0.001. • Solid tumor lines; • Hematopoietic tumor lines; • B-cell lymphoma (BCL) lines. C, Waterfall plot of FAM210B mRNA expression data for screened cell lines. Data are plotted by descending standardized FAM210B expression level. D, FAM210B gene expression levels in normal human blood cells. All data from BioGPS (http://ds.biogps.org/?dataset=BDS_00001&gene=116151). E, Parental, FAM210B-tGFP, or HRI−/− BJAB cells were tested for sensitivity to BTM-3528, BTM-3566, BTM-3532, bortezomib, and FCCP. Cell death was determined by Annexin and YOYO staining. F, OPA1 cleavage was determined in HCT-116 parental and FAM210B-tGFP cells following a 3-hour treatment with 3 μmol/L BTM compounds.

References

    1. Martínez-Reyes I, Chandel NS. Cancer metabolism: looking forward. Nat Rev Cancer 2021;21:669–80. - PubMed
    1. Mlynarczyk C, Fontán L, Melnick A. Germinal center-derived lymphomas: the darkest side of humoral immunity. Immunol Rev 2019;288:214–39. - PMC - PubMed
    1. Friedlander JE, Shen N, Zeng A, Korm S, Feng H. Failure to guard: mitochondrial protein quality control in cancer. Int J Mol Sci 2021;22:8306. - PMC - PubMed
    1. Jadiya P, Tomar D. Mitochondrial protein quality control mechanisms. Genes (Basel) 2020;11:563. - PMC - PubMed
    1. Quirós PM, Prado MA, Zamboni N, D'Amico D, Williams RW, Finley D, et al. . Multi-omics analysis identifies ATF4 as a key regulator of the mitochondrial stress response in mammals. J Cell Biol 2017;216:2027–45. - PMC - PubMed

Publication types

MeSH terms

Grants and funding