. 2023 Sep-Oct;20(5):433-447.
doi: 10.21873/cgp.20395.

Pan-cancer Analysis Reveals Cancer-dependent Expression of SOX17 and Associated Clinical Outcomes

Affiliations

Pan-cancer Analysis Reveals Cancer-dependent Expression of SOX17 and Associated Clinical Outcomes

L I Xu et al. Cancer Genomics Proteomics. 2023 Sep-Oct.

Abstract

Background/aim: SRY-box containing gene 17 (SOX17) plays a pivotal role in cancer onset and progression and is considered a potential target for cancer diagnosis and treatment. However, the expression pattern of SOX17 in cancer and its clinical relevance remains unknown. Here, we explored the relationship between the expression of SOX17 and drug response by examining SOX17 expression patterns across multiple cancer types.

Materials and methods: Single-cell and bulk RNA-seq analyses were used to explore the expression profile of SOX17. Analysis results were verified with qPCR and immunohistochemistry. Survival, drug response, and co-expression analyses were performed to illustrate its correlation with clinical outcomes.

Results: The results revealed that abnormal expression of SOX17 is highly heterogenous across multiple cancer types, indicating that SOX17 manifests as a cancer type-dependent feature. Furthermore, the expression pattern of SOX17 is also associated with cancer prognosis in certain cancer types. Strong SOX17 expression correlates with the potency of small molecule drugs that affect PI3K/mTOR signaling. FGF18, a gene highly relevant to SOX17, is involved in the PI3K-AKT signaling pathway. Single-cell RNA-seq analysis demonstrated that SOX17 is mainly expressed in endothelial cells and barely expressed in other cells but spreads to other cell types during the development of ovarian cancer.

Conclusion: Our study revealed the expression pattern of SOX17 in pan-cancer through bulk and single-cell RNA-seq analyses and determined that SOX17 is related to the diagnosis, staging, and prognosis of some tumors. These findings have clinical implications and may help identify mechanistic pathways amenable to pharmacological interventions.

Keywords: PI3K/mTOR; RNA-seq; SOX17; drug response; endometrial cancer; ovarian cancer; pan-cancer.


Conflict of interest statement

The Authors declare that there are no conflicts of interest regarding the publication of this paper.

Figures
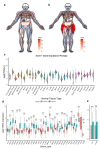
Figure 1
Figure 1. Expression of SOX17 mRNA in normal and tumor tissue retrieved from the GTEX, TCGA, and TARGET databases. (a, b) Anatogram image shows the expression of SOX17 mRNA in different organs. (c) Violin plot showing the expression and distribution of SOX17 mRNA in 29 normal tissue types. (d, e) Boxplot showing the expression of SOX17 mRNA in 35 tumor and paired normal tissue types, marked red and blue, respectively. Asterisks (*) indicate the statistical significance of gene expression between cancer and normal tissue: ns: non-significant, *p<0.05, **p<0.01, ***p<0.001, ****p<0.0001. The y-axis signifies the log2 mRNA expression of SOX17. GTEX: Genotype-Tissue Expression Project; TCGA: Cancer Genome Atlas; TARGET: Therapeutically Applicable Research to Generate Effective Treatments; ACC: adrenocortical carcinoma; BLCA: bladder urothelial carcinoma; BRCA: breast invasive carcinoma; CESC: cervical squamous cell carcinoma and endocervical adenocarcinoma; CHOL: cholangiocarcinoma; COAD: colon adenocarcinoma; DLBC: lymphoid neoplasm diffuse large B-cell lymphoma; ESCA: esophageal carcinoma; GBM: glioblastoma multiforme; HNSC: head and neck squamous cell carcinoma; KICH: kidney chromophobe; KIRC: kidney renal clear cell carcinoma; KIRP: kidney renal papillary cell carcinoma; LGG: brain lower grade glioma; LIHC: liver hepatocellular carcinoma; LUAD: lung adenocarcinoma; LUSC: lung squamous cell carcinoma; MESO: mesothelioma; OV: ovarian serous cystadenocarcinoma; PAAD: pancreatic adenocarcinoma; PCPG: pheochromocytoma and paraganglioma; PRAD: prostate adenocarcinoma; READ: rectum adenocarcinoma; SARC: sarcoma; SKCM: skin cutaneous melanoma; STAD: stomach adenocarcinoma; STES: stomach and esophageal carcinoma; TGCT: testicular germ cell tumors; THCA: thyroid carcinoma; THYM: thymoma; UCEC: uterine corpus endometrial carcinoma; UCS: uterine carcinosarcoma; UVM: ocular melanomas; ALL: acute lymphoblastic leukemia; LAML: acute myeloid leukemia.
Figure 2
Figure 2. Box plots showing significant differences in the expression and staging of SOX17 mRNA in UCEC and STAD tissue. The expression levels of SOX17 in (a) UCEC (p=1.835×10⁻⁸) and (b) STAD (p=0.01) was significantly different at different cancer stages. N represents the number of samples. UCEC: Uterine corpus endometrial carcinoma; STAD: stomach adenocarcinoma.
Figure 3
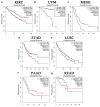
Figure 3. Overall survival (OS) curves demonstrating the correlation between the mRNA expression of SOX17 in different tumor types and patient OS. Curves were generated by performing KM survival analysis of samples with high and low expression levels of SOX17 in (a) KIRC, p=7×10⁻⁴, (b) UVM, p=0.00029, (c) MESO, p=0.00055, (d) STAD, p=0.016, (e) LUSC, p=0.031, (f) PAAD, p=0.035, and (g) READ, p=0.04. KIRC: Kidney renal clear cell carcinoma; UVM: ocular melanomas; MESO: mesothelioma; STAD: stomach adenocarcinoma; LUSC: lung squamous cell carcinoma; PAAD: pancreatic adenocarcinoma; READ: rectum adenocarcinoma.
Figure 4
Figure 4. mRNA expression and DNA methylation profile of SOX17 in tumor cell lines. Box plots showing the distribution of SOX17 expression in 23 cancer cell lines, with the methylation ratio of SOX17 at 1kb upstream of the TSS and log2 (TPM+1), indicated in red and blue, respectively. TSS: Transcription start site; TPM: transcripts per million.
Figure 5
Figure 5. The mRNA expression pattern of SOX17 in OV and UCEC. Real-time PCR analysis of SOX17 (a) in the ovarian cancer cell line A2780 (gray bar) versus normal ovary cell line IOSE-80 (black bar) and (b) in the UCEC cell line RL95-2 (gray bar) versus normal endometrial cell line CTCC-008-0014 (black bar). The expression is relative to GAPDH, *p<0.05, **p<0.01. (c, d) Immunohistochemistry analysis of SOX17 expression in OV and UCEC tissue (right) compared with that in normal tissue (left) in the Human Protein Atlas (antibody HPA068399). PCR: Polymerase chain reaction; OV: ovarian serous cystadenocarcinoma; UCEC: uterine corpus endometrial carcinoma.
Figure 6
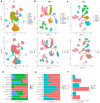
Figure 6. Cell typing in different cancers. (a-c) UMAP representation of LC (93,575 cells), CRC (44,684 cells), and OVC (45,115 cells). The figures are color-coded for cell type and sample origin separately. (d) Bar plots representing the percentage of cells per cancer type. (e) Bar plots representing the cell fraction per tissue origin. (f) Bar plots representing the cell amount originating from different cancer types and matched normal tissue. UMAP: Uniform manifold approximation and projection; LC: lung cancer; CRC: colorectal cancer; OVC: ovarian cancer.
Figure 7
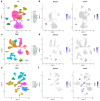
Figure 7. Expression patterns of SOX17 in different cell types. (a, c, e) UMAP plots color-coded for different cell types in LC, CRC, and OVC. (b) Per-cell expression level of SOX17 in LC and paired normal samples visualized as a UMAP plot. (d) UMAP plot representing SOX17 expression level per cell in CRC and paired normal samples. (f) UMAP plot representing SOX17 expression pattern per cell in OVC and paired normal samples. UMAP: Uniform manifold approximation and projection; LC: lung cancer; CRC: colorectal cancer; OVC: ovarian cancer.
Figure 8
Figure 8. Drug response and co-expression analysis of SOX17. (a) The volcano map shows the most significant associations between SOX17 expression and drug response. Each dot represents Pearson’s correlation coefficient and -log10(p-Value). The red and blue dots represent significant positive and negative correlations, respectively, with p<0.05. (b) The network diagram shows the regulation of the co-expressed genes and transcription factors of SOX17. Red, yellow, and blue circles represent correlation coefficients of >0.6, 0.5, and 0.4, respectively. The purple circle represents upstream transcription factor regulation.

Similar articles

Cited by

References

    1. Grimm D, Bauer J, Wise P, Krüger M, Simonsen U, Wehland M, Infanger M, Corydon TJ. The role of SOX family members in solid tumours and metastasis. Semin Cancer Biol. 2020;67:122–153. doi: 10.1016/j.semcancer.2019.03.004. - DOI - PubMed
    1. Engert S, Burtscher I, Liao WP, Dulev S, Schotta G, Lickert H. Wnt/β-catenin signalling regulates Sox17 expression and is essential for organizer and endoderm formation in the mouse. Development. 2013;140(15):3128–3138. doi: 10.1242/dev.088765. - DOI - PubMed
    1. Séguin CA, Draper JS, Nagy A, Rossant J. Establishment of Endoderm Progenitors by SOX Transcription Factor Expression in Human Embryonic Stem Cells. Cell Stem Cell. 2008;3(2):182–195. doi: 10.1016/j.stem.2008.06.018. - DOI - PubMed
    1. Irie N, Weinberger L, Tang WW, Kobayashi T, Viukov S, Manor YS, Dietmann S, Hanna JH, Surani MA. SOX17 is a critical specifier of human primordial germ cell fate. Cell. 2015;160(1-2):253–268. doi: 10.1016/j.cell.2014.12.013. - DOI - PMC - PubMed
    1. Kim I, Saunders TL, Morrison SJ. Sox17 dependence distinguishes the transcriptional regulation of fetal from adult hematopoietic stem cells. Cell. 2007;130(3):470–483. doi: 10.1016/j.cell.2007.06.011. - DOI - PMC - PubMed

Substances