. 2023 Aug 29;14(1):5270.
doi: 10.1038/s41467-023-40940-4.

Effects of public-health measures for zeroing out different SARS-CoV-2 variants

Affiliations

Effects of public-health measures for zeroing out different SARS-CoV-2 variants

Yong Ge et al. Nat Commun. .

Abstract

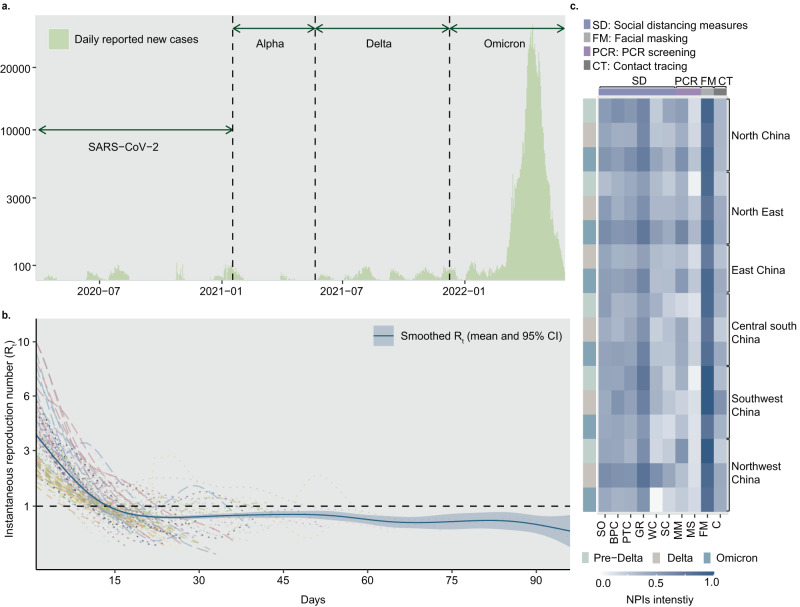
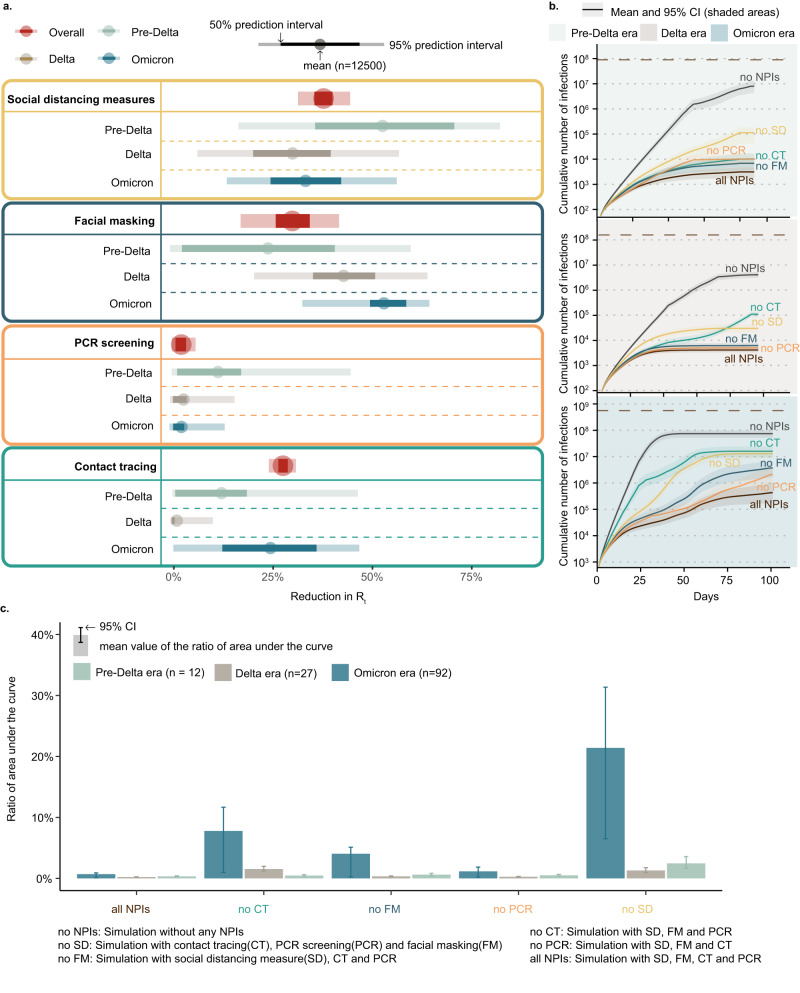
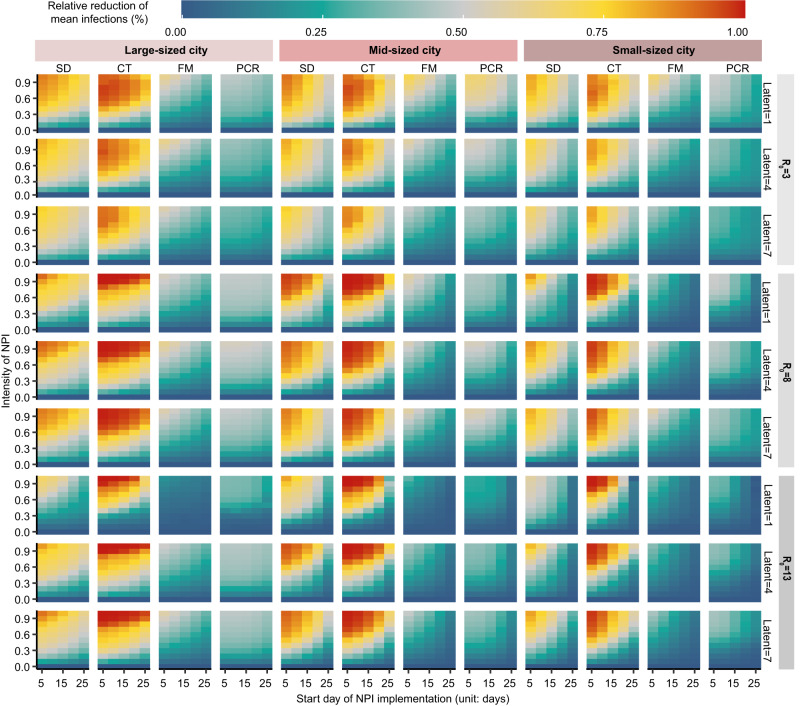
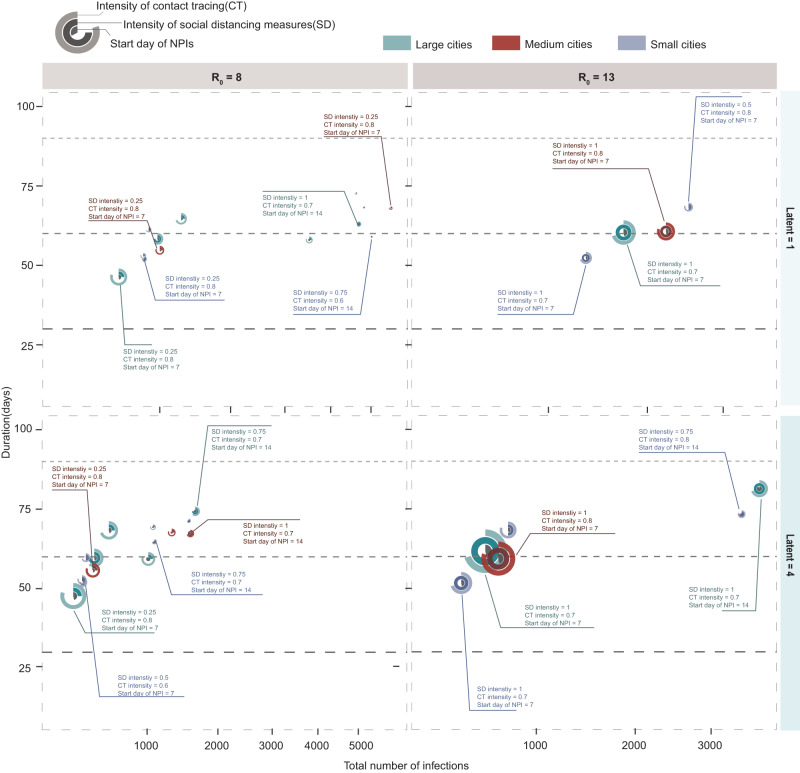
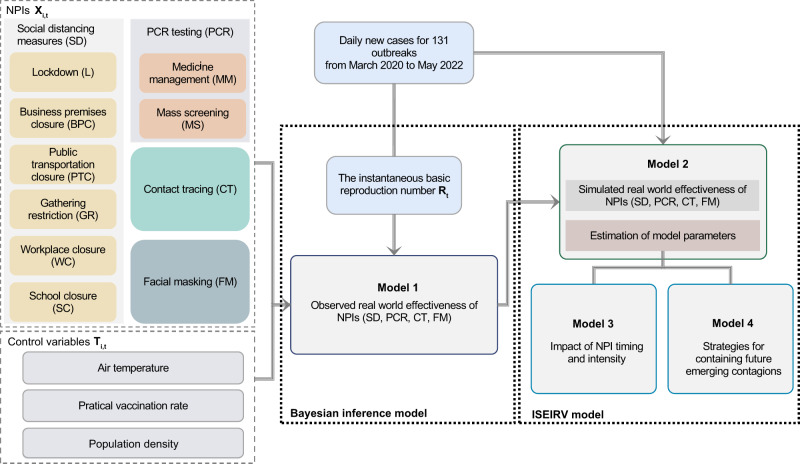
Targeted public health interventions for an emerging epidemic are essential for preventing pandemics. During 2020-2022, China invested significant efforts in strict zero-COVID measures to contain outbreaks of varying scales caused by different SARS-CoV-2 variants. Based on a multi-year empirical dataset containing 131 outbreaks observed in China from April 2020 to May 2022 and simulated scenarios, we ranked the relative intervention effectiveness by their reduction in instantaneous reproduction number. We found that, overall, social distancing measures (38% reduction, 95% prediction interval 31-45%), face masks (30%, 17-42%) and close contact tracing (28%, 24-31%) were most effective. Contact tracing was crucial in containing outbreaks during the initial phases, while social distancing measures became increasingly prominent as the spread persisted. In addition, infections with higher transmissibility and a shorter latent period posed more challenges for these measures. Our findings provide quantitative evidence on the effects of public-health measures for zeroing out emerging contagions in different contexts.


Conflict of interest statement

The authors declare no competing interests.

Figures

Fig. 1
Fig. 1. COVID-19 outbreaks and interventions in China during zero-COVID policy under Pre-Delta, Delta, and Omicron periods.
a Daily new cases reported during the 131 outbreaks in mainland China, from April, 2020 to May, 2021. The green arrows mark the predominant strains within each stage of the pandemic. b Estimated instantaneous reproduction number (Rt) for each outbreak, aligned with the start date of each outbreak. The solid blue line illustrates the estimated overall Rt for 131 outbreaks, while the blue shaded area indicated its 95% confidence interval (95%CI). c Heat map of mean intensity level of interventions for different variants and geographic regions of China. The color bar on the left side of the heat map represents the variant of each outbreak, green for Pre-Delta period, brown for Delta period and blue for Omicron period. The x axis shows the abbreviations of non-pharmaceutical measures, including stay-at-home order (SO), business premises closure (BPC), public transportation closure (PTC), gathering restriction (GR), workplace closure (WC), school closure (SC), medicine management (MM), mass screening (MS), facial masking (FM) and contact tracing (CT). We divided the 10 NPIs into four categories: social distancing measures (SD), polymerase chain reaction screening (PCR), contact tracing (CT), and facial masking (FM). The color bar above the heat map represents the category to which each individual measure belongs.
Fig. 2
Fig. 2. The relative effects of interventions in containing different SARS-CoV-2 variants.
a The overall effects were estimated by the coefficient of each individual NPI in Bayesian inference models. Reductions in Rt were shown as mean, 50%, and 95% prediction intervals. PCR screening showed the joint effect of mass screening and medicine management (generic antipyretics, not specific drugs for COVID-19). Social distancing measures represented the joint effect of stay-at-home order, business premises closure, public transportation closure, gathering restriction, workplace closure, and school closure. b Infections simulated by Intervention-SEIR-Vaccination (ISEIRV) model under all real-world NPIs (curves in brown) or in counterfactual scenarios where social distancing measures (SD), facial mask (FM), contact tracing (CT), PCR screening (PCR), or all NPIs were not implemented, respectively. Mean and 95% confidence intervals (CI, shaded areas) are presented. The brown dashed lines are the total population of cities with outbreaks of each variant. The gap between the simulated curve without each NPI and the red curve represents the effect of each removed NPI in containing the spread. The wider the gap, the higher the effect of NPIs. c The ratio of the area under the cumulative infection curve for the corresponding scenario (with one NPI removed) to the area under the baseline scenario curve (with all NPIs removed). The closer it gets to 100% indicates the more effective the removed NPI is for the respective variant.
Fig. 3
Fig. 3. The relative reduction of infections of emerging pathogens under different scenarios of transmissibility, interventions, and population sizes.
Relative reduction of mean infections is the daily mean infections for each scenario, relative to the baseline counterfactual scenario without any interventions. A value closer to 1 (red) indicates fewer infections for a scenario, corresponding to a more effective implementation of NPIs. The values show simulated transmission under different R0 values and latent periods in large cities (LC, over 10 million residents), medium cities (MC, 5–10 million residents) and small cities (SC, 0–5 million residents). In each small heatmap, the x axis is the start day of NPI implementation for each outbreak and the y axis is the intensity of NPI. The results shown here are the independent effect of social distancing measures (SD), contact tracing (CT), facial masks (FM), and PCR screening (PCR), respectively, meaning that if one NPI was in place, all other interventions were not implemented.
Fig. 4
Fig. 4. Effectiveness of combined interventions in cities with different population sizes and transmission scenarios.
The x axis represents the mean value of the total number of infections in the corresponding size of cities, while the y axis represents the mean value of the durations in the corresponding size of cities. The rings of each combination represent the start day of NPI implementation for each outbreak (innermost ring), social distancing intensity (middle ring), and contact tracing intensity (outer ring), respectively. The green, red, and blue colors correspond to large cities (LC), medium cities (MC), and small cities (SC). We considered each combination to be effective when it is valid for more than three cities in parallel. We assumed a 50% probability that an individual wears a mask when in contact with an infected person during outbreaks, considering feasibility and generalizability to the other countries/areas. The simulation results of other scenarios are available in supplementary (See Supplementary Figs. 16–38).
Fig. 5
Fig. 5. Schematic flowchart of data and models for this study.
A prior on the basic reproduction number R0,v was used for each outbreak, with a hyperprior varying by SARS-CoV-2 lineages (see Supplementary Table 5). Then, we estimated the instantaneous reproduction number (Rt) based on the observed daily new cases. By comparing observed Rt with R0,v in a Bayesian inference model, we estimated the coefficients of variables to assess their effects on curbing COVID-19. Ten NPIs were divided into four categories: social distancing measures (yellow), polymerase chain reaction screening (red), contact tracing (green), and facial masking (blue). Finally, an Infectious-Intervention-SEIR-Vaccination (ISEIRV) model was built to simulate the timing and intensity of NPI implementation and elimination strategies under diverse transmission scenarios. The prior information for parameter estimation within the ISEIRV model was informed by the effectiveness of each NPI category.

Similar articles

Cited by

References

    1. Public health measures in disease prevention. Science337, 1468–1470 (2012). - PubMed
    1. Nadeau, S. A. et al. Swiss public health measures associated with reduced SARS-CoV-2 transmission using genome data. Sci. Transl. Med.15, eabn7979 (2023). - PMC - PubMed
    1. Bootsma MCJ, Ferguson NM. The effect of public health measures on the 1918 influenza pandemic in U.S. cities. Proc. Natl Acad. Sci. 2007;104:7588–7593. - PMC - PubMed
    1. Nussbaumer-Streit, B. et al. Quarantine alone or in combination with other public health measures to control COVID-19: a rapid review. Cochrane Database Syst. Rev.4, CD013574 (2020). - PMC - PubMed
    1. Mallapaty S. China is relaxing its zero-COVID policy — here’s what scientists think. Nature. 2022;612:383–384. - PubMed

Publication types

Supplementary concepts