. 2023 Aug 29;9(1):90.
doi: 10.1038/s41421-023-00583-7.

Cell type-specific NRBF2 orchestrates autophagic flux and adult hippocampal neurogenesis in chronic stress-induced depression

Affiliations

Cell type-specific NRBF2 orchestrates autophagic flux and adult hippocampal neurogenesis in chronic stress-induced depression

Shao-Qi Zhang et al. Cell Discov. .

Abstract

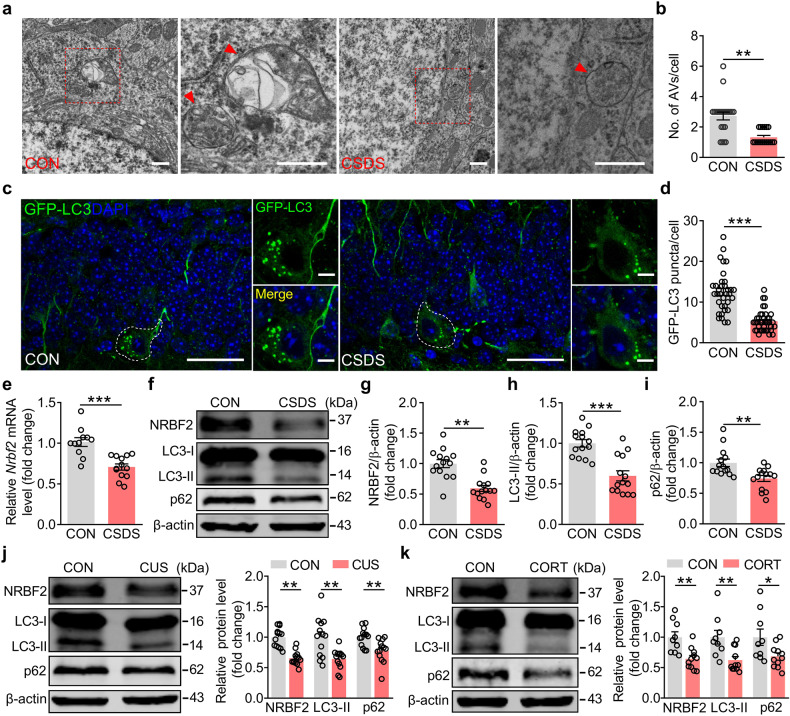
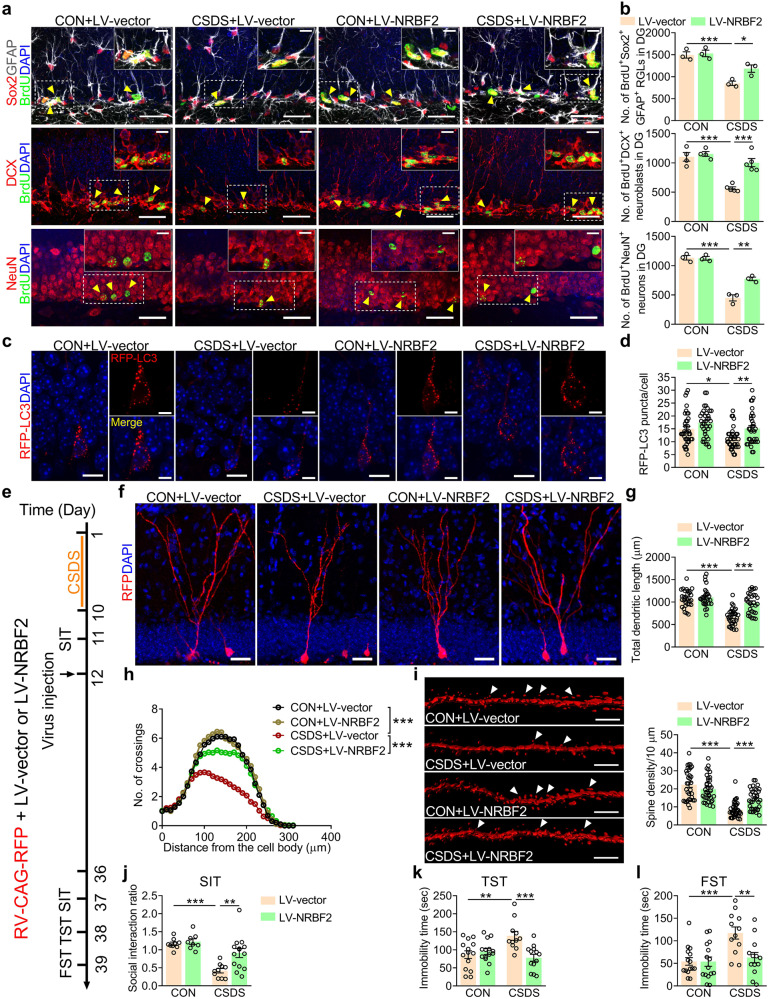
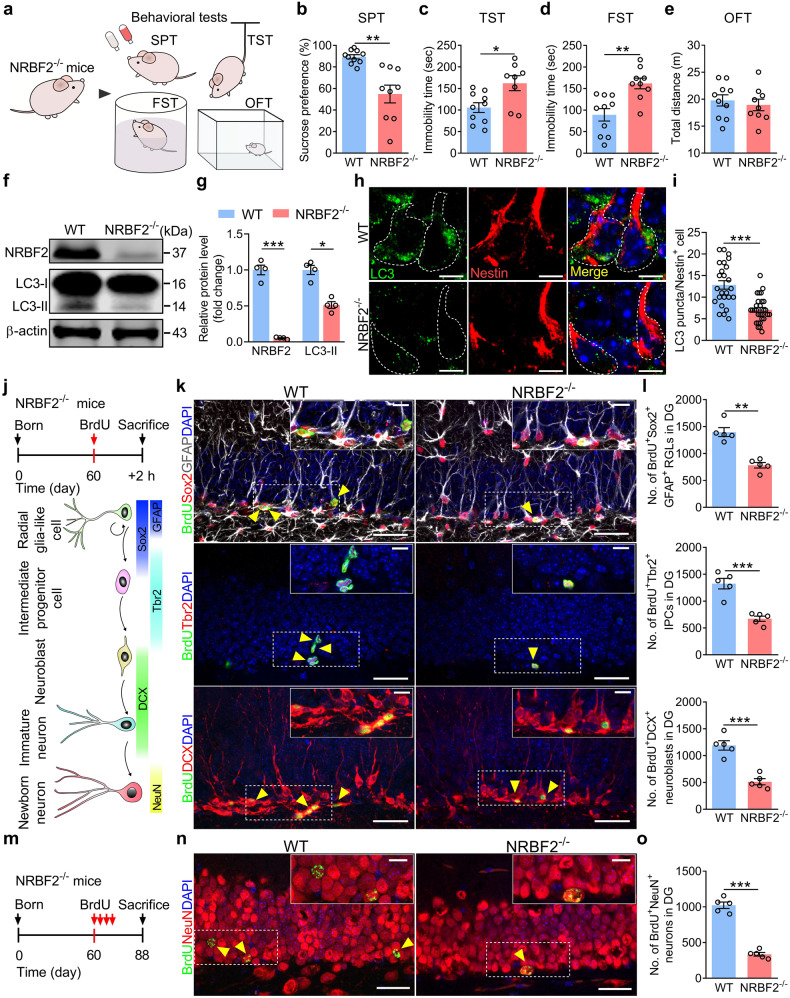
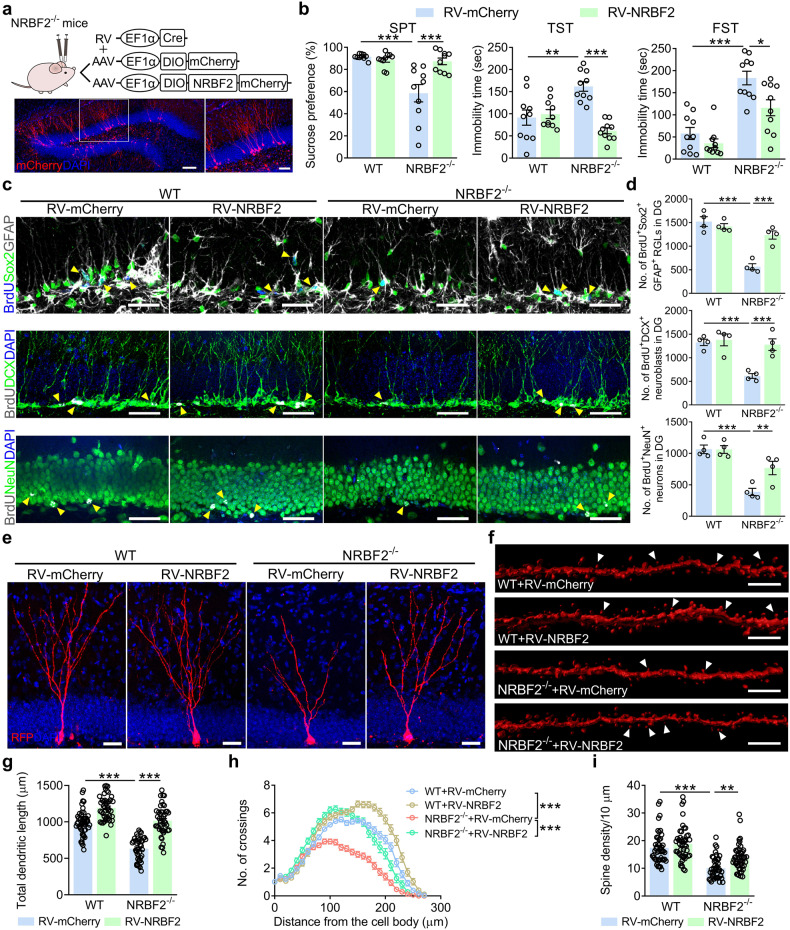
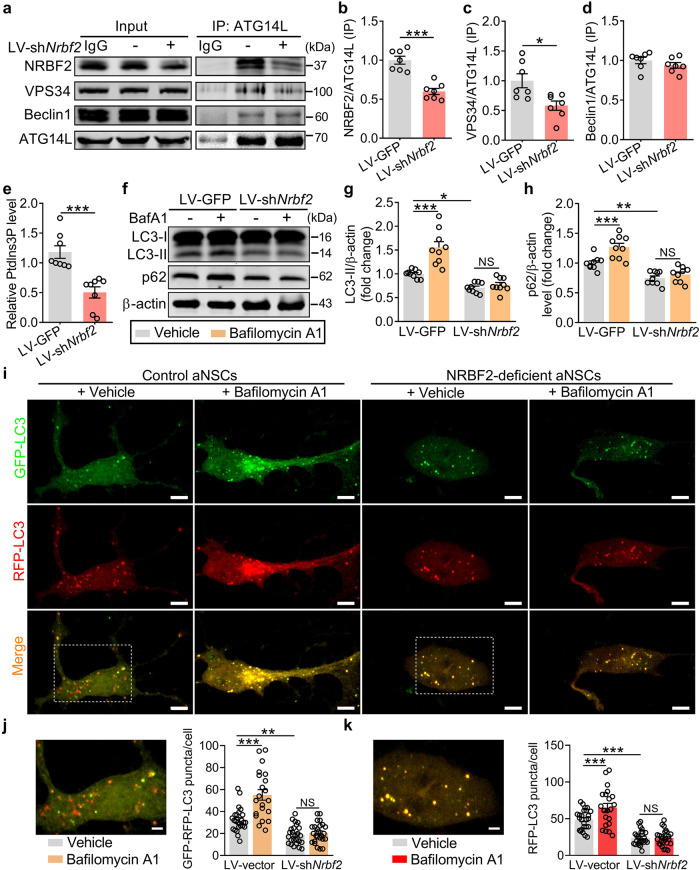
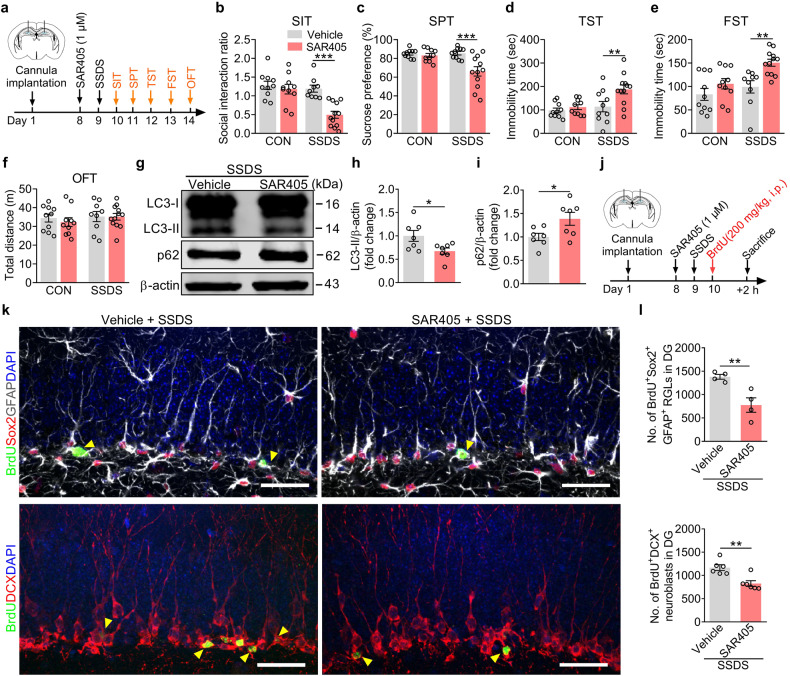
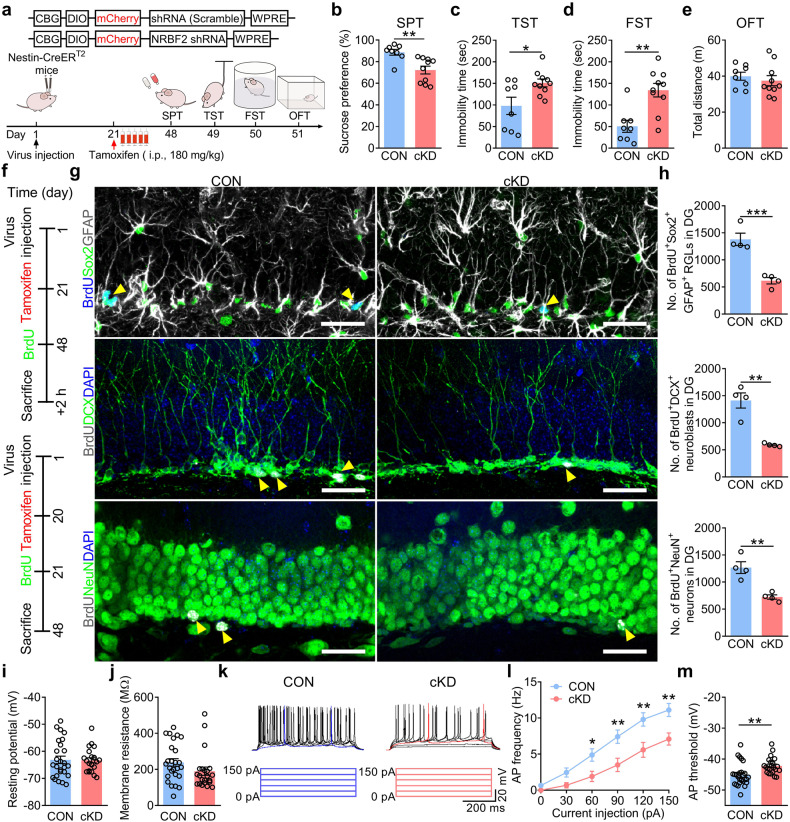
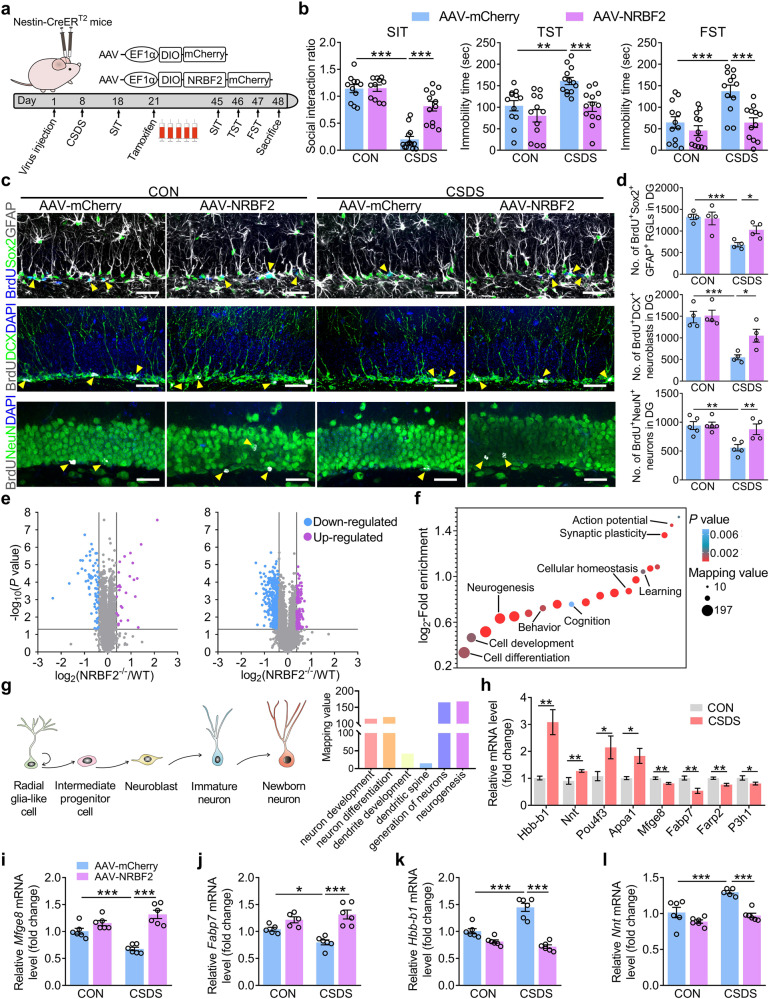
Dysfunctional autophagy and impairment of adult hippocampal neurogenesis (AHN) each contribute to the pathogenesis of major depressive disorder (MDD). However, whether dysfunctional autophagy is linked to aberrant AHN underlying MDD remains unclear. Here we demonstrate that the expression of nuclear receptor binding factor 2 (NRBF2), a component of autophagy-associated PIK3C3/VPS34-containing phosphatidylinositol 3-kinase complex, is attenuated in the dentate gyrus (DG) under chronic stress. NRBF2 deficiency inhibits the activity of the VPS34 complex and impairs autophagic flux in adult neural stem cells (aNSCs). Moreover, loss of NRBF2 disrupts the neurogenesis-related protein network and causes exhaustion of aNSC pool, leading to the depression-like phenotype. Strikingly, overexpressing NRBF2 in aNSCs of the DG is sufficient to rescue impaired AHN and depression-like phenotype of mice. Our findings reveal a significant role of NRBF2-dependent autophagy in preventing chronic stress-induced AHN impairment and suggest the therapeutic potential of targeting NRBF2 in MDD treatment.


Conflict of interest statement

The authors declare no competing interests.

Figures

Fig. 1
Fig. 1. Chronic stress induces a decrease in NRBF2 level in the dentate gyrus of adult mice.
a, b Representative electron micrographs (a) and quantification (b) of autophagic vacuoles (AVs) in the DG of control (CON) and CSDS-exposed mice (n = 18–22 cells per group). Higher magnification views of selected regions (red square). Red arrows indicate autophagic vacuoles. Scale bars, 0.5 μm. c, d Representative images (c) and quantification (d) of GFP-LC3 puncta in the DG (n = 35–38 cells per group). White outlines represent GFP-LC3+ cells. Scale bars, 30 μm (overview) and 5 μm (zoom). e Quantitative PCR results showing the Nrbf2 mRNA level in the DG (n = 11–13 mice per group). fi Representative images of western blotting (f) and quantification of NRBF2 (g), LC3-II (h), and p62 (i) protein expression in the DG (n = 14 mice per group). j, k Western blotting analysis of NRBF2, LC3-II, and p62 protein expression in the DG of control, CUS- or CORT-treated mice (n = 9–13 mice per group). Data are presented as means ± SEM and analyzed by two-sided unpaired t-test (b, d, e, gk). *P < 0.05, **P < 0.01, and ***P < 0.001.
Fig. 2
Fig. 2. Overexpression of NRBF2 in the DG improves CSDS-induced AHN impairment and depression-like behavior of mice.
a Representative images of BrdU+Sox2+GFAP+ RGLs, BrdU+DCX+ neuroblasts, and BrdU+NeuN+ neurons in the DG of control and CSDS-exposed mice treated with LV-vector or LV-NRBF2. Higher magnification views of selected regions (white rectangle). Yellow arrows indicate BrdU+ and marker+ cells. Scale bars, 30 μm (overview) and 10 μm (inset). b Quantification of BrdU+Sox2+GFAP+ RGLs, BrdU+DCX+ neuroblasts, and BrdU+NeuN+ neurons in the DG (n = 3–5 mice per group). c, d Representative image (c) and quantification (d) of RFP-LC3 puncta in the DG (n = 32–36 cells per group). Scale bars, 10 μm (overview) and 5 μm (zoom). e Timeline of experiments. fh Representative images (f) and quantification of dendritic length (g) and dendritic complexity (h) in RFP+ newborn neurons (n = 29–33 cells per group). Scale bars, 30 μm. i Representative images and quantification of dendritic spine density of newborn neurons (n = 33–37 segments per group). White arrows indicating spines. Scale bars, 5 μm. jl Behavioral tests of SIT (j), TST (k), and FST (l) in control and CSDS-exposed mice treated with LV-vector or LV-NRBF2 (n = 8–15 mice per group). Data are presented as means ± SEM and analyzed by two-way ANOVA followed by Bonferroni’s post hoc test (b, d, g, il) or repeated measures ANOVA (h). *P < 0.05, **P < 0.01, and ***P < 0.001.
Fig. 3
Fig. 3. NRBF2 deletion inhibits AHN and leads to depression-like behavior in mice.
a Experimental paradigms for behavioral tests. be Behavioral tests of SPT (b), TST (c), FST (d), and OFT (e) in WT and NRBF2−/− mice (n = 8–10 mice per group). f, g Representative images (f) and quantification (g) of NRBF2 and LC3-II protein expression in the DG (n = 4 mice per group). h, i Representative images (h) and quantification (i) of LC3 puncta within the soma of Nestin+ cells in the DG (n = 25–29 cells per group). White outlines represent the soma of Nestin+ cells. LC3 (green), Nestin (red), and DAPI (blue). Scale bars, 5 μm. j A schematic diagram of the experimental design of a 2-h BrdU (200 mg/kg, i.p.) pulse-chase (upper). A schematic diagram of cell lineage-specific markers during AHN (bottom). k, l Representative images (k) and quantification (l) of BrdU+Sox2+GFAP+ RGLs, BrdU+Tbr2+ IPCs, and BrdU+DCX+ neuroblasts in the DG (n = 5 mice per group). Higher magnification views of selected regions (white rectangle). Yellow arrows indicate BrdU+ and marker+ cells. Scale bars, 30 μm (overview) and 10 μm (inset). m A schematic diagram of the experimental design of a 30-day BrdU pulse-chase. n, o Representative images (n) and quantification (o) of BrdU+NeuN+ neurons in the DG (n = 5 mice per group). Higher magnification views of selected regions (white rectangle). Yellow arrows indicate BrdU+NeuN+ neurons. Scale bars, 30 μm (overview) and 10 μm (inset). Data are presented as means ± SEM and analyzed by two-sided unpaired t-test (be, g, i, l, o). *P < 0.05, **P < 0.01, and ***P < 0.001.
Fig. 4
Fig. 4. Overexpression of NRBF2 in aNSCs rescues the impaired AHN and depression-like phenotype of NRBF2 knockout mice.
a A combinative use of RV-EF1α-Cre and AAV-EF1α-DIO-NRBF2-mCherry was applied for selective overexpression of NRBF2 in aNSCs of DG (upper). Representative image of mCherry expression in the DG (bottom). Higher magnification views of selected regions (white square). Scale bars, 100 μm (overview) and 50 μm (zoom). b Behavioral tests of SPT, TST, and FST on WT and NRBF2−/− mice treated with RV-mCherry or RV-NRBF2 (n = 10 mice per group). c Representative images of BrdU+Sox2+GFAP+ RGLs, BrdU+DCX+ neuroblasts, and BrdU+NeuN+ neurons in the DG. Yellow arrows indicate BrdU+ and marker+ cells. Scale bars, 30 μm. d Quantification of BrdU+Sox2+GFAP+ RGLs, BrdU+DCX+ neuroblasts, and BrdU+NeuN+ neurons in the DG (n = 4 mice per group). e Representative images of mCherry+ newborn neurons. Scale bars, 30 μm. f Representative images of the dendritic spine. White arrows indicate spines. Scale bars, 5 μm. g, h Quantification of the dendritic length (g) and dendritic complexity (h) of mCherry+ newborn neurons (n = 41–49 cells per group). i Quantification of dendritic spine density of mCherry+ newborn neurons (n = 44–48 segments per group). Data are presented as means ± SEM and analyzed by two-way ANOVA followed by Bonferroni’s post hoc test (b, d, g, i) or repeated measures ANOVA (h). *P < 0.05, **P < 0.01, and ***P < 0.001.
Fig. 5
Fig. 5. NRBF2 deficiency impairs the autophagosome formation and neurogenesis of aNSCs.
ad Immunoprecipitation (IP) and western blotting analysis (a) of the interaction between NRBF2 (b), VPS34 (c), and Beclin1 (d) with ATG14L in control and NRBF2-deficient aNSCs (n = 7 independent experiments per group). e Quantification of ATG14L-immunoprecipitated VPS34 kinase activity (n = 8 independent experiments per group). fh Representative images of western blotting analysis (f) and quantification of LC3-II (g) and p62 (h) in control and NRBF2-deficient aNSCs treated with vehicle (0.1% DMSO) or bafilomycin A1 (BafA1) (n = 9 independent experiments per group). ik Representative images (i) and quantitation of GFP-RFP-LC3 puncta (j) or RFP-LC3 puncta (k) (n = 21–25 cells per group). Higher magnification views of selected regions (white rectangle). Scale bars, 5 μm (overview) and 2 μm (zoom). Data are presented as means ± SEM and analyzed by two-sided unpaired t-test (be) or two-way ANOVA followed by Bonferroni’s post hoc test (g, h, j, k). *P < 0.05, **P < 0.01, and ***P < 0.001. NS indicates no significant difference.
Fig. 6
Fig. 6. Selective VPS34 inhibitor SAR405 facilitates AHN impairment and the susceptibility of mice to stress.
a Timeline of experiments. bf Behavioral tests of SIT (b), SPT (c), TST (d), FST (e), and OFT (f) in control and SSDS-treated mice that microinjected with vehicle or SAR405 into DG (n = 10–12 mice per group). gi Western blotting analysis (g) and quantifications of LC3-II (h) and p62 (i) protein expression in the DG (n = 7 mice per group). j Timeline of experiments. k Representative images of BrdU+Sox2+GFAP+ RGLs and BrdU+DCX+ neuroblasts in the DG. Yellow arrows indicate BrdU+ and marker+ cells. Scale bars, 30 μm. l Quantification showing the number of BrdU+Sox2+GFAP+ RGLs and BrdU+DCX+ neuroblasts in the DG (n = 4–6 mice per group). Data are presented as means ± SEM and analyzed by two-sided unpaired t-test (h, i, l) or two-way ANOVA followed by Bonferroni’s post hoc test (bf). *P < 0.05, **P < 0.01, and ***P < 0.001.
Fig. 7
Fig. 7. Conditional knockdown of NRBF2 in aNSCs induces AHN impairment and depression-like phenotype of mice.
a Schematic diagram showing the experimental strategy of NRBF2 conditional knockdown (cKD) (upper). Timeline of experiments (bottom). be Behavioral tests of SPT (b), TST (c), FST (d), and OFT (e) in Nestin-CreERT2 mice treated with AAV-mCherry or AAV-shNrbf2 (n = 8–10 mice per group). f Timeline of experiments. g, h Representative images (g) and quantification (h) of BrdU+Sox2+GFAP+ RGLs, BrdU+DCX+ neuroblasts, and BrdU+NeuN+ neurons in the DG (n = 4 mice per group). Yellow arrows indicate BrdU+ and marker+ cells. Scale bars, 30 μm. i, j Summarized data of the resting potential (i), and membrane resistance (j) of newborn neurons in the DG (n = 22–26 cells per group). k Representative spiking pattern of newborn neurons in response to current injection of 0–150 pA. l, m Quantification of the frequency of action potential elicited by current injection (l) and the threshold required for the first elicited action potential (m) (n = 22–26 cells per group). Data are presented as means ± SEM and analyzed by two-sided unpaired t-test (be, hj, m) or two-way ANOVA followed by Bonferroni’s post hoc test (l). *P < 0.05, **P < 0.01, and ***P < 0.001.
Fig. 8
Fig. 8. Overexpression of NRBF2 in aNSCs rescues disrupted neurogenesis-related protein network of DG induced by chronic stress.
a Timeline of experiments. b Behavioral tests of SIT, TST, and FST on control and CSDS-exposed mice treated with AAV-mCherry or AAV-NRBF2 in DG aNSCs (n = 11–13 mice per group). c, d Representative images (c) and quantification (d) of BrdU+Sox2+GFAP+ RGLs, BrdU+DCX+ neuroblasts, and BrdU+NeuN+ neurons in the DG (n = 4–5 mice per group). Yellow arrows indicate BrdU+ and marker+ cells. Scale bars, 30 μm. e A total of 98/6791 proteins and 563/3374 phosphopeptides were statistically up- or downregulated in NRBF2−/− mice (n = 3 mice per group). f The significant changes in expression or phosphorylation of proteins induced by NRBF2 deletion were most dominantly enriched in biological processes that involved neurogenesis, action potential, and synaptic plasticity. g A schematic diagram of each phase during adult hippocampal neurogenesis (left). Numbers in histograms are mapping values, i.e., the sum of phosphopeptides involved in neurogenesis (right). h CSDS upregulated the level of Hbb-b1, Nnt, Pou4f3, and Apoa1 mRNA, but downregulated the level of Mfge8, Fabp7, Farp2, and P3h1 mRNA in the DG (n = 5–8 mice per group). il The level of Mfge8 (i), Fabp7 (j), Hbb-b1 (k), and Nnt (l) mRNA in the DG of control and CSDS-exposed mice treated with AAV-mCherry or AAV-NRBF2 (n = 5–6 mice per group). Data are presented as means ± SEM and analyzed by two-way ANOVA followed by Bonferroni’s post hoc test (b, d, il) or two-sided unpaired t-test (h), or Fisher’s exact test (eg). *P < 0.05, **P < 0.01, and ***P < 0.001.

Similar articles

Cited by

References

    1. GBD 2017 Disease and Injury Incidence and Prevalence Collaborators Global, regional, and national incidence, prevalence, and years lived with disability for 354 diseases and injuries for 195 countries and territories, 1990-2017: a systematic analysis for the Global Burden of Disease Study 2017. Lancet. 2018;392:1789–1858. - PMC - PubMed
    1. Holtzheimer PE, Mayberg HS. Stuck in a rut: rethinking depression and its treatment. Trends Neurosci. 2011;34:1–9. - PMC - PubMed
    1. Boldrini M, et al. Hippocampal granule neuron number and dentate gyrus volume in antidepressant-treated and untreated major depression. Neuropsychopharmacology. 2013;38:1068–1077. - PMC - PubMed
    1. Lucassen PJ, Stumpel MW, Wang Q, Aronica E. Decreased numbers of progenitor cells but no response to antidepressant drugs in the hippocampus of elderly depressed patients. Neuropharmacology. 2010;58:940–949. - PubMed
    1. Boldrini M, et al. Resilience is associated with larger dentate gyrus, while suicide decedents with major depressive disorder have fewer granule neurons. Biol. Psychiatry. 2019;85:850–862. - PMC - PubMed

LinkOut - more resources