. 2023 Aug 29;13(1):14111.
doi: 10.1038/s41598-023-41126-0.

Ocular steroidome in human eyes and in eyes with complex central serous chorioretinopathy (CSCR)

Affiliations

Ocular steroidome in human eyes and in eyes with complex central serous chorioretinopathy (CSCR)

Marta Zola et al. Sci Rep. .

Abstract

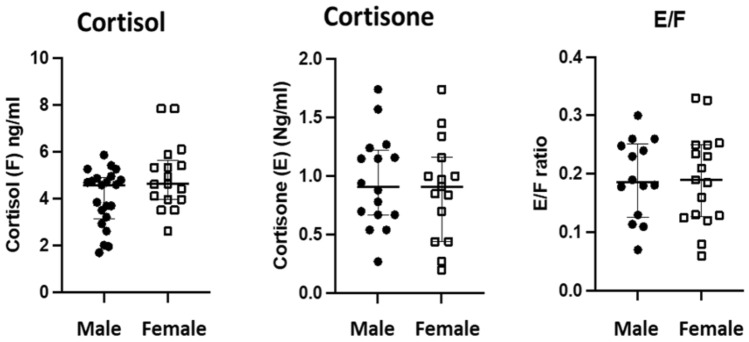
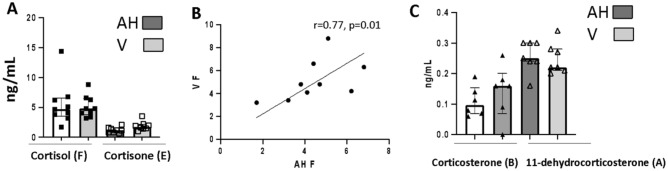
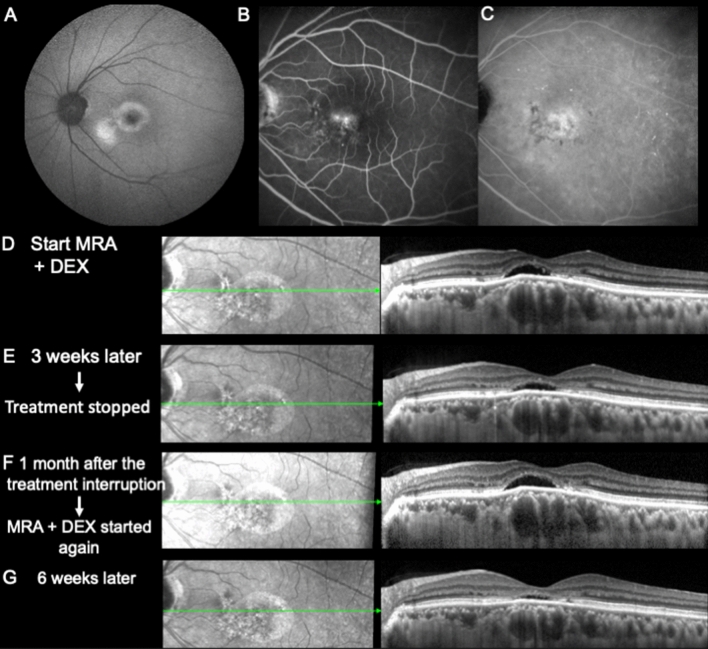
The exact link between systemic and ocular endogenous corticoids (steroidome) is unclear and whether the ocular steroidome is altered in CSCR eyes is unknown. The aims of this study were to analyze the human steroidome in the aqueous humor as a function of age, sex and time of the day, to correlate systemic and ocular steroidome and to analyze the ocular steroidome in long lasting complex inactive CSCR. Based on our results, we present two CSCR cases treated by the combination of oral mineralocorticoid antagonist and glucocorticoids drops. In a cross-sectional study, aqueous humor (AH) was collected between 8am and 6 pm from 50 unaffected individuals (25 men and 25 women) and from 14 patients with chronic CSCR, during cataract surgery. In addition, simultaneous serum and AH were collected from 27 individuals undergoing cataract surgery and, simultaneous AH and vitreous were collected from 9 patients undergoing cataract and vitrectomy to estimate corticoids levels in the different compartments. The steroidome was determined using a LC-MS/MS method that quantifies 13 endogenous corticoids from the gluco, mineralocorticoid and androgen pathways. In AH and vitreous, the highest corticoid level is reached by cortisol (F), that represents less than 10% of F serum level. The cortisol levels in the serum did not correlate with ocular cortisol levels. Serum and ocular cortisone (E) levels correlate, although less than 5% of circulating E reaches the eye. The only mineralocorticoids measured in the AH were corticosterone (B) and its inactive form, the 11-desoxycorticosterone (A). There was no influence of circadian rhythm on cortisol ocular levels and there was no correlation between the age or the sex and the level of F, E, A, and B. In eyes with chronic inactive CSCR, the levels of the active glucocorticoid form F was lower than in control eyes and the F/E ratio was reduced by 50% but the B/A ratio was higher indicating imbalance towards active mineralocorticoids. Base on this observation, we propose to combine an antagonist of the mineralocorticoid receptor together with topical glucocorticoids in two CSCR patients, resistant to all other treatments, with favorable outcome. Our results indicate that the ocular psteroidome is highly regulated suggesting a local metabolism of ocular corticoids. In eyes with long-lasting complex inactive CSCR, the steroidome analysis shows lower active glucocorticoids and higher active mineralocorticoids.


Conflict of interest statement

The authors declare no competing interests.

Figures

Figure 1
Figure 1
Corticoid metabolism. Corticoid metabolic pathways in the adrenal gland leading to glucocorticoids, mineralocorticoids and androgens synthesis. In green, F (cortisol) and B (corticosterone) are active forms, they are converted by the 11β-HSD2 to cortisone (E) and 11-dehydrocorticosterone (A), in blue, that are inactive forms with low affinity for the glucocorticoid receptor.
Figure 2
Figure 2
Corticoids in the serum. (A) Correlation between cortisol (F) and cortisone (E) levels (ng/ml) in the serum. (B) Correlation between corticosterone (B) and 11-dehydrocorticosterone (A) levels (ng/ml) in the serum. (C) Correlation between cortisol (F) level (ng/ml) and the time of the day (hours). (D) Correlation between cortisone (E) level (ng/ml) and the time of the day (hours).
Figure 3
Figure 3
Metabolism of corticoids in the aqueous humor (AH). (A) Correlation between cortisol (F) and cortisone (E) levels (ng/ml), (A) correlation between corticosterone (B) and 11-dehydrocorticosterone (A) levels (ng/ml), (C) correlation between the time of the day and the level of cortisol (F) in the AH, (D) significant and positive correlation between cortisone (E) level (ng/ml) and the time of the day (r = 0.3, p = 0.03), (E) significant influence of the time of the day on the E/F in the AH, (F) significant influence of the time of the day on the F/E ratio in the AH.
Figure 4
Figure 4
Influence of sex on the metabolism of glucocorticoids in the AH. No significant difference between male and female in the levels of cortisol (ng/ml) (A), cortisone (ng/ml) (B) and E/F ratio (C).
Figure 5
Figure 5
Comparison between gluco and mineralocorticoids in the AH and vitreous (V) of the same individual.
Figure 6
Figure 6
Comparison of corticoids metabolism in the AH and in the serum. (A) No correlation between cortisol (F) level (ng/ml) in the serum and in the AH (r = 0138, p = 0.49), (B) significant and positive correlation between cortisone (E) level (ng/ml) in the serum and in the AH (r = 0.57, p = 0.0016). (C) No correlation between the E/F ratio in the serum and in the AH. (D) No correlation between the F/E ratio in the serum and in the AH. (E) No correlation between corticosterone (B) level (ng/ml) in the serum and in the AH (r = 0.42 p = 0.06) (F). Significant and positive correlation between 11-dehydrocorticosterone (A) level (ng/ml) in the serum and in the AH (r = 0.52, p = 0.003). G. No correlation between the A/B ratio in the serum and in the AH.
Figure 7
Figure 7
Comparison ocular steroidome in patients with CSCR and controls. (A) Levels in ng/ml of cortisol (F) (****p = 0.0001) and cortisone (E) (ns, p > 0.05) in control and CSCR eyes. (B) F/E ratio in control and CSCR eyes (**, p = 0.023). (C) Levels in ng/ml of corticosterone (B) (*p = 0.03) and 11-hydroxycorticosterone (A) in control and CSCR eyes. (D) B/A ratio in control and CSCR eyes (**, p = 0.0044).
Figure 8
Figure 8
Multimodal imaging of a 32-year-old woman with bilateral chronic CSCR. (A) Intermediate phase at 4 min shows mild staining in the inferior foveal zone and moderate stippled hyperfluorescence at the level of the superior arcade on fluorescein angiography of the right eye, corresponding to a hyperfluorescent plaque on indocyanine green angiography (ICGA). The intermediate cliché at 7 min of the left eye, (B) shows a mild FA staining surrounding the foveal SRF pocket, corresponding to granular stippled hyperfluorescence on ICGA (C–G). spectral-domain optical coherence tomography (SD-OCT) of the left and right eye during follow-up, respectively (C). The exam recorded in 2018 already showed a foveal neurosensory dome-shaped detachment with photoreceptor elongation and thickened choroid (D–F). Progressive SRF resolution after starting systemic mineralocorticoid antagonist therapy. The effect of the treatment on choroidal thickness cannot be evaluated without the enhanced depth imaging focus (EDI) (G). Additional topical dexamethasone treatment increased SRF reduction. Note the vascular enlargement with choriocapillary attenuation and signal hypertransmission underneath the residual neurosensory detachment and slight RPE elevation. No macular neovascularization was observed at that timepoint in both eyes (OCTA not shown).
Figure 9
Figure 9
SD-OCT follow-up after glucocorticoid switch. (A–C) After hydrocortisone switch and slow tapering, a complete absence of CRF was documented, together with a good photoreceptor (PR) layer reconstitution and mild RPE irregularities. (D) Upon furtherly tapering hydrocortisone to 1 drop every 3 days, a minimal PR detachment was observed (white arrow) in the left eye. Glucocorticoid treatment cessation and close follow-up at 3 weeks (E) revealed an initial recurrence of the disease in the left eye corresponding to the same perifoveal area (white arrow).
Figure 10
Figure 10
Multimodal imaging of the left eye (LE) of a 58-year-old male. (A) Fundus autofluorescence (FAF) showing perifoveal and inferior foveal hyperfluorescence. Intermediate FA (B) and ICGA (C) clichés at 5 min, showing stippled foveal hyperlfuorescence and granular irregular hyperfluorescence, respectively. (DG) SD-OCT B-scans and infrared fundus imaging during the follow-up period.

References

    1. Daruich A, et al. Central serous chorioretinopathy: Recent findings and new physiopathology hypothesis. Prog. Retin. Eye Res. 2015;48:82–118. - PubMed
    1. Daruich A, et al. Acute central serous chorioretinopathy: Factors influencing episode duration. Retina Phila. Pa. 2017;37:1905–1915. - PMC - PubMed
    1. Mrejen S, et al. Long-term visual outcomes and causes of vision loss in chronic central serous chorioretinopathy. Ophthalmology. 2019;126:576–588. - PubMed
    1. Chhablani J, Cohen FB, Central Serous Chorioretinopathy International Group Multimodal imaging-based central serous chorioretinopathy classification. Ophthalmol. Retina. 2020;4:1043–1046. - PubMed
    1. Bousquet E, et al. Clinical characteristics and multimodal imaging findings of central serous chorioretinopathy in women versus men. J. Clin. Med. 2022;11:1706. - PMC - PubMed

Publication types