. 2023 Aug 29;13(1):14140.
doi: 10.1038/s41598-023-41203-4.

Importance of residue 248 in Escherichia coli RNase P RNA mediated cleavage

Affiliations

Importance of residue 248 in Escherichia coli RNase P RNA mediated cleavage

Guanzhong Mao et al. Sci Rep. .

Abstract

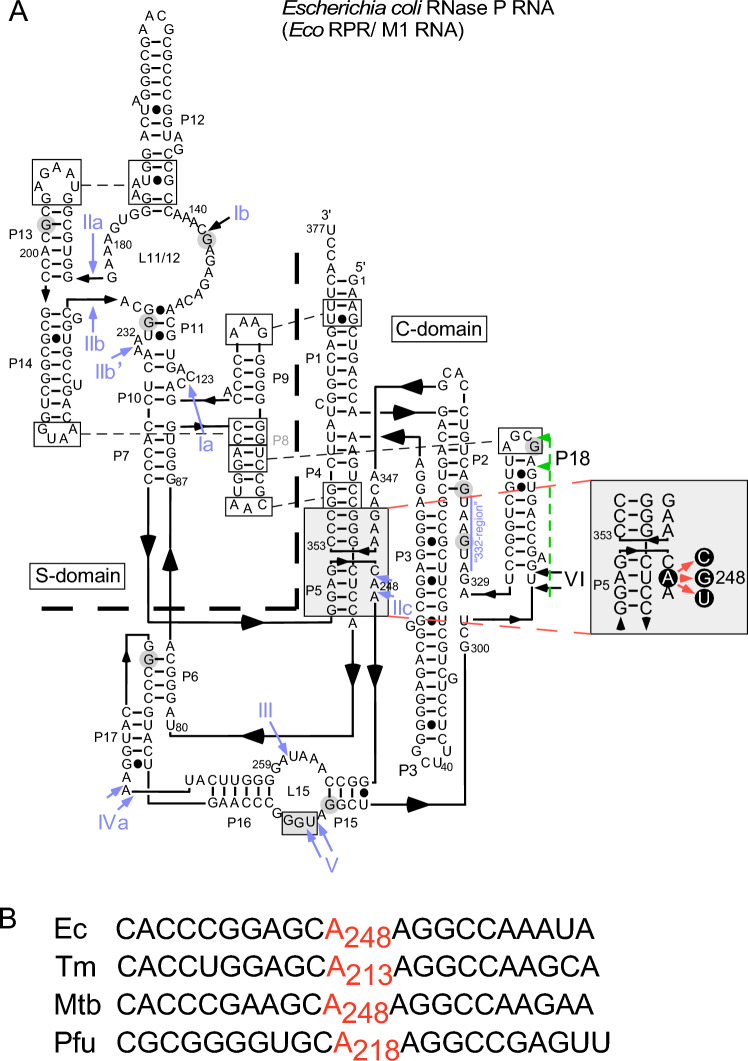
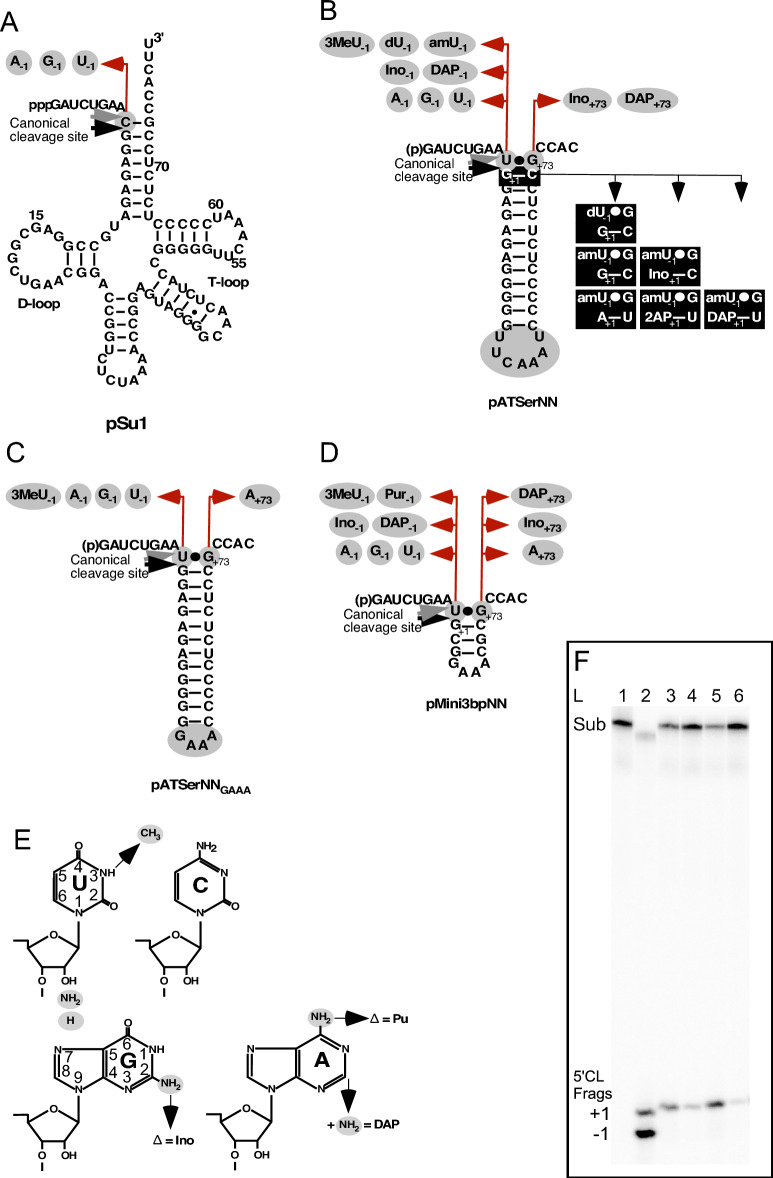
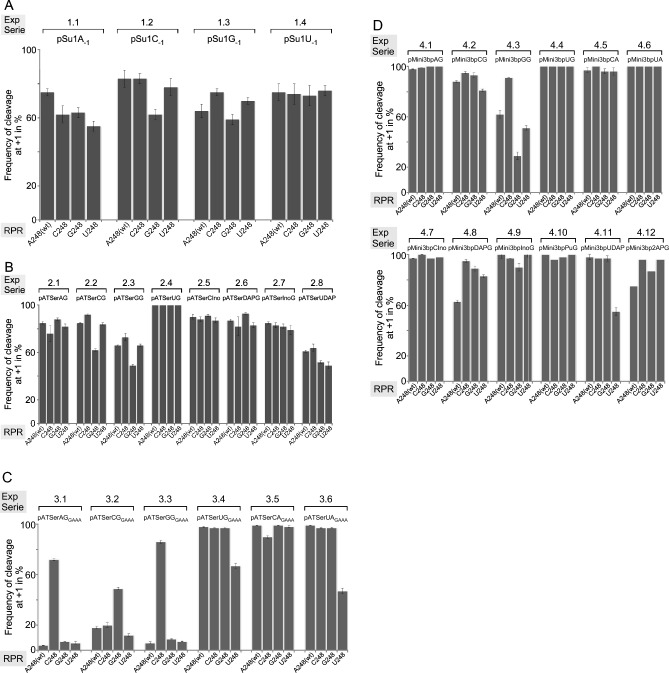
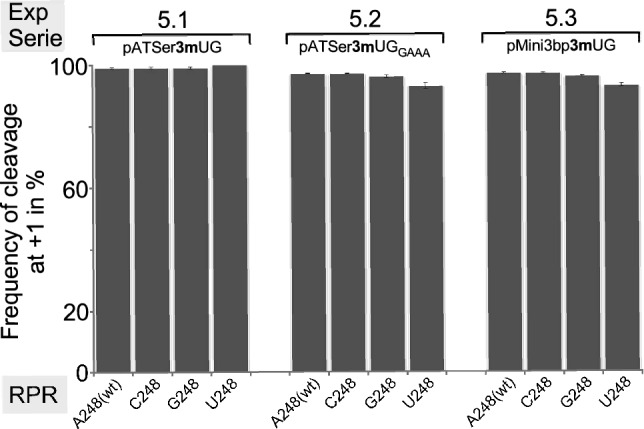
tRNA genes are transcribed as precursors and RNase P generates the matured 5' end of tRNAs. It has been suggested that residue - 1 (the residue immediately 5' of the scissile bond) in the pre-tRNA interacts with the well-conserved bacterial RNase P RNA (RPR) residue A248 (Escherichia coli numbering). The way A248 interacts with residue - 1 is not clear. To gain insight into the role of A248, we analyzed cleavage as a function of A248 substitutions and N-1 nucleobase identity by using pre-tRNA and three model substrates. Our findings are consistent with a model where the structural topology of the active site varies and depends on the identity of the nucleobases at, and in proximity to, the cleavage site and their potential to interact. This leads to positioning of Mg2+ that activates the water that acts as the nucleophile resulting in efficient and correct cleavage. We propose that in addition to be involved in anchoring the substrate the role of A248 is to exclude bulk water from access to the amino acid acceptor stem, thereby preventing non-specific hydrolysis of the pre-tRNA. Finally, base stacking is discussed as a way to protect functionally important base-pairing interactions from non-specific hydrolysis, thereby ensuring high fidelity during RNA processing and the decoding of mRNA.


Conflict of interest statement

The authors declare no competing interests.

Figures

Figure 1
Figure 1
Illustration of the Eco RPR secondary structures. (A) Eco RPR secondary structure according to Massire et al.. The heavy dashed demarcation line separates the S- and C-domains. The large gray box highlights the A248-region, and show the substitutions that were introduced at 248 (red arrows). The gray box in L15 marks residues that pair with the substrate 3ʹ end—the RCCA-RNase P RNA interaction (interacting residues underlined)—in the RPR-substrate complex. The blue arrows and Roman numerals mark the Pb2+-induced cleavage sites as shown in Fig. 2 (black circles). The vertical line marked in blue marks the "332-region", which is also cleaved in the in presence of Pb2+(see also,). Residues highlighted with gray circles correspond to RNase T1 cleavage sites (see also Fig. 2, bands marked with red dots). The green dashed line and arrows mark the area in P18, which becomes accessible to RNase T1 cleavage upon on substitution of A248 with U (see Fig. 2, Eco RPRU248). (B) Sequence of alignment of the region which includes the conserved E. coli (Ec) A248, T. maritima (Tm) A213, M. tuberculosis (Mtb) A248 and the Archaea P. furiosus (Pfu,) A218, and neighboring sequences as indicated.
Figure 2
Figure 2
Structural probing of Eco RPR. Probing the structures of the Eco RPR 248-variants with Pb2+ and RNase T1. Roman numerals and black circles refer to Pb2+-induced cleavage sites in Eco RPR (Fig. 1),,. Numbers and red circles correspond to the RNase T1 cleavage sites according to Guerrier-Takada and Altman, see Fig. 1A. The vertical black lines mark the P18- and 332-region. The vertical black line "P18" marks the extra RNase T1 cleavage sites between 292 and 314 in the U248 variant. The reactions were conducted using 0.5 mM Pb(OAc)2 and RNase T1 as described in “Materials and methods”.
Figure 3
Figure 3
Secondary structure of substrates used in the present study. (A) pSu1, (B) pATSerNN, (C) pATSerNNGAAA, (D) pMini3bp, (E) structures of nucleobases, and (F) cleavage of pATSerUG by the different Eco RPR 248 variants. Residues highlighted in gray were introduced to generate the different variants carrying alternative nucleobases at positions −1 and +73. The black boxes illustrate the changes that generated substrates carrying 2ʹNH2 and 2ʹH as well as substitutions of residues at positions +1 and +72. The canonical (correct) cleavage sites between residues N−1 and N+1 in the different substrates are marked with black arrows. The gray arrows mark the alternative cleavage sites between N−2 and N−1 (referred to as position −1, see text). The seven-base loop (B, marked in gray) in pATSerNN was replaced with a GAAA-tetra loop (C, marked in gray) to generate pATSerNNGAAA, see,. Panel (F): lane (L) 1, pATSerUG no RPR added; lane 2, cleavage of pATSerCGGAAA with Eco RPRA248(wt); lane 3, cleavage of pATSerUG with Eco RPRA248(wt); lane 4, cleavage of pATSerUG with Eco RPRC248; lane 5, cleavage of pATSerUG with Eco RPRG248; lane 6, cleavage of pATSerUG with Eco RPRU248. Sub, substrate and 5ʹCL Frags marks the migration of the 5ʹ cleavage products as a result of cleavage at +1 and −1. The reaction was performed in buffer C at 800 mM Mg2+ with 0.8 μM Eco RPR (irrespective of variant) and ≤ 0.02 μM substrate for 10 s as described in “Materials and methods”.
Figure 4
Figure 4
Frequencies of cleavage at +1 by Eco RPR 248 variants. Histograms summarizing frequencies of cleavage at +1 in % for the various substrate and Eco RPR 248 combinations as indicated. (A) Cleavage of pSu1(N−1) variants, Exp Series (ExpS) 1.1–1.4. (B) Cleavage of pATSer(N−1N+73) variants, Exp Series (ExpS) 2.1–2.8. (C) Cleavage of pATSer(N−1N+73)GAAA variants, Exp Series (ExpS) 3.1–3.6. (D) Cleavage of pMini3bpN−1/N+73 variants, Exp Series (ExpS) 4.1–4.12. To calculate the frequencies of cleavage at +1 we used the 5ʹ cleavage fragments and mean and experimental errors were calculated from at least three independent experiments.
Figure 5
Figure 5
Summary of data for N−1/N248 cis WC/WC base paring. Boxes marked in gray are consistent with cis WC/WC base-pairing; light gray marks those combinations where one combination (or weak agreement/non-WC/WC pairing e.g. GU-pairing) are consistent with cis WC/WC base-pairing, e.g. cf. pSu1U−1/A248- vs pSu1A−1/U248-combinations. Boxes marked in red highlight the combinations that are not in agreement with cis WC/WC base pairing, while no color indicates other combinations. The grey ExpS boxes refer to the Experimental Series, e.g. 1.1–1.4 and 2.1–2.8 etc., as shown in Figs. 4 and 6, and Tables 1, 2 and 3. (A) Experiment series using pSu1 (ExpS 1.1–1.4) and pATSer (ExpS 2.1–2.8) variants, which can establish a productive interaction with the TBS region in the S-domain (see main text for details). (B) Experiment series using pATSerGAAA (ExpS 3.1–3.6) and pMini3bp (ExpS 4.1–4.12) variants, which cannot form a productive interaction with the TBS region in the S-domain (see main text for details). (C) Experiment series for model substrates with a 3-methyl group at U−1 (ExpS 5.1–5.3).
Figure 6
Figure 6
Frequencies of cleavage-site selection for 3-methylated substrates by Eco RPR 248 variants. Histograms summarizing frequencies of cleavage at +1 in % during Eco RPR-mediated cleavage of pATSer3mUG (ExpS 5.1), pATSer3mUGGAAA (ExpS 5.2) and pMini3bp3mUG (ExpS 5.3) as indicated. We used the 5ʹ cleavage fragments to calculate the frequencies of cleavage at +1; mean and experimental errors were calculated from at least three independent experiments.
Figure 7
Figure 7
Kinetics of cleavage of pATSer with the Eco RPR 248 variants and Arrhenius plots. (A) Rate of cleavage of pATSerUG as a function of increasing concentration of the Eco RPR 248 variants. The experiments were performed at 37 °C in buffer C containing 800 mM Mg2+ as described in “Materials and methods”. The data represent mean and experimental errors from at least three independent experiments. Insets correspond to Eadie–Hofstee plots using the primary data and the kobs and kobs/Ksto values presented in Table 4. (B) Arrhenius plots of temperature dependence of kobs for the Eco RPR248 variants as indicated. The data are summarized in Table 4 and the temperatures are in Kelvin. The values given in the inset correspond to the calculated Ea (activation energy) values.
Figure 8
Figure 8
Frequencies of cleavage at +1 of different pATSerUG derivatives with 2ʹH or 2ʹNH2 at the −1 position at different pHs by Eco RPR 248 variants. (A) Histograms summarizing frequencies of cleavage at +1 in % during Eco RPR-mediated cleavage of pATSerdUG (2ʹOH at −1 substituted with 2ʹH). (B) Histograms summarizing frequencies of cleavage at +1 in % during Eco RPR-mediated cleavage of pATSeramUG (2ʹOH at −1 substituted with 2ʹNH2) and pATSeramUG(2AP+1/U+73). (C) Histograms summarizing frequencies of cleavage at +1 in % during Eco RPR-mediated cleavage of pATSeramUG(A+1/U+73) and pATSeramUG(2AP+1/U+73). (D) Histograms summarizing frequencies of cleavage at +1 in % during Eco RPR-mediated cleavage of pATSeramUG(DAP+1/U+73) and pATSeramUG(Ino+1/C+73). We used the 5ʹ cleavage fragments to calculate the frequencies of cleavage at +1 at different pH as indicated; mean and experimental errors were calculated from at least three independent experiments. For experimental details see “Materials and methods”.
Figure 9
Figure 9
Illustration of base stacking. (A) Stacking of the discriminator base, D+73 (in magneta), on the G+1/C+72 base pair in the crystal structure of tRNAPhe (PDB code 1EVV). (B) Stacking of residue A248 (in magenta and E. coli numbering, Fig. 1) on the tRNAPhe G+1/C+72 base pair (in green) in the crystal structure of the RNase P-tRNAPhe complex (PDB code 3Q1R). Grey spheres represent Me(II)-ions. (C) Stacking and the RCCA-RPR interaction (in green) in the crystal structure of the RNase P-tRNAPhe complex (PDB code 3Q1R). Stacking residues in magenta. D73 corresponds to the discriminator base at position +73 in tRNA while the RPR numbering refers to E. coli numbering (Fig. 1). Note that A295 in E. coli corresponds to U266 in T. maritima RPR. Stacking residues, the tRNA 3ʹ terminal A76 and the RPR residue, are marked in magenta. (D) Codon-anticodon interaction in the ribosomal A-site where residues in magenta stack as shown in the figure. p34–p37 correspond to positions in the tRNA anticodon loop. Gray residues represent the codon and residues marked in orange residues correspond to A1492 and A1493 in 16S rRNA (PDB code 2J02). (E,F) Stacking interactions in the ribosomal peptidyl transfer center, panel E (A-site) and panel F (P-site) as indicated. Orange residues correspond to rRNA residues interacting with the tRNA, green residues refer to tRNA and the tRNA discriminator base is highlighted in magenta (PDB code 5IBB). The images were created using PyMOL (Schrödinger, LLC).

References

    1. Guerrier-Takada C, Gardiner K, Marsh T, Pace N, Altman S. The RNA moiety of ribonuclease P is the catalytic subunit of the enzyme. Cell. 1983;35:849–857. doi: 10.1016/0092-8674(83)90117-4. - DOI - PubMed
    1. Liu F, Altman SR. Protein Reviews. Springer; 2010.
    1. Holzmann J, Frank P, Löffler E, Bennett KL, Gerner C, Rossmanith W. RNase P without RNA: Identification and functional reconstitution of the human mitochondrial tRNA processing enzyme. Cell. 2008;135:462–474. doi: 10.1016/j.cell.2008.09.013. - DOI - PubMed
    1. Gobert A, Gutmann B, Taschner A, Gössinger M, Holzmann J, Hartmann RK, Rossmanith W, Giegé P. A singel arabidopsis organellar protein has RNase P activity. Nat. Struct. Mol. Biol. 2010;17:740–744. doi: 10.1038/nsmb.1812. - DOI - PubMed
    1. Lai LB, Bernal-Bayard P, Mohannath G, Lai SM, Gopalan V, Vioque A. A functional RNase P protein subunit of bacterial origin in some eukaryotes. Mol. Genet. Genomics. 2011;286:359–369. doi: 10.1007/s00438-011-0651-y. - DOI - PubMed

Publication types

LinkOut - more resources