. 2023 Aug 29;6(1):885.
doi: 10.1038/s42003-023-05232-z.

Selective enrichment of plasma cell-free messenger RNA in cancer-associated extracellular vesicles

Affiliations

Selective enrichment of plasma cell-free messenger RNA in cancer-associated extracellular vesicles

Hyun Ji Kim et al. Commun Biol. .

Abstract

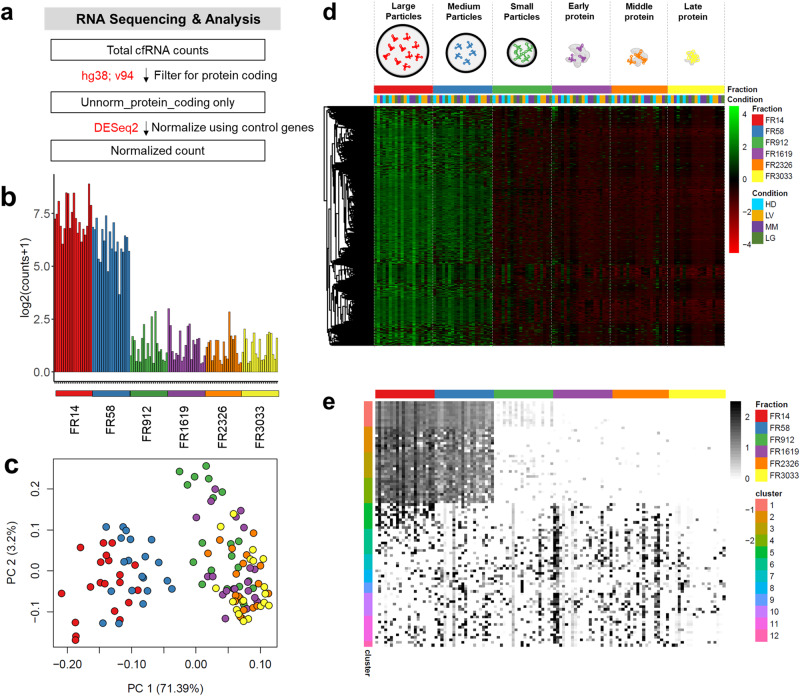
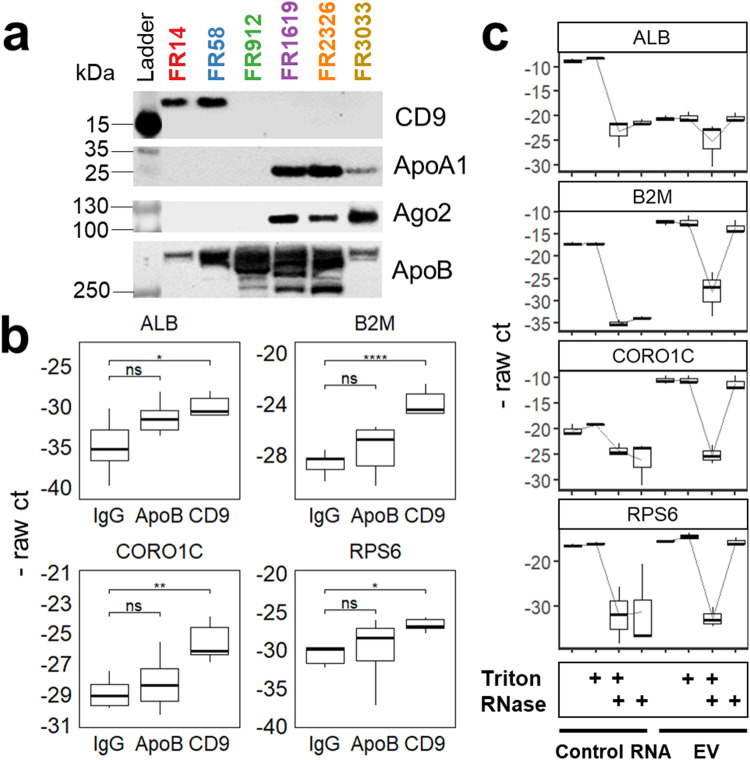
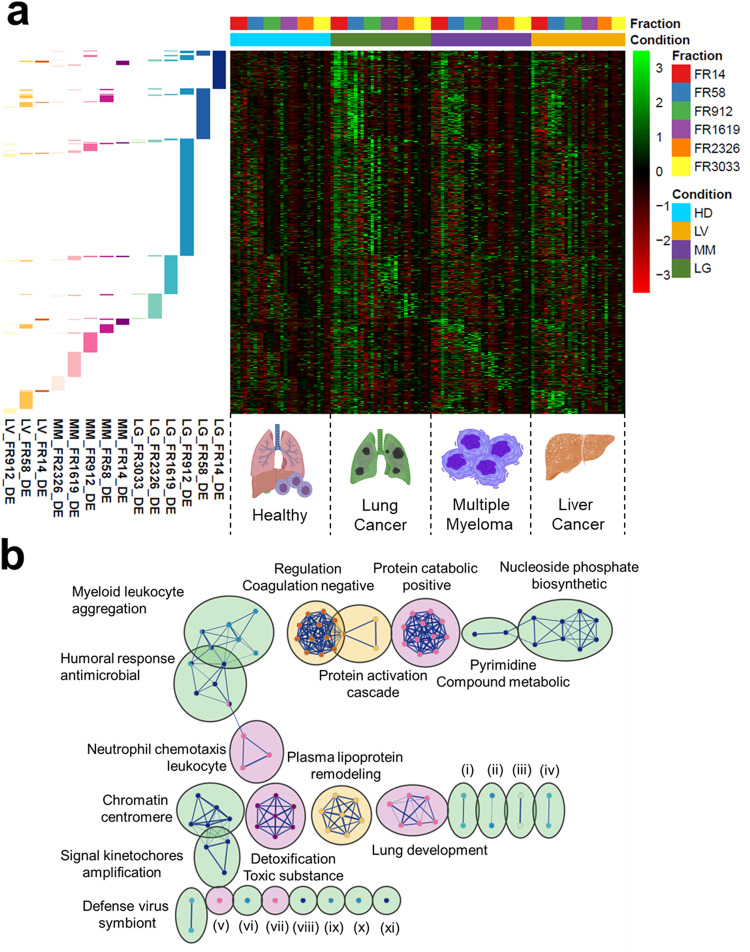
Extracellular vesicles (EVs) have been shown as key mediators of extracellular small RNA transport. However, carriers of cell-free messenger RNA (cf-mRNA) in human biofluids and their association with cancer remain poorly understood. Here, we performed a transcriptomic analysis of size-fractionated plasma from lung cancer, liver cancer, multiple myeloma, and healthy donors. Morphology and size distribution analysis showed the successful separation of large and medium particles from other soluble plasma protein fractions. We developed a strategy to purify and sequence ultra-low amounts of cf-mRNA from particle and protein enriched subpopulations with the implementation of RNA spike-ins to control for technical variability and to normalize for intrinsic drastic differences in cf-mRNA amount carried in each plasma fraction. We found that the majority of cf-mRNA was enriched and protected in EVs with remarkable stability in RNase-rich environments. We observed specific enrichment patterns of cancer-associated cf-mRNA in each particle and protein enriched subpopulation. The EV-enriched differentiating genes were associated with specific biological pathways, such as immune systems, liver function, and toxic substance regulation in lung cancer, liver cancer, and multiple myeloma, respectively. Our results suggest that dissecting the complexity of EV subpopulations illuminates their biological significance and offers a promising liquid biopsy approach.


Conflict of interest statement

The authors declare no competing interests.

Figures

Fig. 1
Fig. 1. Characterization of human plasma by size fractionation.
a Schematic diagram of plasma fractionation using size exclusion chromatography with 2 mL input plasma and 2 mL eluted volumes collected per fraction (FR). b Bar graphs of particle concentration (in black) measured by tunable resistive pulse sensing on left y-axis, and protein abundance (in red) measured by absorbance at 280 nm on right y-axis. X-axis indicates each fraction from size exclusion chromatography with area of color shown for FR14 (red), FR58 (blue), FR912 (green), FR1619 (purple), FR2326 (orange), and FR3033 (yellow) respectively. Data are analyzed using RStudio (v2023.06.1 + 524) and reported as means ± SD of three biological replicates. c Representative transmission electron microscopy images of particles in individual fractions; scale bar: 100 nm. d Pie chart of percent distribution of particles with corresponding size ranges: ≥ 100 nm (red), ≥ 50 nm & < 100 nm (blue), and < 50 nm (green) identified in each fraction measured by TEM. e Schematic of plasma fractions with color schemes for transcriptomic analysis.
Fig. 2
Fig. 2. Transcriptomic analysis of size fractionated human plasma.
a Schematic of plasma fractionation workflow from the sample set. Plasma samples from 5 of each healthy control (HD) and cancer patients (LV, LG, MM) were collected for size-fractionation and RNA isolation. Each plasma sample was fractionated into large particles (FR14), medium particles (FR58), small particles (FR912), early-, middle- and late-eluting protein fractions (FR1619, FR2326, and FR3033 respectively). A consistent amount of ERCC RNA control mix was spiked into plasma fractions to control for processing and normalization. Representative images were generated using BioRender illustration Software and PowerPoint. b Table of description of global reads, unique reads, exon fraction, and intron fraction across 120 sequencing samples from RNA-seq quality control package (RSeQc). The mean, minimum (Min) and maximum (Max) values are shown. c Table of biotype categories including protein coding, transcribed unprocessed pseudogene, processed transcript, processed pseudogene, lincRNA, antisense, and others. The mean, minimum (Min) and maximum (Max) values are shown. d Bar graph of number of input reads across 120 sequencing samples colored by conditions. e A stack column representing the fraction of each biotype across 120 samples.
Fig. 3
Fig. 3. Majority of cf-mRNAs are present in large and medium particle fractions.
a Schematic of RNA sequencing and analysis workflow. Total cfRNA counts were filtered for protein coding using human genome ensemble annotation; v94 (hg38; v94), which were then normalized using ERCC as control genes by DESeq2. b Bar plot of median expression in log2(counts+1) for all detected genes across plasma fractions: FR14 (red), FR58 (blue), FR912 (green), FR1619 (purple), FR2326 (orange), and FR3033 (yellow) respectively. c Principal component analysis using all 11,609 detectable genes across individual fractions: FR14 (red), FR58 (blue), FR912 (green), FR1619 (purple), FR2326 (orange), and FR3033 (yellow) respectively. d Heatmap representing relative expression of all genes (n = 11,609) from all conditions across all 118 samples revealing that the majority of cell-free mRNA are enriched in FR14 and FR58. e Heatmap representing relative expression level of top 10 genes derived from 12 distinct clusters using degPatterns across 118 samples. Top 10 genes were ranked by False Discovery Rate (FDR) from one-way ANOVA test. Clusters with less than 10 genes were plotted with the actual number of genes.
Fig. 4
Fig. 4. cf-mRNAs are enriched and protected in EVs.
a Expression of protein markers (CD9, ApoA1, Ago2, and ApoB) using immunoprecipitation across plasma fractions. Ladder was cropped from full gel to show size reference. b RT-qPCR analysis of selected genes using supernatants eluted from CD9, ApoB, or IgG immunocaptures from FR14 and FR58. P-value is derived from the Tukey’s test (ns = not significant, P > 0.05; *P < 0.05, **P < 0.01, and ****P < 0.0001) with three technical replicates of FR14 and FR58 of plasma pooled from three healthy individuals. c A box plot of negative raw cycle threshold (- raw ct) of individual genes with RNase and/or detergent treatment using qRT-PCR. RNA isolated from combined FR14 and FR58 using three healthy individuals and three technical replicates of control RNA were treated with RNase and/or detergent. Data are analyzed using RStudio and reported as means ± SD of three independent samples.
Fig. 5
Fig. 5. Selective Enrichment of Lung Cancer Differentiating cf-mRNA.
a Schematic of workflow for selective packaging (heatmap) and pathway enrichment analysis for lung cancer differentiating cf-mRNA. Normalized count was filtered to identify differentially expressed (DE) genes between individual healthy and cancer fraction (padj < 0.05 & log2FC > 1). After DE genes were identified, log2 fold change (log2FC) was calculated by subtracting log2 counts of cancer from individual biological replicates to the mean of corresponding healthy fractions. Gene lists were organized by fraction. DE genes were identified for selective packaging heatmap analysis. Using the DE genes identified from each fraction, g:Profiler was performed on gene ontology biological properties and reactome for functional enrichment analysis. Pathway enrichment analysis was performed using Cytoscape and EnrichmentMap. b Heatmap of gene expression in lung cancer relative to healthy across fractions. c Enrichment map for lung cancer DE genes found in individual fractions using Gene Ontology (Biological properties) and Reactome with FR14, FR912, FR1619, and FR3033 color coded by red, green, purple and yellow, respectively. Cluster represents (i) steroid hormone corticosteroid, (ii) Cellular response chemical, (iii) defense virus symbiont, (iv) regulation myeloid cell, (v) negative regulation response, (vi) toll cell receptor 4, (vii) g1 specific transcription, and (viii) hemidesmosome assembly. Cluster of nodes were automatically labeled using the AutoAnnotate from Cytoscape.
Fig. 6
Fig. 6. Selective Enrichment of Multiple Cancer Differentiating cf-mRNA.
a Heatmap of gene expression in multiple cancers (lung cancer, multiple myeloma, and liver cancer) relative to healthy across fractions. Annotation row indicates fraction of DE genes identified for specific cancer types compared to the healthy controls. Representative images were generated using BioRender illustration Software and PowerPoint. b Enrichment map for multiple cancer DE genes found in individual fractions using Gene Ontology (Biological Properties) and Reactome with lung cancer, multiple myeloma, and liver cancer color coded by green, purple and yellow, respectively. Cluster represents (i) steroid hormone corticosteroid, (ii) cellular response chemical, (iii) sphingolipid metabolism glycosphingolipid, (iv) localization nucleus nucleolus, (v) temperature homeostasis, (vi) regulation myeloid cell, (vii) alpha beta cell, (viii) toll cell receptor 4, (ix) hemidesmosome assembly, (x) negative regulation response, and (xi) g1 specific transcription. Cluster of nodes were automatically labeled using the AutoAnnotate from Cytoscape. Data sets were colored by fraction of DE genes identified for specific cancer types compared to the healthy controls as shown in Fig. 6a.

References

    1. Srinivasan S, et al. Small RNA sequencing across diverse biofluids identifies optimal methods for exRNA isolation. Cell. 2019;177:446–462.e416. - PMC - PubMed
    1. Murillo OD, et al. ExRNA atlas analysis reveals distinct extracellular RNA cargo types and their carriers present across human biofluids. Cell. 2019;177:463–477.e415. - PMC - PubMed
    1. Godoy PM, et al. Large differences in small RNA composition between human biofluids. Cell Rep. 2018;25:1346–1358. - PMC - PubMed
    1. Rozowsky J, et al. exceRpt: A Comprehensive Analytic Platform for Extracellular RNA Profiling. Cell Syst. 2019;8:e353. - PMC - PubMed
    1. Koh W, et al. Noninvasive in vivo monitoring of tissue-specific global gene expression in humans. Proc. Natl. Acad. Sci. USA. 2014;111:7361–7366. - PMC - PubMed

Publication types