. 2023 Aug 29;11(1):140.
doi: 10.1186/s40478-023-01634-6.

Repeat length of C9orf72-associated glycine-alanine polypeptides affects their toxicity

Affiliations

Repeat length of C9orf72-associated glycine-alanine polypeptides affects their toxicity

Javier Morón-Oset et al. Acta Neuropathol Commun. .

Abstract

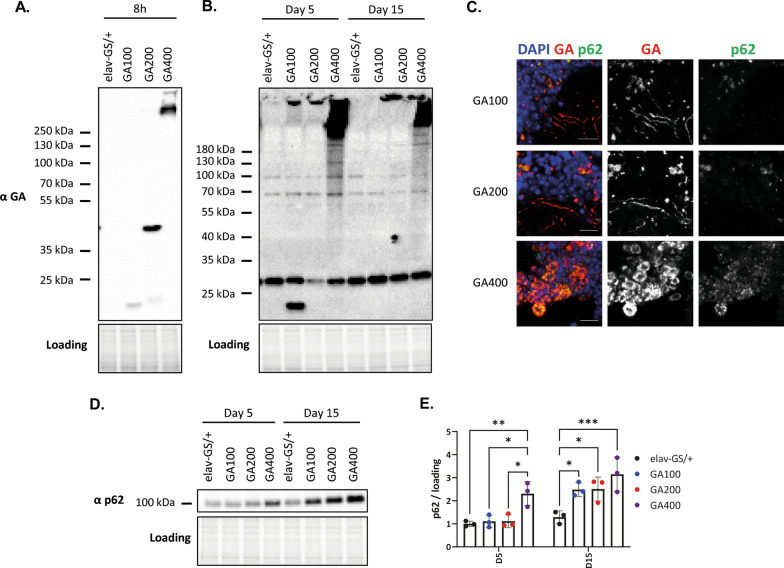
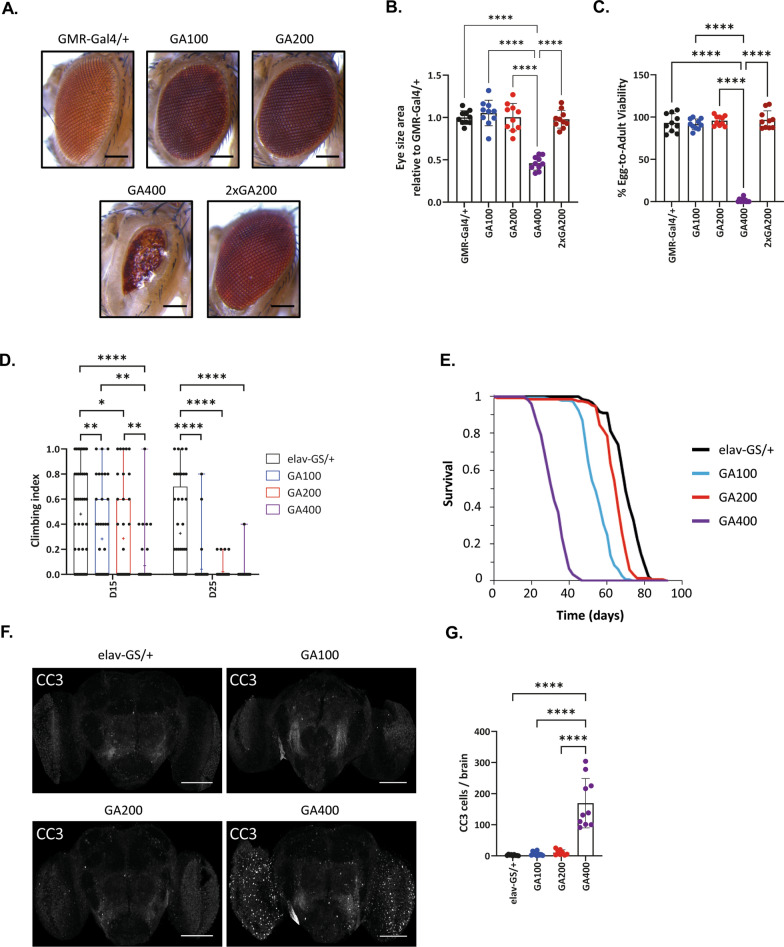
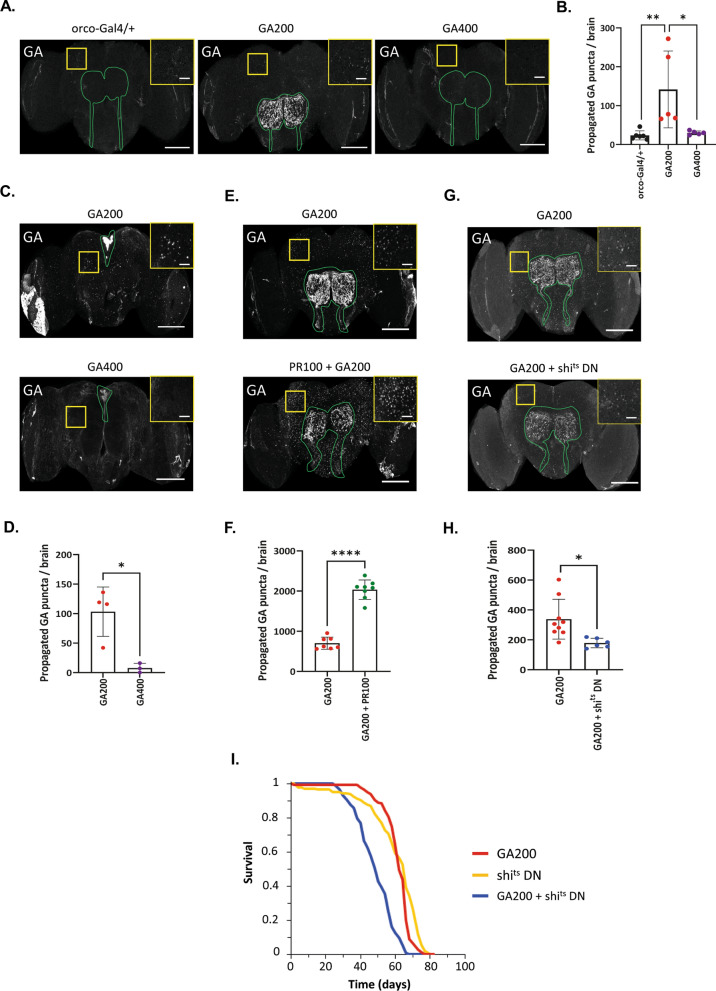
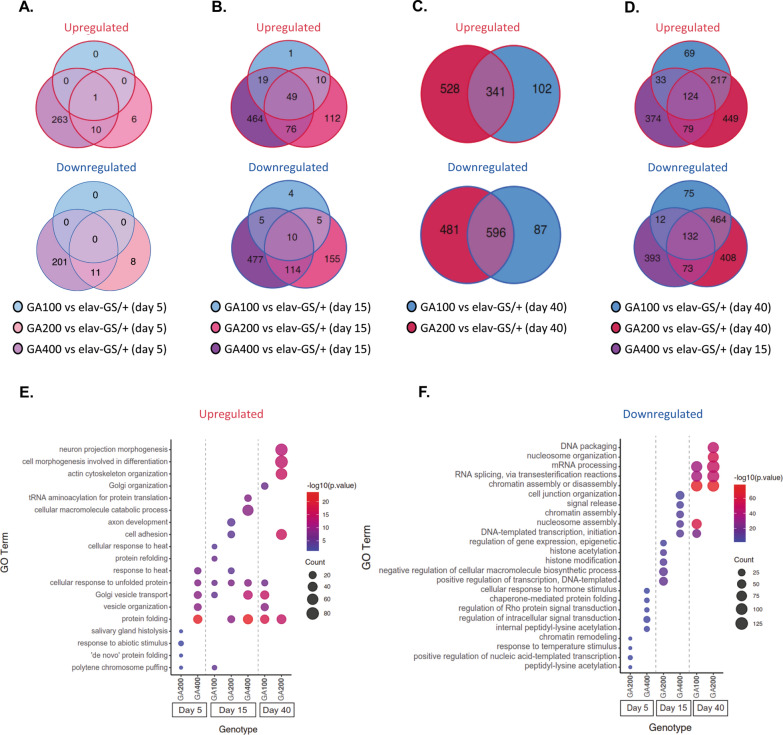
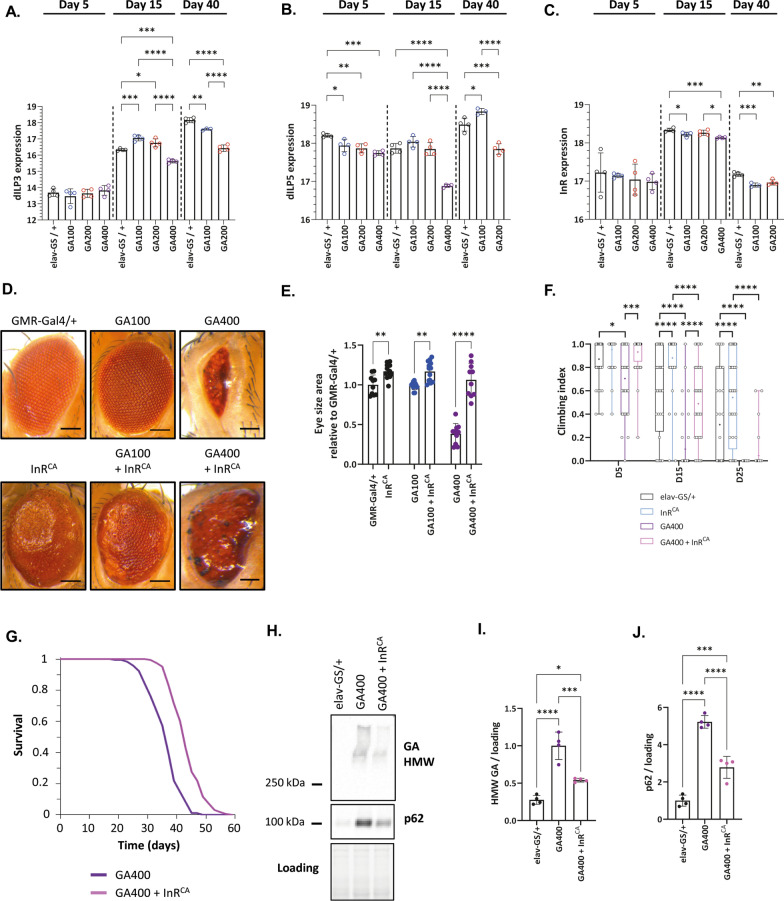
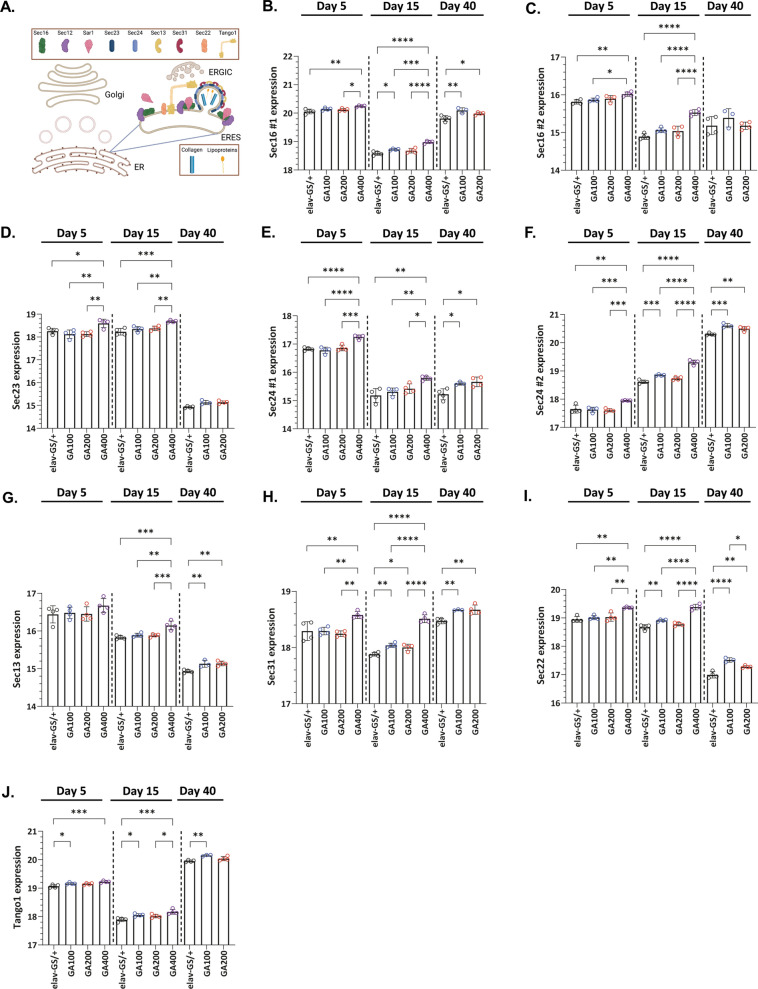
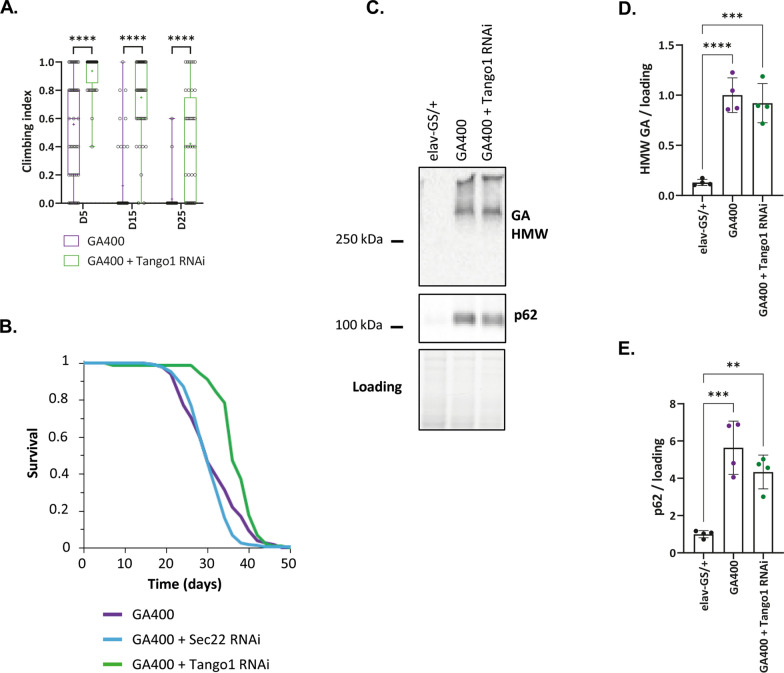
G4C2 hexanucleotide repeat expansions in a non-coding region of the C9orf72 gene are the most common cause of familial amyotrophic lateral sclerosis (ALS) and frontotemporal dementia (FTD). G4C2 insertion length is variable, and patients can carry up to several thousand repeats. Dipeptide repeat proteins (DPRs) translated from G4C2 transcripts are thought to be a main driver of toxicity. Experiments in model organisms with relatively short DPRs have shown that arginine-rich DPRs are most toxic, while polyGlycine-Alanine (GA) DPRs cause only mild toxicity. However, GA is the most abundant DPR in patient brains, and experimental work in animals has generally relied on the use of low numbers of repeats, with DPRs often tagged for in vivo tracking. Whether repeat length or tagging affect the toxicity of GA has not been systematically assessed. Therefore, we generated Drosophila fly lines expressing GA100, GA200 or GA400 specifically in adult neurons. Consistent with previous studies, expression of GA100 and GA200 caused only mild toxicity. In contrast, neuronal expression of GA400 drastically reduced climbing ability and survival of flies, indicating that long GA DPRs can be highly toxic in vivo. This toxicity could be abolished by tagging GA400. Proteomics analysis of fly brains showed a repeat-length-dependent modulation of the brain proteome, with GA400 causing earlier and stronger changes than shorter GA proteins. PolyGA expression up-regulated proteins involved in ER to Golgi trafficking, and down-regulated proteins involved in insulin signalling. Experimental down-regulation of Tango1, a highly conserved regulator of ER-to Golgi transport, partially rescued GA400 toxicity, suggesting that misregulation of this process contributes to polyGA toxicity. Experimentally increasing insulin signaling also rescued GA toxicity. In summary, our data show that long polyGA proteins can be highly toxic in vivo, and that they may therefore contribute to ALS/FTD pathogenesis in patients.

Keywords: C9orf72; Drosophila; Glycine–alanine; Repeat length; Toxicity.


Conflict of interest statement

The authors declare that they have no competing interests.

Figures

Fig. 1
Fig. 1
The effect of repeat length on GA aggregation, subcellular localisation and p62 level. A, B Western blot analysis of fly heads expressing GA100, GA200 and GA400 in adult neurons for A 8 h, B 5 and 15 days under the control of the inducible elav-GS driver. An anti-GA antibody was used for immunodetection. C Representative images of adult fly brains expressing GA100, GA200 or GA400 for 5 days under the control of the elav-GS driver. Brains were stained with anti-GA and anti-p62 antibodies, and with DAPI to stain nuclei. Images from the antennal lobes are shown, which allow distinguishing neuronal somas from axons. Scale bar: 10 µm. D Western blot of fly heads expressing GA100, GA200 and GA400 for 5 and 15 days under the control of the elav-GS driver. Extracts were probed with an anti-p62 antibody. E Quantification of p62 protein levels based on the immunoblot in D (Two-way ANOVA + Tukey’s multiple comparisons test; n = 3 sets of 20 fly heads; genotype: ****P < 0.0001; age: ****P < 0.0001; interaction of age and genotype: P > 0.05)
Fig. 2
Fig. 2
GA400 is highly toxic in vivo. A Representative eye images of female flies expressing GA100, GA200, GA400 or two copies of GA200 (2xGA200 (attP40, attP2)) under the control of the eye-specific GMR-Gal4 driver. GA400 expression caused a strong rough eye phenotype. B Eye size of female flies normalized to the mean of the eye size of GMR-Gal4/ + control flies. GA400 expression strongly reduced eye size (One-way ANOVA + Tukey’s multiple comparisons test; n = 10 fly eyes per genotype; ****P < 0.0001). C Egg-to-adult viability of flies expressing polyGA proteins under the control of the GMR-Gal4 driver. GA400 expression strongly decreased viability (One-way ANOVA + Tukey’s multiple comparisons test; n = 10 independent vials and 18–109 counted eggs/vial; ****P < 0.0001). D Climbing ability of adult female flies expressing GA100, GA200 or GA400 for 15 or 25 days under the control of the elav-GS driver. Climbing indices are represented as box plots and the mean is indicated by + . Circles indicate individual flies. Expression of all polyGA proteins decreased climbing ability, but induction of GA400 caused stronger changes already on day 15 (Two-Way ANOVA + Tukey’s multiple corrections test; n = 41–45 flies; age: ****P < 0.0001; genotype: ****P < 0.0001; interaction of age and genotype: P > 0.05). E Survival curves of female flies with pan-neuronal expression of GA100, GA200 and GA400 under the control of the elav-GS driver. Flies expressing GA100, GA200 and GA400 were shorter-lived than elav-GS driver control flies (****P < 0.0001; log-rank + Bonferroni’s multiple corrections test, n = 150 female flies per genotype). Flies expressing GA400 were significantly shorter-lived than flies expressing GA100 and GA200 (****P < 0.0001) and GA100 flies were significantly shorter-lived than flies expressing GA200 (****P < 0.0001). F Representative images of adult fly brains stained for anti-cleaved caspase-3 (CC3). Transgenes were induced for 30 days under the control of the elav-GS driver. Scale bar: 100 µm. G Quantification of the number of CC3-positive cells per fly brain. (One-way ANOVA + Tukey’s multiple comparisons test; n = 8–10 brains; ****P < 0.0001)
Fig. 3
Fig. 3
GA transmission reduces GA200 toxicity. A Representative images of fly brains upon expression of polyGA constructs under the control of the orco-Gal4 driver. Brains were stained with an anti-GA antibody. Insets highlight the propagation of GA. B Quantification of GA puncta outside of ORNs (One-way ANOVA + Tukey’s multiple comparisons test; n = 5–6 brains; **P < 0.01 and *P < 0.05). C Representative images of fly brains upon expression of polyGA proteins under the MNC-specific dilp3-Gal4 driver for 10 days. GA400 did not spread from MNCs. Brains were stained with an anti-GA antibody. GA signal in MNCs is outlined in green. Insets highlight propagated GA. D Quantification of GA puncta outside of MNCs (unpaired, two-sided t-test; n = 3–4 brains; *P < 0.05). E Representative images of GA spread in fly brains expressing GA200 in combination with PR100 under the control of orco-Gal4. Insets highlight propagated GA. PR100 increased GA200 spread. F Quantification of GA spread outside of ORNs upon co-expression of PR100 (unpaired, two-sided t-test; n = 7–8 brains; ****P < 0.0001). G Representative images of GA spread in fly brains expressing GA200 in combination with dominant negative shibire (shitsDN) under the control of orco-Gal4. Brains were stained with an anti-GA antibody. Insets highlight GA propagation. ShitsDN co-expression reduced GA200 spread. H Quantification of GA spread outside of ORNs upon co-expression of shitsDN (unpaired, two-sided t-test; n = 6–9 brains; *P < 0.05). I Survival curves of flies that co-express GA200 and shitsDN under the control of the pan-neuronal elav-GS driver. GA200 and shitsDN co-expression shortened fly lifespan compared to GA200 or shitsDN alone (GA200 vs GA200 + shitsDN, shitsDN vs GA200 + shitsDN; log-rank + Bonferroni’s multiple corrections test; n = 150 female flies per genotype; ****P < 0.0001). (A, E, G): Transgenes were induced for 30 days. ORN axons and synaptic terminals are outlined in green. Scale bars in images: 100 µm and insets: 20 µm
Fig. 4
Fig. 4
PolyGA expression affects the fly brain proteome in a repeat length-dependent manner. AF Mass spectrometry-based proteomics analysis of female fly brains expressing GA100, GA200 and GA400 under the control of the elav-GS driver. AC VENN diagrams of the overlap of differentially expressed proteins in fly brains that express GA100, GA200 and GA400 pan-neuronally for 5 (A), 15 (B) or 40 (C) days. D VENN diagrams show the overlap of proteins that is differentially expressed between elav-GS/ + and GA400 flies at 15 days compared to those between GA100 and elav-GS/ + or GA200 and elav-GS/ + at 40 days of induction. AD Up-regulated proteins (upper panel) and down-regulated proteins (lower panel). EF Gene ontology (GO term) enrichment of (E) up-regulated and (F) down-regulated proteins in GA100, GA200 and GA400 brains after 5, 15 and 40 days of transgene induction. Only the most significant GO terms (p.adjust < 0.05 after Bonferroni correction) are displayed
Fig. 5
Fig. 5
Increased insulin signalling rescued GA400 toxicity. AC Protein levels of insulin-like peptides (dILP) and the insulin receptor (InR) measured by mass spectrometry-based proteomics in the brain of female flies expressing GA100, GA200 or GA400 for 5, 15 or 40 days under the control of the elav-GS driver. Shown are z-score normalized protein levels of A dILP3, B dILP5 and C InR. GA400 expression caused a significant decrease of dILP3, dILP5 and InR levels, suggesting decreased activity of brain insulin signalling upon GA400 induction (One-Way ANOVA + Tukey’s multiple corrections test; n = 3–4 replicates of 25 fly brains; *P < 0.5, **P < 0.01, ***P < 0.001, ****P < 0.0001). D Representative eye images of female flies expressing GA100 or GA400 (upper panel) or GA100 or GA400 in combination with constitutively active insulin receptor (InRCA) (lower panel) under the control of the GMR-Gal4 driver. E Eye size of flies normalized to the mean of the eye size of GMR-Gal4/ + control flies. InRCA expression significantly increased the eye size of control, GA100 and GA400 flies (Two-way ANOVA + Bonferroni’s Tukey’s multiple comparisons test; n = 10–13 imaged fly eyes per genotype; presence of GA: ****P < 0.0001; presence of InRCA: ****P < 0.0001; interaction between GA and InRCA: ****P < 0.0001). While no interaction was found between control and GA100 flies upon InRCA expression (Two-way ANOVA; n = 10–13 imaged fly eyes per genotype; interaction of GA and InRCA: P > 0.05), a significant interaction was observed between control and GA400 flies upon InRCA expression (Two-way ANOVA; n = 10–12 imaged fly eyes per genotype; interaction of GA and InRCA: P > 0.05), indicating that the magnitude of the InRCA effect was larger in GA400 flies. F, G Climbing performance and survival of GA400 flies co-expressing InRCA. Climbing indices are represented as box plots and the mean is indicated by + . Circles indicate individual flies. InRCA co-expression significantly improved climbing of control and GA400 expressing flies (elav-GS/ + vs InRCA and GA400 vs GA400 + InRCA; Two-Way ANOVA + Tukey’s multiple corrections test; n = 35–44 flies; age: ****P < 0.0001; genotype: ****P < 0.0001; interaction of age and genotype: ****P < 0.0001). Same elav-GS/ + and GA400 flies were used between F and Additional file 13: Fig. S13C. G Co-expression the InRCA significantly extended lifespan of GA400-expressing female flies (GA400 vs GA400 + InRCA; log-rank test; n = 150 female flies per genotype; ****P < 0.0001). The same survival curve of GA400-expressing flies is shown in G and Additional file 12: Fig. S12D. H Representative western blot of head protein extracts from female flies co-expressing GA400 and InRCA probed with anti-GA and anti-p62 antibodies. I, J Quantification of the western blots. I HMW GA and J p62 protein levels. Co-expression of InRCA significantly reduced GA400 and p62 protein levels (One-way ANOVA + Tukey’s multiple comparisons test; n = 4 replicates of 20 fly heads; ****P < 0.0001)
Fig. 6
Fig. 6
GA400 expression up-regulates ER-Golgi markers in the fly brain. A Schematic overview of ER-Golgi proteins identified by the proteomics analysis. B-J ER-Golgi protein levels measured by mass spectrometry-based proteomics in the brain of female flies expressing GA100, GA200 or GA400 for 5, 15 or 40 days under the control of the elav-GS driver. Shown are z-score-normalized protein levels for B-C Sec16 (B: Isoform X2JEY9, C: Isoform A8JUU3), D Sec23, E–F Sec24 (E: Isoform AB, F: Isoform CD), G Sec13, H Sec31, I Sec22, and J Tango1. While induction of GA400 for 5 days was sufficient to significantly increase the levels of all shown ER-Golgi proteins, significant effects for GA100 and GA200 were only observed after prolonged expression (One-Way ANOVA + Tukey’s multiple corrections test; n = 3–4 replicates of 25 fly brains; *P < 0.05, **P < 0.01, ***P < 0.001, ****P < 0.0001). Cartoon in A was generated using biorender
Fig. 7
Fig. 7
Down-regulation of Tango1 reduces GA400 toxicity. A Climbing ability of female flies that co-express GA400 and Tango1 RNAi under the control of the elav-GS driver. Climbing indices are represented as box plots and the mean is indicated by +. Circles indicate individual flies. Down-regulation of Tango1 significantly improved climbing ability of GA400-expressing flies (Two-Way ANOVA + Bonferroni’s multiple corrections test; n = 34–44 flies; ****P < 0.0001). B Survival curves of female flies that co-express GA400 and Tango1 RNAi or Sec22 RNAi under the control of the elav-GS driver. Down-regulation of Tango1, but not of Sec22, significantly extended lifespan of GA400-expressing flies (log-rank test + Bonferroni’s multiple corrections test; n = 150 female flies for elav-GS/UAS-GA400 and elav-GS/UAS-GA400, UAS-Sec22-RNAi, n = 90 for elav-GS/UAS-GA400, Tango1-RNAi; P < 0.0001). The same GA400 control survival curves are shown in B and Additional file 12: Fig. S12D-F. C Western blot analysis of GA and p62 protein expression in fly heads expressing GA400 in combination with Tango1-RNAi under the control of elav-GS for 5 days. Quantification of D HMW GA and E p62 protein levels from the western blot analysis in C. There was no significant difference in GA400 or p62 levels when Tango1 RNAi was co-expressed with GA400 (One-way ANOVA + Tukey’s multiple comparisons test; n = 4 replicates of 20 female fly heads; **P < 0.01, ***P < 0.001, ****P < 0.0001)

Similar articles

Cited by

References

    1. Taylor JP, Brown RH, Cleveland DW. Decoding ALS: From genes to mechanism. Nature. 2016;10(539):197–206. doi: 10.1038/nature20413. - DOI - PMC - PubMed
    1. Graff-Radford NR, Woodruff BK. Frontotemporal dementia. Semin Neurol. 2007;27:48–57. doi: 10.1055/s-2006-956755. - DOI - PubMed
    1. DeJesus-Hernandez M, Mackenzie IR, Boeve BF, Boxer AL, Baker M, Rutherford NJ, et al. Expanded GGGGCC hexanucleotide repeat in non-coding region of C9ORF72 causes chromosome 9p-linked frontotemporal dementia and amyotrophic lateral sclerosis. Neuron. 2011;72:245–256. doi: 10.1016/j.neuron.2011.09.011. - DOI - PMC - PubMed
    1. Renton AE, Majounie E, Waite A, Simón-Sánchez J, Rollinson S, Gibbs JR, et al. A hexanucleotide repeat expansion in C9ORF72 is the cause of chromosome 9p21-linked ALS-FTD. Neuron. 2011;72:257–268. doi: 10.1016/j.neuron.2011.09.010. - DOI - PMC - PubMed
    1. Van Mossevelde S, van der Zee J, Cruts M, Van Broeckhoven C. Relationship between C9orf72 repeat size and clinical phenotype. Curr Opin Genet Dev. 2017;44:117–124. doi: 10.1016/j.gde.2017.02.008. - DOI - PubMed

Publication types

LinkOut - more resources