

CT radiomics prediction of CXCL9 expression and survival in ovarian cancer
- PMID: 37644593
- PMCID: PMC10466849
- DOI: 10.1186/s13048-023-01248-5
CT radiomics prediction of CXCL9 expression and survival in ovarian cancer
Abstract
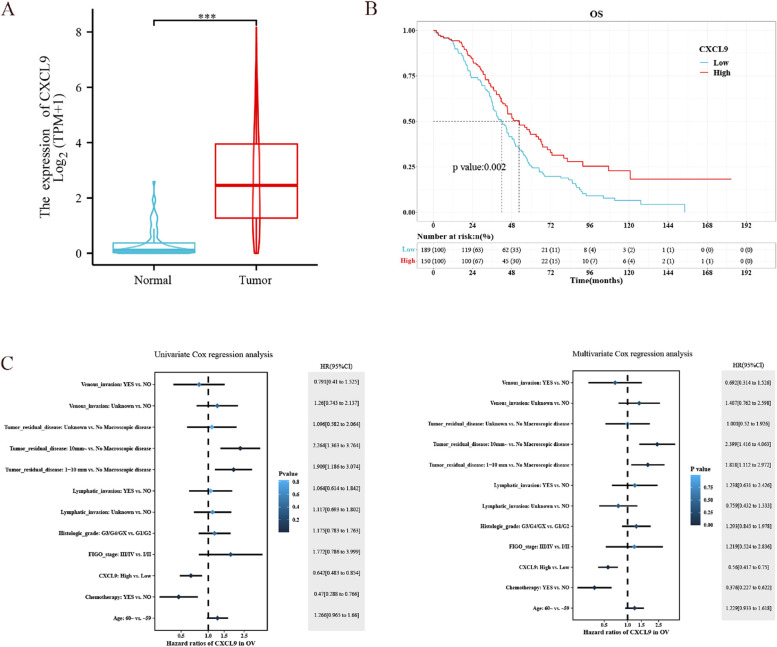
Background: C-X-C motif chemokine ligand 9 (CXCL9), which is involved in the pathological processes of various human cancers, has become a hot topic in recent years. We developed a radiomic model to identify CXCL9 status in ovarian cancer (OC) and evaluated its prognostic significance.
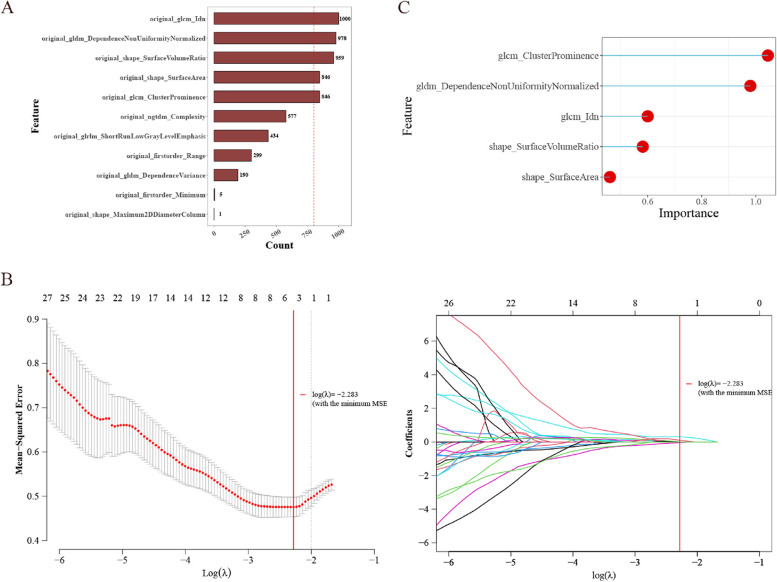
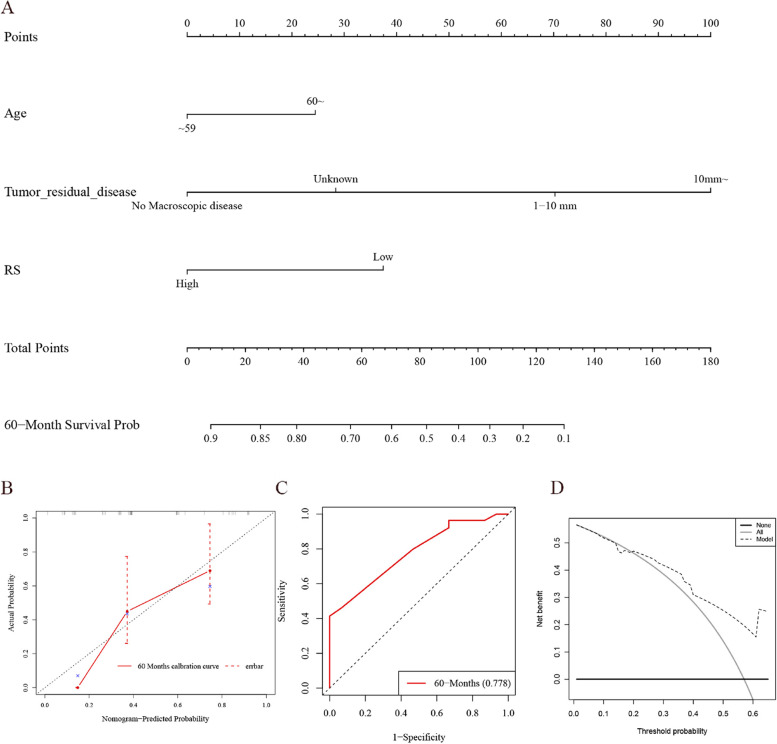
Methods: We analyzed enhanced CT scans, transcriptome sequencing data, and corresponding clinical characteristics of CXCL9 in OC using the TCIA and TCGA databases. We used the repeat least absolute shrinkage (LASSO) and recursive feature elimination(RFE) methods to determine radiomic features after extraction and normalization. We constructed a radiomic model for CXCL9 prediction based on logistic regression and internal tenfold cross-validation. Finally, a 60-month overall survival (OS) nomogram was established to analyze survival data based on Cox regression.
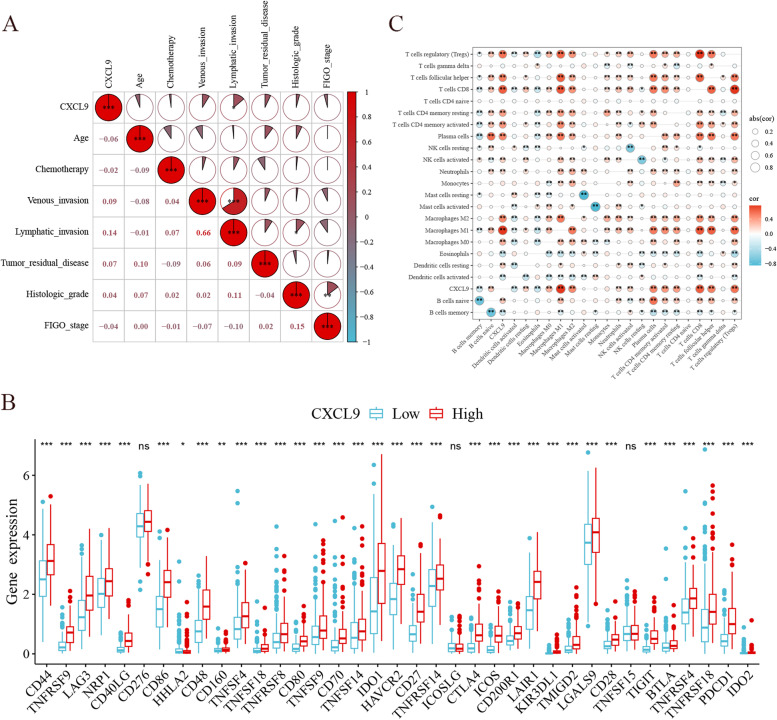
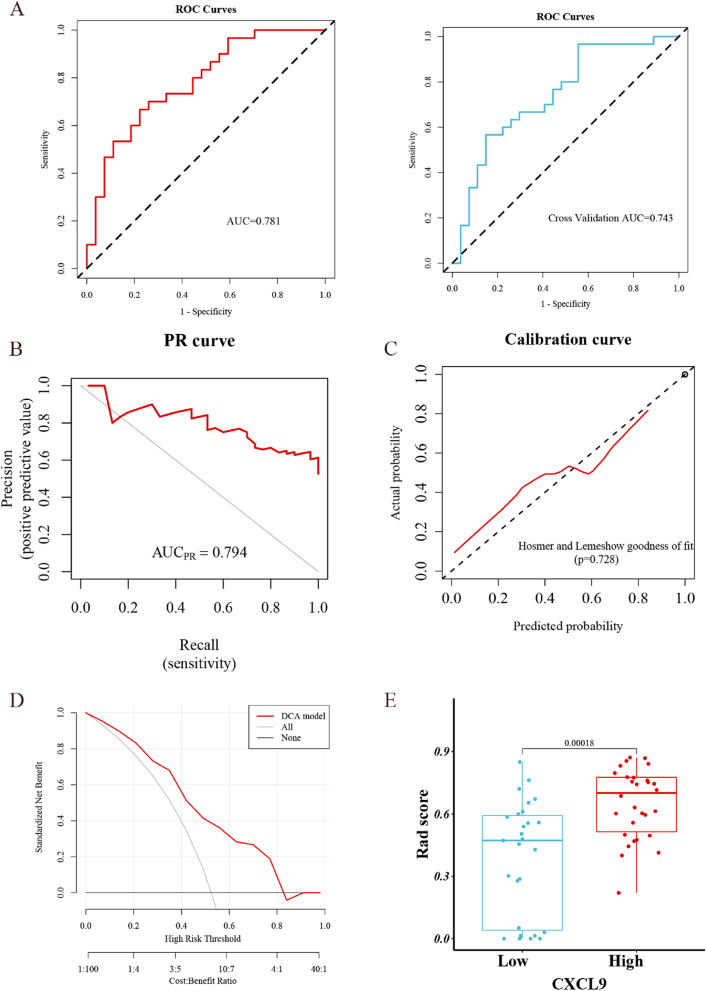
Results: CXCL9 mRNA levels and several other genes involving in T-cell infiltration were significantly relevant to OS in OC patients. The radiomic score (rad_score) of our radiomic model was calculated based on the five features for CXCL9 prediction. The areas under receiver operating characteristic (ROC) curves (AUC-ROC) for the training cohort was 0.781, while that for the validation cohort was 0.743. Patients with a high rad_score had better overall survival (P < 0.001). In addition, calibration curves and decision curve analysis (DCA) showed good consistency between the prediction and actual observations, demonstrating the clinical utility of our model.
Conclusion: In patients with OC, the radiomics signature(RS) of CT scans can distinguish the level of CXCL9 expression and predict prognosis, potentially fulfilling the ultimate purpose of precision medicine.
Keywords: CXCL9; Ovarian cancer; Overall survival; Prognosis; Radiomics.
© 2023. BioMed Central Ltd., part of Springer Nature.
Conflict of interest statement
The authors declare that they have no competing interests.
Figures
Similar articles
-
Development of a radiomic model to predict CEACAM1 expression and prognosis in ovarian cancer.Sci Rep. 2025 Apr 30;15(1):15259. doi: 10.1038/s41598-025-99625-1. Sci Rep. 2025. PMID: 40307488 Free PMC article.
-
Radiomic model to predict the expression of PD-1 and overall survival of patients with ovarian cancer.Int Immunopharmacol. 2022 Dec;113(Pt A):109335. doi: 10.1016/j.intimp.2022.109335. Epub 2022 Oct 21. Int Immunopharmacol. 2022. PMID: 36279669
-
Radiomics Signatures Based on Computed Tomography for Noninvasive Prediction of CXCL10 Expression and Prognosis in Ovarian Cancer.Cancer Rep (Hoboken). 2024 Oct;7(10):e70030. doi: 10.1002/cnr2.70030. Cancer Rep (Hoboken). 2024. PMID: 39443817 Free PMC article.
-
A radiomic nomogram based on arterial phase of CT for differential diagnosis of ovarian cancer.Abdom Radiol (NY). 2021 Jun;46(6):2384-2392. doi: 10.1007/s00261-021-03120-w. Epub 2021 Jun 4. Abdom Radiol (NY). 2021. PMID: 34086094 Free PMC article.
-
CT-based Machine Learning Radiomics Modeling: Survival Prediction and Mechanism Exploration in Ovarian Cancer Patients.Acad Radiol. 2025 May;32(5):2763-2775. doi: 10.1016/j.acra.2024.12.047. Epub 2025 Jan 17. Acad Radiol. 2025. PMID: 39827000
Cited by
-
Single-cell analysis of matrisome-related genes in breast invasive carcinoma: new avenues for molecular subtyping and risk estimation.Front Immunol. 2024 Oct 18;15:1466762. doi: 10.3389/fimmu.2024.1466762. eCollection 2024. Front Immunol. 2024. PMID: 39493752 Free PMC article.
-
Predicting progression-free survival in patients with epithelial ovarian cancer using an interpretable random forest model.Heliyon. 2024 Jul 26;10(15):e35344. doi: 10.1016/j.heliyon.2024.e35344. eCollection 2024 Aug 15. Heliyon. 2024. PMID: 39166005 Free PMC article.
-
Multimodal fusion radiomic-immunologic scoring model: accurate identification of prostate cancer progression.BMC Med Imaging. 2025 Aug 12;25(1):324. doi: 10.1186/s12880-025-01869-w. BMC Med Imaging. 2025. PMID: 40796801 Free PMC article.
-
Single-cell RNA sequencing reveals the change in cytotoxic NK/T cells, epithelial cells and myeloid cells of the tumor microenvironment of high-grade serous ovarian carcinoma.Discov Oncol. 2024 Sep 9;15(1):417. doi: 10.1007/s12672-024-01290-9. Discov Oncol. 2024. PMID: 39249551 Free PMC article.
References
-
- Hao Wen, Dongling Zou. Chinese guidelines for maintenance treatment of epithelial ovarian cancer (2021 edition) Chin J Prac Gynecol Obstet. 2021;37(6):640–49.
MeSH terms
Substances
Grants and funding
- Q202255/Youth Project of Wuxi Municipal Health Commission
- Q202255/Youth Project of Wuxi Municipal Health Commission
- Q202255/Youth Project of Wuxi Municipal Health Commission
- FYKY202203/Wuxi Maternal and Child Health Scientific Research Project
- FYKY202203/Wuxi Maternal and Child Health Scientific Research Project
LinkOut - more resources
Full Text Sources
Medical
Research Materials
