. 2023 Oct;10(10):1844-1853.
doi: 10.1002/acn3.51876. Epub 2023 Aug 29.

Expanding the spectrum of neonatal-onset AIFM1-associated disorders

Affiliations

Expanding the spectrum of neonatal-onset AIFM1-associated disorders

Alberto A Zambon et al. Ann Clin Transl Neurol. 2023 Oct.

Abstract

Objectives: Pathogenic variants in AIFM1 have been associated with a wide spectrum of disorders, spanning from CMT4X to mitochondrial encephalopathy. Here we present a novel phenotype and review the existing literature on AIFM1-related disorders.

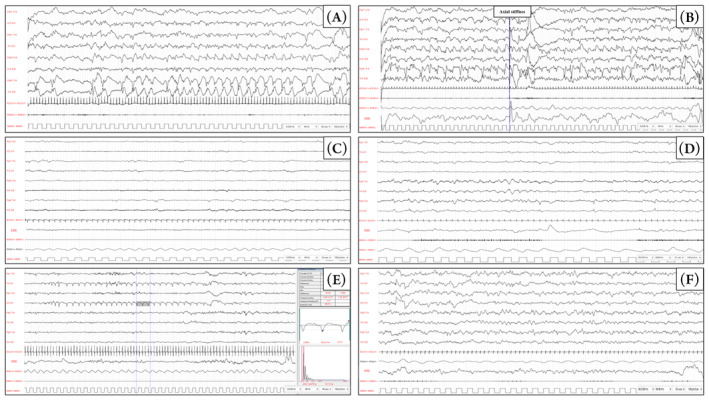
Methods: We performed EEG recordings, brain MRI and MR Spectroscopy, metabolic screening, echocardiogram, clinical exome sequencing (CES) and family study. Effects of the variant were established on cultured fibroblasts from skin punch biopsy.

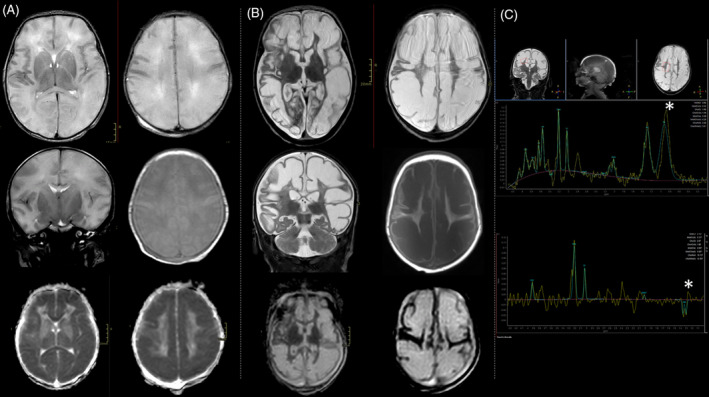
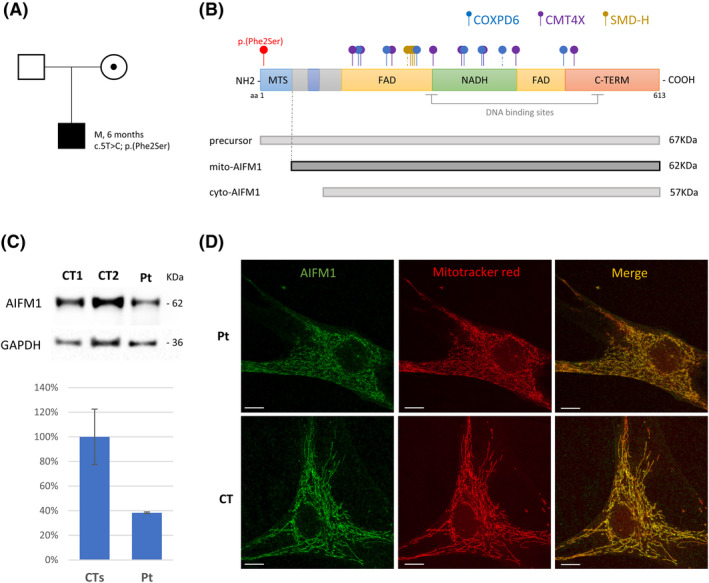
Results: The patient presented with drug-resistant, electro-clinical, multifocal seizures 6 h after birth. Brain MRI revealed prominent brain swelling of both hemispheres and widespread signal alteration in large part of the cortex and of the thalami, with sparing of the basal nuclei. CES analysis revealed the likely pathogenic variant c.5T>C; p.(Phe2Ser) in the AIFM1 gene. The affected amino acid residue is located in the mitochondrial targeting sequence. Functional studies on cultured fibroblast showed a clear reduction in AIFM1 protein amount and defective activities of respiratory chain complexes I, III and IV. No evidence of protein mislocalization or accumulation of precursor protein was observed. Riboflavin, Coenzyme Q10 and thiamine supplementation was therefore given. At 6 months of age, the patient exhibited microcephaly but did not experience any further deterioration. He is still fed orally and there is no evidence of muscle weakness or atrophy.

Interpretation: This is the first AIFM1 case associated with neonatal seizures and diffuse white matter involvement with relative sparing of basal ganglia, in the absence of clinical signs suggestive of myopathy or motor neuron disease.


Conflict of interest statement

The authors have no disclosures to report regarding the present study.

Figures

Figure 1
Figure 1
(A) Brain MRI on day 1 (Transverse and coronal T2 WI, transverse T1 WI, DWI ADC) showed brain swelling with T2 diffuse white matter mild hyperintensity, swollen appearance of the cortical gyri with flattening of the cortical sulci and apparent thinning of the cortex. DWI ADC (bottom) showed significantly restricted diffusivity of the white matter (mean 0,4 mm2 sec). (B) Brain MRI on day 30 (Transverse and coronal T2 WI, transverse T1 WI, DWI ADC) showed evolution toward multicystic encephalomalacia with marked T2 hyperintensity and T1 hypointensity of the white matter. DWI ADC diffusivity considerably increased (3 mm2 sec). (C) MR spectroscopy (short TE‐31 ms– at the top and long TE‐144 ms– at the bottom) exhibited high lactate peak, with typical doublet inverted at long TE (asterisks). There was also an increased peak of choline and reduction of NAA compared to reference values for age.
Figure 2
Figure 2
EEG tracings were acquired using a restricted neonatal montage including eight scalp electrodes (Fp2, C4, T4, O2, Fp1, C3, T3, O1), the ECG, electrooculography (EOG), pneumogram (PMG). A surface electrode was placed over the mylohyoid muscle (EMG). Acquisition parameters are shown in the bottom right corner of each panel. (A, B) EEG 7 h after birth during quiet sleep showed seizure originating from both hemisphere activities with continuous rhythmic epileptic discharges. Panel A shows ictal activity over the right temporal regions without overt clinical correlation. Panel B shows seizure activity, originated from the left hemisphere, diffusing over the right hemisphere while the patient displayed axial stiffness. (C) EEG 1 week after birth during quiet sleep, upon suspension of midazolam, showed a diffused slowing of the background and global suppression of cerebral activity, with synchronous and asynchronous epileptic discharges over the temporal regions of both hemispheres. (D) The interictal EEG 30 days after birth showed an alteration of the general organization in sleep, with no recognizable physiological sleep figures. Synchronous and asynchronous epileptic discharges can be observed over the temporal regions with distinct right predominance. (E) Ictal EEG 50 days after birth; during quiet sleep, a 30‐s sequence of periodic, 1–1.5 Hz, sharp waves could be observed over the left temporal region, without clinical correlate. (F) follow‐up EEG at 6 months. No sleep figure is recognizable and slow waves and occasional sharp waves are present over the temporal regions of both hemispheres, with a right predominance.
Figure 3
Figure 3
(A) Family pedigree and segregation analysis for the AIFM1 c.5T>C variant. (B) Scheme of AIFM1 protein with its main domains and AIFM1 isoforms (precursor AIFM1, mitochondrial and cytosolic isoform) with their predicted molecular weights. Dot‐end arrows indicate the position of the novel p.Phe2Ser variant (in red) and of published AIFM1 variants (with colors according to the corresponding phenotype). Dashed line were used for intronic variant affecting splicing junctions. (C) Immunoblot analysis of fibroblasts from patient (Pt) and controls (CT1, CT2) using antibodies against AIFM1 and GAPDH, the latter used as loading control. The graph reports percentages of the values of AIFM1/GAPDH signals obtained by densitometric analysis. One hundred per cent corresponds to the mean value from controls. (D) Representative images of immunofluorescence staining obtained with the anti‐AIFM1 antibody (green) and the mitochondrial marker Mitotracker (red) in fibroblasts from the patient (Pt) and a control (CT). The merged signals are reported in the right‐hand panels. Scale bar: 10 μm.

References

    1. Susin SA, Lorenzo HK, Zamzami N, et al. Molecular characterization of mitochondrial apoptosis‐inducing factor. Nature. 1999;397(6718):441‐446. doi:10.1038/17135 - DOI - PubMed
    1. Wischhof L, Scifo E, Ehninger D, Bano D. AIFM1 beyond cell death: an overview of this OXPHOS‐inducing factor in mitochondrial diseases. EBioMedicine. 2022;83:104231. doi:10.1016/j.ebiom.2022.104231 - DOI - PMC - PubMed
    1. Salscheider SL, Gerlich S, Cabrera‐Orefice A, et al. AIFM1 is a component of the mitochondrial disulfide relay that drives complex I assembly through efficient import of NDUFS5. EMBO J. 2022;41(17):e110784. doi:10.15252/embj.2022110784 - DOI - PMC - PubMed
    1. Meyer K, Buettner S, Ghezzi D, Zeviani M, Bano D, Nicotera P. Loss of apoptosis‐inducing factor critically affects MIA40 function. Cell Death Dis. 2015;6(7):e1814. doi:10.1038/cddis.2015.170 - DOI - PMC - PubMed
    1. Ghezzi D, Sevrioukova I, Invernizzi F, et al. Severe X‐linked mitochondrial encephalomyopathy associated with a mutation in apoptosis‐inducing factor. Am J Hum Genet. 2010;86(4):639‐649. doi:10.1016/j.ajhg.2010.03.002 - DOI - PMC - PubMed