. 2023 Sep;28(9):e13316.
doi: 10.1111/adb.13316.

Chronic administration of a norepinephrine antagonist prevents and partially reverses escalation of cocaine self-administration

Affiliations

Chronic administration of a norepinephrine antagonist prevents and partially reverses escalation of cocaine self-administration

Hassiba Beldjoud et al. Addict Biol. 2023 Sep.

Abstract

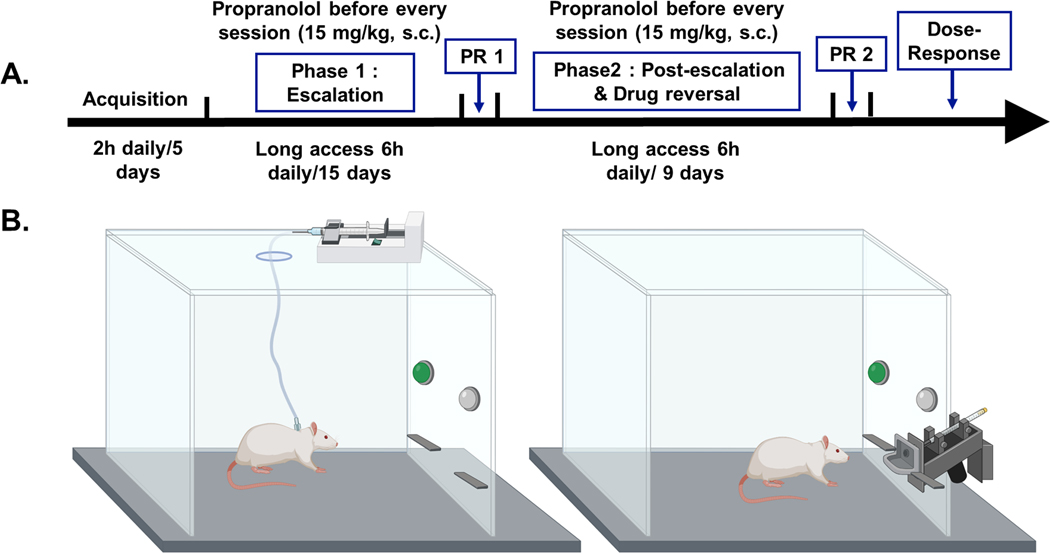
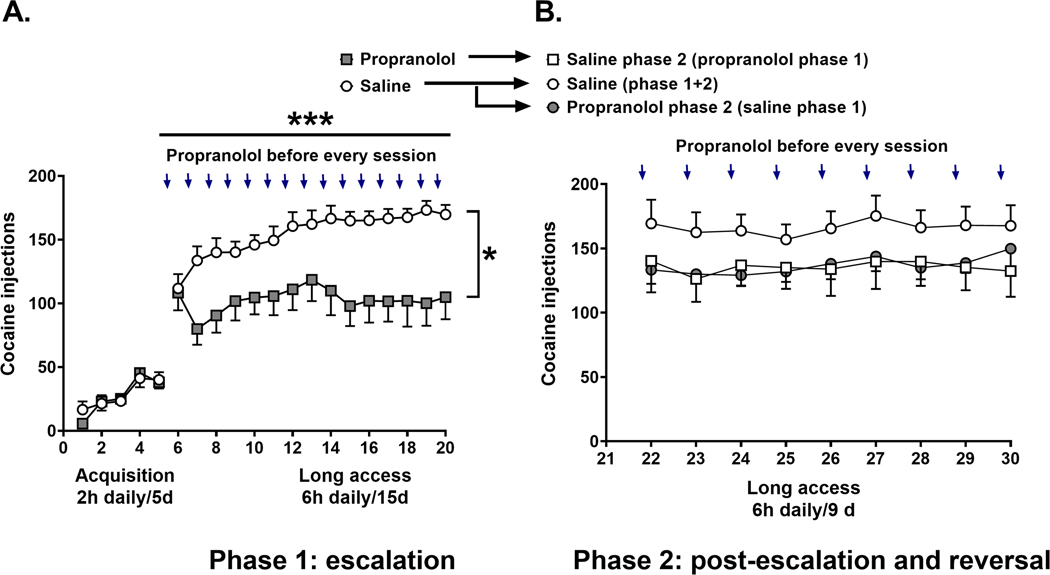
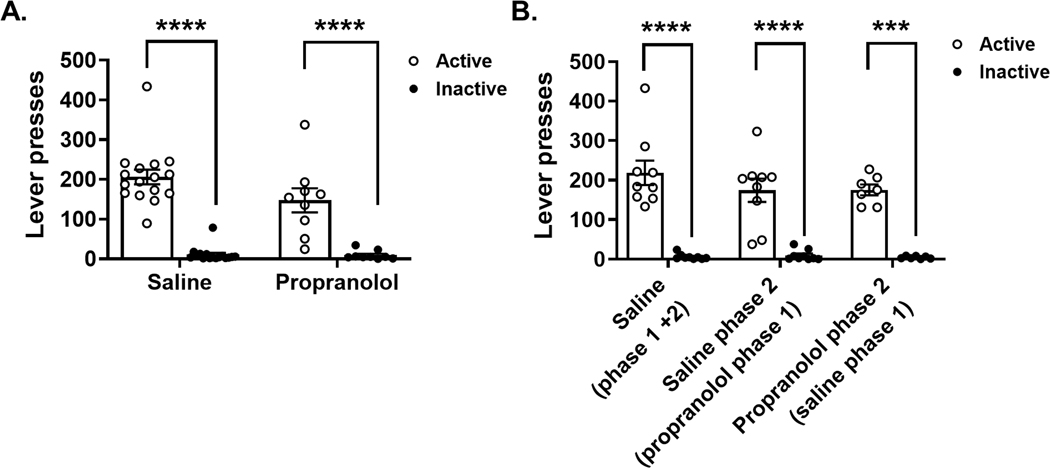
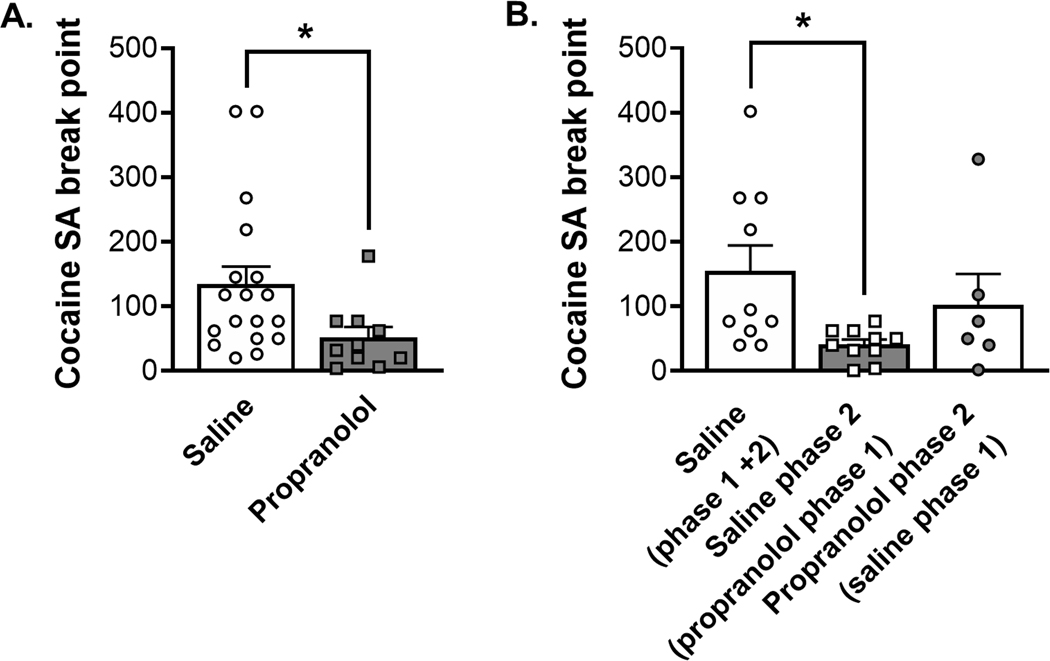
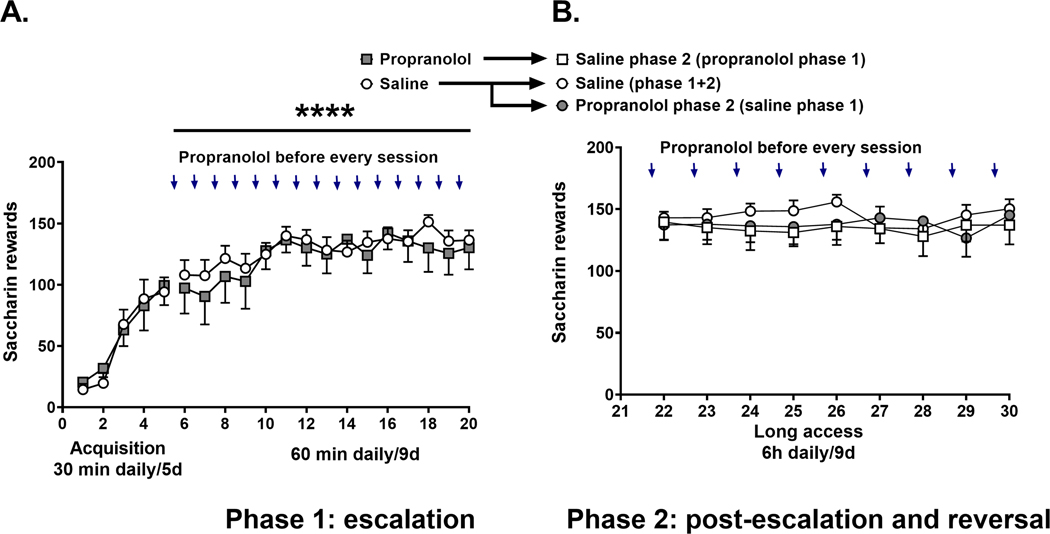
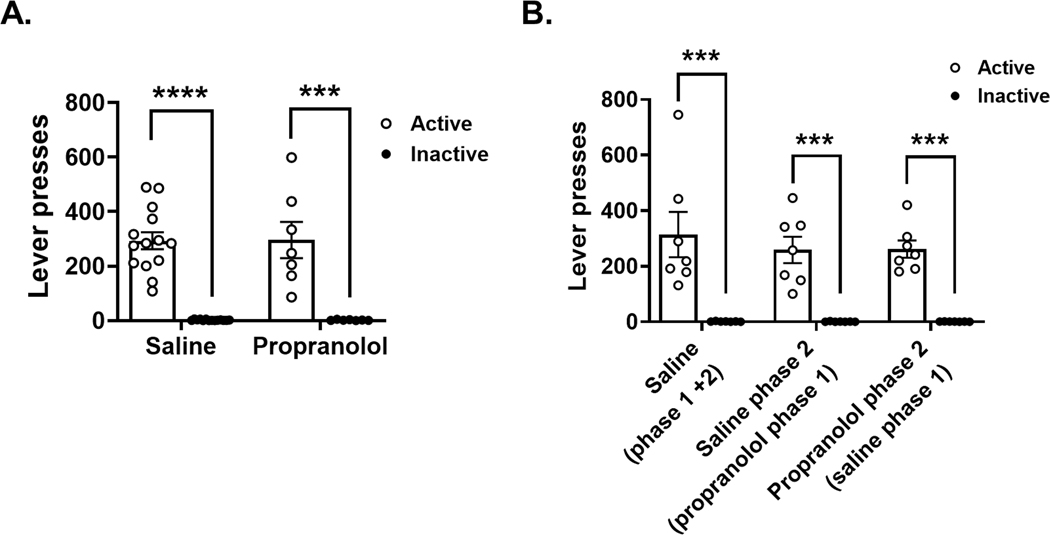
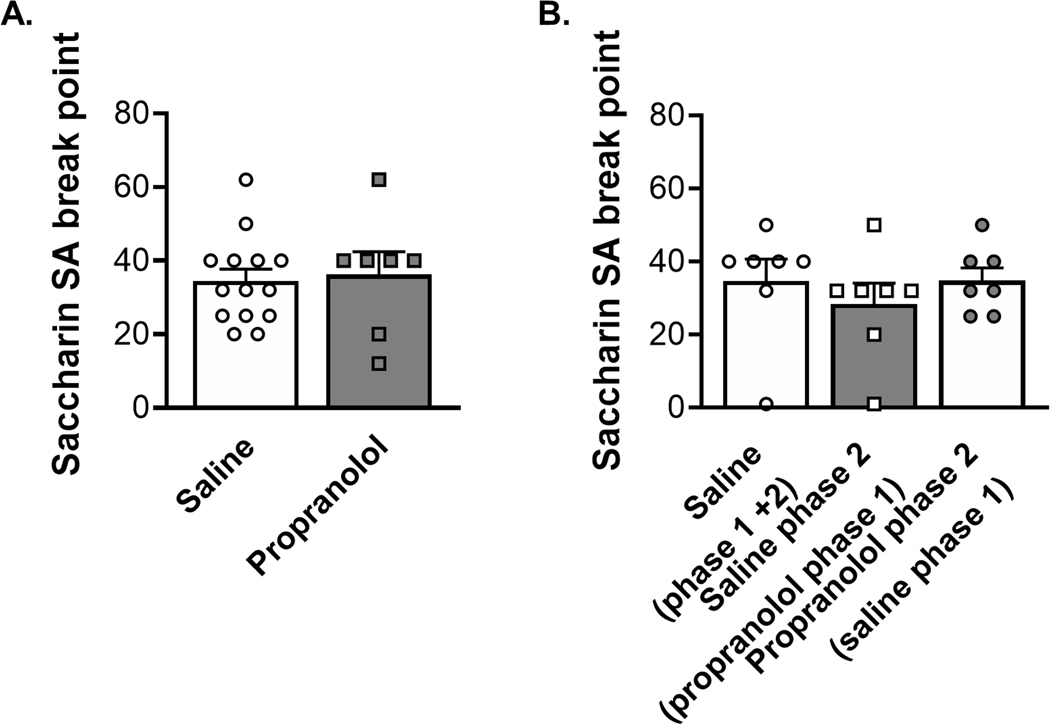
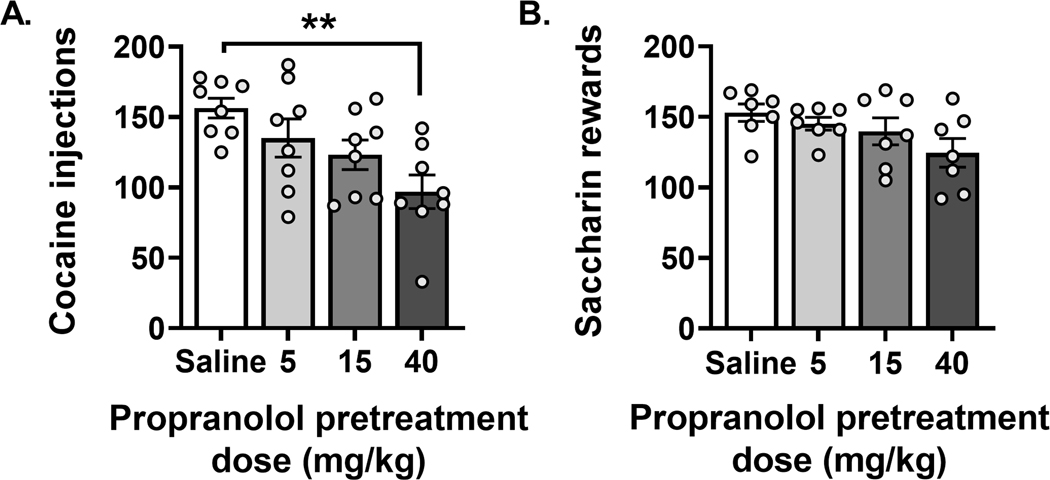
Anxiety is a critical component of the development and maintenance of drug addiction; however, anti-anxiety medications such as benzodiazepines and beta-blockers (β-adrenergic receptor antagonists) are not used for the treatment of substance use disorder, except for the management of acute withdrawal syndrome. Preclinical studies have shown that beta-blockers may reduce stress-induced relapse; however, the effect of beta blockers on the escalation and maintenance of drug intake has not been tested. To address this issue, we chronically administered the β-adrenergic receptor antagonist propranolol during the escalation or maintenance of cocaine intake in a model of extended access (6 h) to cocaine self-administration (0.5 mg/kg). The behavioural specificity of propranolol was tested using a non-drug reward (saccharin). Daily administration of propranolol (15 mg/kg) prevented the development of escalation of cocaine self-administration and partially reversed self-administration after the establishment of escalation of intake. Moreover, propranolol dose-dependently decreased the motivation for cocaine tested under a progressive ratio schedule of reinforcement during the development of escalation and after maintenance. Finally, propranolol administration had no effect on the escalation and maintenance of saccharin self-administration. These results demonstrate that chronic treatment with propranolol provides therapeutic efficacy in reducing cocaine self-administration during the development and after the establishment of escalation of cocaine self-administration in an animal model relevant to cocaine use disorder. These results suggest that beta blockers should be further investigated as a target for medication development for the treatment of cocaine use disorder.

Keywords: beta-blocker; motivation; norepinephrine; stress; substance-use disorders; therapeutics.


Figures

FIGURE 1
FIGURE 1
Experimental timeline and chamber set-up for cocaine and saccharin self-administration. (A) Cocaine self-administration timeline. Rats were allowed to lever press for cocaine SA initially for 2 h daily for 5 days. Next, during Phase 1 escalation, they were allowed to self-administer cocaine for 6 h daily for 15 days. This phase was followed by a progressive ratio test of motivation. Then, during Phase 2 post-escalation and drug reversal, the rats were allowed to SA cocaine for 6 h daily, for just 9 days. This phase was followed by a second progressive ratio test. Finally, dose–response tests for propranolol pretreatment were performed. Some rats were injected with 15 mg/kg, s.c. propranolol 30 min before each escalation and drug reversal session during Phases 1 and 2. (B) Chamber set-up for i.v. cocaine self-administration (left side) and saccharin liquid reward self-administration (right side). Chamber image created with BioRender.com by Alicia Avelar
FIGURE 2
FIGURE 2
Propranolol pretreatment reduces cocaine self-administration in rats during escalation. (A) The left panel represents the 5 days of cocaine acquisition 2 h/day/5 days. The open circles represent the pattern of cocaine self-administration in the control group that received saline 30 min before each cocaine self-administration session (6 h/day/15 days) (N = 18). Filled squares represent the pattern of cocaine in rats that received propranolol (15 mg/kg, s.c) 30 min before each cocaine self-administration session (6 h/day/15 days) (N = 10). (B) The open circles represent the control group that received saline during the escalation (Phase 1) and continued to receive saline in Phase 2 (N = 10). The filled circles represent the group that received saline during the escalation (Phase 1) and was switched to propranolol in Phase 2 (N = 10). The open squares represent the group that received propranolol during the escalation (Phase 1) and was switched to saline in Phase 2 (N = 6). Results are expressed as mean ± SEM of number of cocaine self-administration injections acquired by animals. *p = 0.0195 treatment effect; ***p = 0.0004 time effect
FIGURE 3
FIGURE 3
Cocaine self-administration lever presses during Phase 1 escalation and Phase 2 post-escalation and drug reversal. Open circles represent presses on the active lever and black circles represent presses on the inactive lever. (A) The left graph represents the escalation period (Phase 1). The saline group (N = 16) as well as the propranolol group (N = 9) show higher lever presses for the positive lever then for the negative lever, which indicates a good lever discrimination (Mann–Whitney tests, saline p < 0.000001 and propranolol p = 0.00008). (B) The right graph represents the post-escalation period where drug treatment was reversed (Phase 2). The first group of columns represents the saline group (N = 9). The middle two columns represent the group that received propranolol in Phase 1 and were switched to saline in Phase 2 (N = 9). The next group of columns represents saline group from Phase 1 that was switch to propranolol in Phase 2 (N = 7). The positive lever presses were higher than the negative lever presses for all groups during Phase 2. Results are expressed as mean ± SEM of number of lever presses per animal in Phases 1 and 2 (Mann–Whitney tests, saline [Phase 1 + 2] p = 0.00004, saline Phase 2 [propranolol Phase 1] p = 0.00008 and propranolol Phase 2 [saline phase 1] p = 0.0006). ****p < 0.0001 lever press type effect
FIGURE 4
FIGURE 4
Propranolol pretreatment reduces breakpoint during progressive ratio self-administration tests of motivation to consume cocaine. (A) The left graph represents the first PR test which followed the escalation period (Phase 1), the saline group is indicated by opened circles and white column (N = 18) and the propranolol group represented by filled square and grey column (N = 10). Propranolol decreased progressive ratio breakpoint by the end of Phase 1 escalation self-administration (Mann–Whitney test, p = 0.0146). (B) The right graph represents the second progressive ratio test at the end of Phase 2 (stabilization and drug reversal). The open symbols represent saline pretreatment during Phase 2, and grey-filled symbols represent propranolol pretreatment during Phase 2. The control group that received saline during the escalation (Phase 1) and continued to receive saline in Phase 2 has a white column indicating saline pretreament during Phase 1 (N = 10). The group that received saline during the escalation (Phase 1) and was switch to propranolol in Phase 2 is shown with a white column and grey-filled symbols (N = 6). The opened squares represent the group that received propranolol during the escalation (Phase 1) and were switched to saline in Phase 2 (N = 10). Propranolol decreased progressive ratio breakpoint by the end of Phase 2 post-escalation and drug reversal when given during Phase 1 (Kruskal–Wallis test p = 0.0275, Dunn’s multiple comparison test p = 0.015), suggesting a lasting effect of propranolol pretreatment on motivation to consume cocaine. Data are expressed as mean ± SEM of the breakpoint achieved during the PR. *p < 0.05, compared to control rats that received saline
FIGURE 5
FIGURE 5
Propranolol does not reduce saccharin self-administration. Saccharin is an artificial sweetener that can be considered a natural or non-drug reward. In fact, our data show that rats will press levers to self-administer saccharin, evidence that saccharin is behaviourally reinforcing. (A) The left panel represents saccharin acquisition 30 min daily per 5 days. The open circles represent the pattern of saccharin self-administration in the control group that received saline 30 min before each saccharin self-administration session (60 min/day/9 days) (N = 14). The arrows indicate that propranolol (15 mg/kg, s.c) was administered 30 min before a saccharin self-administration session (grey filled squares, n = 7). There was a significant effect of time (RMANOVA F[5.731, 108.9] = 11.58, p < 0.0001) but not propranolol pretreatment on escalation of saccharin self-administration (F[1, 19] = 0.1493, p = 0.7035). (B) Arrows in the right panel indicate that rats received propranolol 30 min before each saccharin self-administration session (60 min/day/9 days). The open circles represent the control group that received saline during the escalation (Phase 1) and continued to receive saline in Phase 2 (N = 7). The open squares represent the group that received propranolol during the escalation (Phase 1) and saline in Phase 2 (N = 7). The grey-filled circles represent the group that received saline during the escalation (Phase 1) and were switched to propranolol in Phase 2 (N = 7). Propranolol pretreatment did not alter post-escalation or drug reversal of saccharin self-administration (RMANOVA F[2, 18] = 0.2294, p = 0.79). Results are expressed as mean ± SEM of number of saccharin self-administration rewards acquired by animals.
FIGURE 6
FIGURE 6
Saccharin self-administration lever presses during Phase 1 escalation and Phase 2 post-escalation and drug reversal. Open circles represent presses on the active lever, and black circles represent presses on the inactive lever. (A) The left graph represents the escalation period (Phase 1); the saline group (N = 14) and the propranolol group (N = 7) show higher lever presses for the positive lever and then for the negative lever, which indicates a good lever discrimination. Propranolol pretreatment did not alter Phase 1 active or inactive lever presses (Mann–Whitney tests, saline p < 0.000001 and propranolol p = 0.0006). (B) The right graph represents the post-escalation period where drug treatment was reversed (Phase 2). The first group of columns represents the saline group (N = 7). The middle 2 columns represent the group that received propranolol in Phase 1 and was switched to saline in Phase 2 (N = 7). The next group of columns represents saline group from Phase 1 that was switch to propranolol in Phase 2 (N = 7). In all three groups, the lever presses for the positive lever were higher than negative lever presses, indicating a good discrimination of the two levers. Propranolol pretreatment did not alter active or inactive lever presses (Mann–Whitney test for each treatment group, saline [Phase 1 + 2] p = 0.0006, saline phase 2 [propranolol Phase 1] p = 0.0006 and propranolol Phase 2 [saline Phase 1] p = 0.0006). Results are expressed as mean ± SEM of number of lever presses per animal in Phases 1 and 2. Lever press type effect ***p = 0.0006, ****p < 0.000001
FIGURE 7
FIGURE 7
Propranolol pretreatment does not alter breakpoint during progressive ratio self-administration tests of motivation to consume saccharin. (A) The left graph represents the first progressive ratio test, which occurred at the end of Phase 1. The saline group is indicated by opened circles (N = 14) and the propranolol group represented by grey squares (N = 7). Propranolol did not alter progressive ratio breakpoint by the end of Phase 1 escalation SA (unpaired t test, p = 0.77). (B) The right graph represents the progressive ratio test at the end of Phase 2 (post-escalation and drug reversal). The open circle represents the control group that received saline during the escalation (Phase 1) and continued to receive saline in Phase 2 (N = 7). The open squares represent the group that received propranolol during the escalation (Phase 1, grey column) and was switched to saline in Phase 2 (N = 7). The grey-filled circles represent the group that received saline during the escalation (Phase 1, white column) and was switched to propranolol in Phase 2 (N = 7). Propranolol did not alter progressive ratio breakpoint by the end of Phase 2 post-escalation and drug reversal whether animals were given ropranolol during Phase 1 or 2 (Kruskal–Wallis test, p = 0.38), supporting that propranolol does not reduce motivation to consume non-drug rewards. Results are expressed as mean ± SEM of number of saccharin SA acquired by animals.
FIGURE 8
FIGURE 8
Propranolol pretreatment dose dependently reduced cocaine but not saccharin selfadministration. Three doses of ropranolol (5, 15 and 40 mg/kg) or saline were administered (sc) 30 min before self-administration session using a Latin square design procedure to determine which dose animals received. The doses were tested on rats that achieved a stable self-administration of cocaine or saccharin. High dose ropranolol (40 mg/kg) reduced cocaine self-administration A (N = 8, one-way ANOVA F[3, 28] = 5.057, p = 0.0063; Dunnett’s multiple comparisons test **p = 0.002) but had no effect on saccharin self-administration B (N = 7, one-way ANOVA F[3, 24] = 2.298, p = 0.103). Data are expressed as mean ± SEM of self-administration compared to control rats that received saline.

Similar articles

Cited by

References

    1. Grant BF, Stinson FS, Dawson DA, Chou SP, Dufour MC, Compton W, Pickering RP, Kaplan K. Prevalence and co-occurrence of substance use disorders and independent mood and anxiety disorders: results from the National Epidemiologic Survey on Alcohol and Related Conditions. Arch Gen Psychiatry. 2004. Aug;61(8):807–16. doi: 10.1001/archpsyc.61.8.807. PMID: 15289279. - DOI - PubMed
    1. Swendsen J, Le Moal M. Individual vulnerability to addiction. Ann N Y Acad Sci. 2011. Jan;1216:73–85. doi: 10.1111/j.1749-6632.2010.05894.x. PMID: 21272012. - DOI - PubMed
    1. George O, Koob GF. Individual differences in prefrontal cortex function and the transition from drug use to drug dependence. Neurosci Biobehav Rev. 2010. Nov;35(2):232–47. doi: 10.1016/j.neubiorev.2010.05.002. Epub 2010 May 20. PMID: 20493211; PMCID: PMC2955797. - DOI - PMC - PubMed
    1. Brady KT, Haynes LF, Hartwell KJ, Killeen TK. Substance use disorders and anxiety: a treatment challenge for social workers. Soc Work Public Health. 2013;28(3–4):407–423. Doi:10.1080/19371918.2013.774675 - DOI - PMC - PubMed
    1. Koob GF. The dark side of emotion: the addiction perspective. Eur J Pharmacol. 2015. Apr 15;753:73–87. doi: 10.1016/j.ejphar.2014.11.044. Epub 2015 Jan 9. PMID: 25583178; PMCID: PMC4380644. - DOI - PMC - PubMed

Publication types