Revisiting the Rist diagram for predicting operating conditions in blast furnaces with multiple injections
- PMID: 37645097
- PMCID: PMC10445826
- DOI: 10.12688/openreseurope.14275.1
Revisiting the Rist diagram for predicting operating conditions in blast furnaces with multiple injections
Abstract
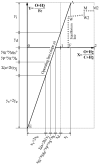
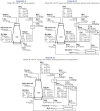
Background: The Rist diagram is useful for predicting changes in blast furnaces when the operating conditions are modified. In this paper, we revisit this methodology to provide a general model with additions and corrections. The reason for this is to study a new concept proposal that combines oxygen blast furnaces with Power to Gas technology. The latter produces synthetic methane by using renewable electricity and CO 2 to partly replace the fossil input in the blast furnace. Carbon is thus continuously recycled in a closed loop and geological storage is avoided. Methods: The new model is validated with three data sets corresponding to (1) an air-blown blast furnace without auxiliary injections, (2) an air-blown blast furnace with pulverized coal injection and (3) an oxygen blast furnace with top gas recycling and pulverized coal injection. The error is below 8% in all cases. Results: Assuming a 280 t HM/h oxygen blast furnace that produces 1154 kg CO2/t HM, we can reduce the CO 2 emissions between 6.1% and 7.4% by coupling a 150 MW Power to Gas plant. This produces 21.8 kg/t HM of synthetic methane that replaces 22.8 kg/t HM of coke or 30.2 kg/t HM of coal. The gross energy penalization of the CO 2 avoidance is 27.1 MJ/kg CO2 when coke is replaced and 22.4 MJ/kg CO2 when coal is replaced. Considering the energy content of the saved fossil fuel, and the electricity no longer consumed in the air separation unit thanks to the O 2 coming from the electrolyzer, the net energy penalizations are 23.1 MJ/kg CO2 and 17.9 MJ/kg CO2, respectively. Discussion: The proposed integration has energy penalizations greater than conventional amine carbon capture (typically 3.7 - 4.8 MJ/kg CO2), but in return it could reduce the economic costs thanks to diminishing the coke/coal consumption, reducing the electricity consumption in the air separation unit, and eliminating the requirement of geological storage.
Keywords: Blast furnace; CO2; Carbon capture; Oxyfuel combustion; Power to Gas; Rist diagram; ironmaking; operating diagram.
Copyright: © 2021 Bailera M et al.
Conflict of interest statement
No competing interests were disclosed.
Figures


References
-
- Mac Dowell N, Fennell PS, Shah N, et al. : The role of CO 2 capture and utilization in mitigating climate change. Nat Clim Chang. 2017;7:243–249. 10.1038/nclimate3231 - DOI
-
- Ueckerdt F, Bauer C, Dirnaichner A, et al. : Potential and risks of hydrogen-based e-fuels in climate change mitigation. Nat Clim Chang. 2021;11:384–393. 10.1038/s41558-021-01032-7 - DOI
-
- Bailera M, Lisbona P, Romeo LM, et al. : Power to Gas projects review: Lab pilot and demo plants for storing renewable energy and CO 2.Renew. Sustain Energy Rev. 2017;69:292–312. 10.1016/j.rser.2016.11.130 - DOI
-
- Bailera M, Lisbona P, Peña B, et al. : A review on CO 2 mitigation in the Iron and Steel industry through Power to X processes. J CO2 Util. 2021;46:101456. 10.1016/j.jcou.2021.101456 - DOI
-
- Hisashige S, Nakagaki T, Yamamoto T: CO 2 emission reduction and exergy analysis of smart steelmaking system adaptive for flexible operating conditions. ISIJ Int. 2019;59(4):598–606. 10.2355/isijinternational.ISIJINT-2018-355 - DOI
LinkOut - more resources
Full Text Sources
Research Materials
