. 2023 Aug 28;12(8):e1463.
doi: 10.1002/cti2.1463. eCollection 2023.

A unique cytotoxic CD4+ T cell-signature defines critical COVID-19

Affiliations

A unique cytotoxic CD4+ T cell-signature defines critical COVID-19

Sarah Baird et al. Clin Transl Immunology. .

Abstract

Objectives: SARS-CoV-2 infection causes a spectrum of clinical disease presentation, ranging from asymptomatic to fatal. While neutralising antibody (NAb) responses correlate with protection against symptomatic and severe infection, the contribution of the T-cell response to disease resolution or progression is still unclear. As newly emerging variants of concern have the capacity to partially escape NAb responses, defining the contribution of individual T-cell subsets to disease outcome is imperative to inform the development of next-generation COVID-19 vaccines.

Methods: Immunophenotyping of T-cell responses in unvaccinated individuals was performed, representing the full spectrum of COVID-19 clinical presentation. Computational and manual analyses were used to identify T-cell populations associated with distinct disease states.

Results: Critical SARS-CoV-2 infection was characterised by an increase in activated and cytotoxic CD4+ lymphocytes (CTL). These CD4+ CTLs were largely absent in asymptomatic to severe disease states. In contrast, non-critical COVID-19 was associated with high frequencies of naïve T cells and lack of activation marker expression.

Conclusion: Highly activated and cytotoxic CD4+ T-cell responses may contribute to cell-mediated host tissue damage and progression of COVID-19. Induction of these potentially detrimental T-cell responses should be considered when developing and implementing effective COVID-19 control strategies.

Keywords: CD4‐CTLs; COVID‐19; SARS‐CoV‐2; T cells; spectral cytometry.


Conflict of interest statement

The authors declare no conflict of interest.

Figures

Figure 1
Figure 1
Variance in the T‐cell compartment explained by COVID‐19 severity. (a) Principal component analysis (PCA) based on the relative abundance of 49 T‐cell populations in patients with asymptomatic to critical COVID‐19 (n = 36). Patient disease severity has been overlaid onto the PCA plot and ellipses represent 95% confidence intervals. (b) Variable contribution plot visualising the T‐cell populations that contribute to the principal components. Arrow direction represents correlation, where opposing direction is negative and adjacent arrows represent positive correlation between variables. Differences between groups were determined by permutational multivariate analysis of variants.
Figure 2
Figure 2
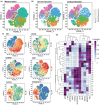
Unbiased clustering of T‐cell compartment in severe and critical patients. (a) FIt‐SNE visualisation of FlowSOM automatic clustering of a subsample of T cells from each severe (n = 5) and critical (n = 3) patient with conventional T‐cell population labels overlaid. (b) FIt‐SNE visualisation of alterations in proportion of metaclusters making up the T‐cell compartment between severe and critical disease. (c) Relative expression of cellular marker expression on FIt‐SNE visualisation of FlowSOM automatic clustering of a subsample of T cells from each severe (n = 5) and critical (n = 3) patient. (d) Heatmap plot showing the relative expression of each marker on self‐organised map metaclusters. The legend indicates the level of expression for each marker that is a normalised z‐score between 0 and 1.
Figure 3
Figure 3
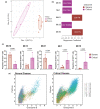
Comparative analysis of metacluster proportions in severe and critical patients. (a) Partial Least Squares Discriminant Analysis (PLS‐DA) of relative proportions of 23 CD4+ and CD8+ T‐cell population defined by automatic clustering, where ellipses represent 95% confidence intervals. (b) Christmas tree plot of the metaclusters contributing to the first component of the PLS‐DA, with the greatest contributors at the bottom, and the x‐axis indicates regression coefficient. (c) Non‐parametric Mann–Whitney U‐test of proportions of metaclusters between severe and critical infection patients; error lines represent median ± interquartile range. (d) Proportion of CD4+ T‐cell metaclusters by expression of GZMB and PFN in severe and critical disease patients.
Figure 4
Figure 4
Differentiation status of CD4+ and CD8+ T‐cell compartments. (a) Summary bar plots representing proportion of CD4+ and CD8+ T‐cell naïve and memory subsets between disease states defined as TN (CCR7+CD45RO), TCM (CCR7+CD45RO+), TEM (CCR7CD45RO+) and TEMRA (CCR7CD45RO). (b) Proportion of CD4+ and CD8+ TN and TEMRA subsets (c) Proportion of CD4+ TEMRA cells expressing HLA‐DA and PD‐1. (d) Proportion of CD4+ T cells expressing CXCR5 and CD45RO (TFH cells). Difference between groups were determined by the non‐parametric Kruskal–Wallis test, with comparison of the rank mean of experimental groups by the Original FDR method; error bars represent median ± interquartile range.
Figure 5
Figure 5
Cytotoxic CD4+ and CD8+ T cells are expanded in critical infection. (a) Proportion of GZMB+PFN+ CD4+ and CD8+ T cells across disease states. (b) Proportion of CD4+ T cells and TFH cells (CXCR5+CD45RO+) expressing GZMB and PFN. (c) Summary pie chart plot of the mean proportion of total CD4+ T cells and cytotoxic (GZMB+PFN+) CD4+ T cells defined as TN (CCR7+CD45RO), TCM (CCR7+CD45RO+), TEM (CCR7CD45RO+) and TEMRA (CCR7CD45RO) in critical infection patients (n = 3). (c) Summary pie chart plots of the mean proportion of total CD4+ TFH (CXCR5+CD45RO+) cells and cytotoxic (GZMB+PFN+) CD4+ TFH cells by CCR7+PD‐1 and CCR7PD‐1+ phenotype in critical infection patients (n = 3). Differences between groups were determined by the non‐parametric Kruskal–Wallis test, with comparison of the rank mean of experimental groups by the Original FDR method; error bars represent median ± interquartile range.

References

    1. WHO . WHO coronavirus (COVID‐19) dashboard. 2022. https://covid19.who.int
    1. Khoury DS, Cromer D, Reynaldi A et al. Neutralizing antibody levels are highly predictive of immune protection from symptomatic SARS‐CoV‐2 infection. Nat Med 2021; 27: 1205–1211. - PubMed
    1. Cromer D, Steain M, Reynaldi A et al. Predicting vaccine effectiveness against severe COVID‐19 over time and against variants: A meta‐analysis. Nat Commun 2023; 14: 1633. - PMC - PubMed
    1. Liu C, Ginn HM, Dejnirattisai W et al. Reduced neutralization of SARS‐CoV‐2 B.1.617 by vaccine and convalescent serum. Cell 2021; 184: 4220–4236.e13. - PMC - PubMed
    1. Favresse J, Bayart JL, Mullier F et al. Antibody titres decline 3‐month post‐vaccination with BNT162b2. Emerg Microbes Infect 2021; 10: 1495–1498. - PMC - PubMed