. 2023 Aug 14:17:1252759.
doi: 10.3389/fncir.2023.1252759. eCollection 2023.

Profiling neurotransmitter-evoked glial responses by RNA-sequencing analysis

Affiliations

Profiling neurotransmitter-evoked glial responses by RNA-sequencing analysis

Mengxiao Wang et al. Front Neural Circuits. .

Abstract

Fundamental properties of neurons and glia are distinctively different. Neurons are excitable cells that transmit information, whereas glia have long been considered as passive bystanders. Recently, the concept of tripartite synapse is proposed that glia are structurally and functionally incorporated into the synapse, the basic unit of information processing in the brains. It has then become intriguing how glia actively communicate with the presynaptic and postsynaptic compartments to influence the signal transmission. Here we present a thorough analysis at the transcriptional level on how glia respond to different types of neurotransmitters. Adult fly glia were purified from brains incubated with different types of neurotransmitters ex vivo. Subsequent RNA-sequencing analyses reveal distinct and overlapping patterns for these transcriptomes. Whereas Acetylcholine (ACh) and Glutamate (Glu) more vigorously activate glial gene expression, GABA retains its inhibitory effect. All neurotransmitters fail to trigger a significant change in the expression of their synthesis enzymes, yet Glu triggers increased expression of neurotransmitter receptors including its own and nAChRs. Expressions of transporters for GABA and Glutamate are under diverse controls from DA, GABA, and Glu, suggesting that the evoked intracellular pathways by these neurotransmitters are interconnected. Furthermore, changes in the expression of genes involved in calcium signaling also functionally predict the change in the glial activity. Finally, neurotransmitters also trigger a general metabolic suppression in glia except the DA, which upregulates a number of genes involved in transporting nutrients and amino acids. Our findings fundamentally dissect the transcriptional change in glia facing neuronal challenges; these results provide insights on how glia and neurons crosstalk in a synaptic context and underlie the mechanism of brain function and behavior.

Keywords: RNA-sequencing; glia; metabolic suppression; neurotransmitter; signal transduction.


Conflict of interest statement

The authors declare that the research was conducted in the absence of any commercial or financial relationships that could be construed as a potential conflict of interest.

Figures
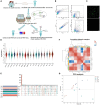
FIGURE 1
FIGURE 1
Purification and RNA-sequencing of neurotransmitter-treated adult fly glia. (A) An schematic diagram illustrating the purification, sorting, and gene expression analysis of adult fly glia treated with neurotransmitters ex vivo. A total of 200 adult fly brains were dissected and treated with different neurotransmitters for 30 min. Neurotransmitters used: Glu, DA, ATP, ACh, and GABA. The brain tissues were homogenized into suspended and GFP-positive single cells and subsequently sorted by FACS. Novaseq sequencing technology was used to sequence all mRNAs in the transcriptome, and Illumina Truseq™ RNA sample prep Kit was used to construct the library. The sequencing results were verified by RT-qPCR. (B) The FACS sorting plot of adult fly glia. P4 was classified according to the fluorescence intensity, and a FITC-A value over 102 was identified as GFP-positive single-cell population. (C) Confocal microscopy visualizing the cell suspension before and after FACS sorting. Scale bar, 50 μm. (D) The Violin plot of sample expression distribution. Each color represents one sample, and the enlarged part represents the region with the most concentrated gene expression. (E) The Upset plot of sample expression distribution. The horizontal bar chart on the left represents the expression quantity of each sample. The middle matrix shows the number of overlapping genes in each category. (F) Sample distance heatmap (Pearson correlation analysis). The correlation analysis indicates that the results from three replicates are consistent and the data are reliable (ideal biological replication R2 > 0.92). (G) Principal component analysis (PCA analysis). After dimensionality reduction analysis, the samples have relative coordinate points on the principal component, indicating the distance among the samples. The closer the distance, the higher the similarity between the samples.
FIGURE 2
FIGURE 2
Analysis of differentially expressed genes (DEGs) in neurotransmitter-treated adult fly glia. (A) The Upset plot of DEGs. The horizontal bar chart on the left represents the number of differential genes expressed in each sample. The matrix revealed the number of overlapping genes in each category. (B) Bar graph showing the number of DEGs in each group. The number of upregulated genes (blue) and the downregulated genes (red) were listed on the top of the bars for each group. Note that more upregulated than the downregulated genes were identified for DA- and Glu-treated adult fly glia, whereas the rest is the opposite. Down-regulated genes were identified as FC ≤ 0.5 and up-regulated genes as FC ≥ 2. Adj. p-value ≤ 0.05. FC, fold change; adj., adjusted (Benjamin–Hochberg multiple comparison method). (C) Differential gene heatmap comparing glia treated with different types of neurotransmitters. Y-axis: individual genes categorized into groups with left color labels green, blue, and red. X-axis: five different sample groups. A color tile is present on the right with red and blue indicate higher or lower expression level of the designated genes, respectively. The left Y-axis also reveals the tree diagram of gene clustering and the module diagram of sub clustering, Z-score is used for standardization, and the value of TPM +1 is converted by log10. When the score is lower than the average value, z is negative; otherwise, it is positive.
FIGURE 3
FIGURE 3
Neurotransmitters trigger changes in the expression of related receptors and transporters in glia. (A–E) The Volcano plot (top) and the cluster heatmap (bottom) are shown. Genes shown in both are similarly selected by their expression level change with the adjusted p-value < 0.05, log2FC > 1 for the increased gene expression (red); the adjusted p-value < 0.05, log2FC < –1 for the decreased gene expression (blue). Multiple comparisons were conducted by the Benjamin–Hochberg analysis. DEGs are boxed out in the Volcano plot. Panels (A–E) represent analysis for glia treated with ACh (A), ATP (B), DA (C), GABA (D), and Glu (E).
FIGURE 4
FIGURE 4
Neurotransmitters trigger changes in the expression of genes related to glial activity. The Volcano plot (top) and the cluster heatmap (bottom) are shown. Genes shown in both are similarly selected by their expression level change with the adjusted p-value < 0.05, log2FC > 1 for the increased gene expression (red); the adjusted p-value < 0.05, log2FC < –1 for the decreased gene expression (blue). Multiple comparisons were conducted by the Benjamin–Hochberg analysis. DEGs are boxed out in the Volcano plot. Panels (A–E) represent analysis for glia treated with ACh (A), ATP (B), DA (C), GABA (D), and Glu (E).
FIGURE 5
FIGURE 5
Neurotransmitters trigger changes in the expression of genes related to metabolism. (A–E) The Volcano plot (top) and the cluster heatmap (bottom) are shown. Genes shown in both are similarly selected by their expression level change with the adjusted p-value < 0.05, log2FC > 1 for the increased gene expression (red); the adjusted p-value < 0.05, log2FC < –1 for the decreased gene expression (blue). Multiple comparisons were conducted by the Benjamin–Hochberg analysis. DEGs are boxed out in the Volcano plot. Panels (A–E) represent analysis for glia treated with ACh (A), ATP (B), DA (C), GABA (D), and Glu (E).
FIGURE 6
FIGURE 6
An illustration on the mutual regulatory network in adult fly glia among different neurotransmitters. (A) The reciprocal effect of ACh and Glu on glia by regulating the receptor expression. (B) The interactive and overlapping network of neurotransmitter-triggered glial responses among DA, Glu, and GABA. Note that the three exhibit reciprocal effect on one or another.

Similar articles

References

    1. Allen N. J., Lyons D. A. (2018). Glia as architects of central nervous system formation and function. Science 362 181–185. - PMC - PubMed
    1. Awasaki T., Lai S. L., Ito K., Lee T. (2008). Organization and postembryonic development of glial cells in the adult central brain of Drosophila. J. Neurosci. 28 13742–13753. 10.1523/JNEUROSCI.4844-08.2008 - DOI - PMC - PubMed
    1. Bonvento G., Bolanos J. P. (2021). Astrocyte-neuron metabolic cooperation shapes brain activity. Cell Metab. 33 1546–1564. - PubMed
    1. Boudko D. Y. (2012). Molecular basis of essential amino acid transport from studies of insect nutrient amino acid transporters of the SLC6 family (NAT-SLC6). J. Insect Physiol. 58 433–449. 10.1016/j.jinsphys.2011.12.018 - DOI - PMC - PubMed
    1. Brunet Avalos C., Maier G. L., Bruggmann R., Sprecher S. G. (2019). Single cell transcriptome atlas of the Drosophila larval brain. Elife 8:50354. 10.7554/eLife.50354 - DOI - PMC - PubMed

Publication types

LinkOut - more resources