[Preprint]. 2023 Sep 6:2023.08.16.553527.
doi: 10.1101/2023.08.16.553527.

Highly multiplexed mRNA quantitation with CRISPR-Cas13

Affiliations

Highly multiplexed mRNA quantitation with CRISPR-Cas13

Brian Kang et al. bioRxiv. .

Abstract

RNA quantitation tools are often either high-throughput or cost-effective, but rarely are they both. Existing methods can profile the transcriptome at great expense or are limited to quantifying a handful of genes by labor constraints. A technique that permits more throughput at a reduced cost could enable multi-gene kinetic studies, gene regulatory network analysis, and combinatorial genetic screens. Here, we introduce quantitative Combinatorial Arrayed Reactions for Multiplexed Evaluation of Nucleic acids (qCARMEN): an RNA quantitation technique which leverages the programmable RNA-targeting capabilities of CRISPR-Cas13 to address this challenge by quantifying over 4,500 gene-sample pairs in a single experiment. Using qCARMEN, we studied the response profiles of interferon-stimulated genes (ISGs) during interferon (IFN) stimulation and flavivirus infection. Additionally, we observed isoform switching kinetics during epithelial-mesenchymal transition. qCARMEN is a simple and inexpensive technique that greatly enhances the scalability of RNA quantitation for novel applications with performance similar to gold-standard methods.


Conflict of interest statement

Competing interests B.K., A.P., and C.M. have filed a provisional patent application on the use of qCARMEN. None of the other authors have competing interests pursuant to results presented here.

Figures

Extended Data Fig. 1 |
Extended Data Fig. 1 |. Diversity of fluorescence kinetics.
From left to right: 100X serial dilutions of Huh7.5 RNA extract.
Extended Data Fig. 2 |
Extended Data Fig. 2 |. Improving multiplexed amplification with rhPCR.
a, Multiplexed amplification of RNA extract from naive Huh7 cells with conventional PCR primers. b, Multiplexed amplification of RNA extract with rhPCR primers. c, Fluorescence output after 3 hours of qCARMEN reaction for ISG panel.
Extended Data Fig. 3 |
Extended Data Fig. 3 |. Model parameter distributions.
a, Calculated parameter values for GAPDH. b, Calculated parameter values for ADAR.
Extended Data Fig. 4 |
Extended Data Fig. 4 |. RNA-Seq analysis of Huh7 cells harboring subgenomic YFV17D and YFV-Asibi replicons.
a, RNA-Seq workflow. b, Summary of uniquely upregulated innate immunity genes.
Extended Data Fig. 5 |
Extended Data Fig. 5 |. Spearman correlations with interferon response kinetics.
a, Spearman correlations for IFN-α stimulation experiments. b, Spearman correlations for IFN-λ stimulation results.
Extended Data Fig. 6 |
Extended Data Fig. 6 |. Antigen staining for infection quantification.
a, Percent of antigen-positive cells for HCV (2 MOIs). b, Percent of antigen-positive cells for flavivirus-infected cells. Error bars presented as SD. c, Infected cell populations for HCV samples. d, Infected cell populations for flavivirus samples.
Fig. 1 |
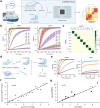
Fig. 1 |. Validating the sensitivity, specificity, and accuracy of qCARMEN.
a, Following an RNA extraction step, samples are amplified using commercially available rhPCR primers and combined with a Cas13 assay mix in a microfluidic chip. Reactions run for three hours and fluorescent signals are recorded for downstream analysis. b, Serial dilutions of Huh7.5 cellular RNA extracts show sensitive detection of housekeeping genes as low as 1–10 copies/μL depending on the target of interest. Error bars presented as 95% confidence intervals. c, Cas13 reporter assays generate fluorescent signals in the presence of a target that is at least 5-fold greater than the background fluorescence. d, Simplified model of the Cas13 detection reaction. e, The mathematical model generates precise fits to real-world fluorescence data. f, Calculated fold-changes for serially diluted synthetic HPRT1 RNA targets plotted against dilution factors. g, Huh7 cells were infected with YFV-17D at a MOI of 0.05 and fold-changes in expression of ten genes at 2 dpi were calculated using RT-qPCR and qCARMEN with considerable agreement between the two methods. Error bars presented as SEM (n=3).
Fig. 2 |
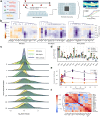
Fig. 2 |. Development of an interferon-stimulated gene (ISG) panel.
a, U2OS cells were stimulated with IFNs β, α, and λ to dysregulate ISG expression. Timepoint samples were collected over the course of 72 hours for stimulated and naïve cells for downstream analysis with qCARMEN. b, Gene expression changes of ISGs after IFN stimulation (120 IU/mL of IFN-β, 800 IU/mL of IFN-α, 40 ng/mL of IFN-λ) across all eight timepoints for type I and III IFN experiments. c, Ridge-line plots showing overall changes in kinetics across stimulated ISGs. d, log2 fold-changes in ISG expression levels after 24 hours. Error bars presented as SEM (n=3). e, Tetherin (BST2), OASL, and SSBP3 demonstrate differential kinetics all within IFN β-stimulated cells. f, Pairwise Spearman correlations for IFN β-stimulated genes; simple average used for linkage to calculate clusters with euclidean distance metric.
Fig. 3 |
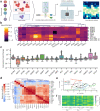
Fig. 3 |. Application of the ISG panel towards understanding flavivirus infections.
a, Huh7 cells were infected with nine flaviviruses. Total RNA extracted from infected Huh7 cells was used as input for the qCARMEN ISG panel. b, Calculated fold-changes in expression for ISG panel genes across infected cells compared to naive cells. c, The distribution of fold-changes for each gene across viral infections and replicates. Boxplot whiskers extend to 1.5 times the interquartile range; outliers represented with diamond markers. d, Pairwise Spearman correlations of dysregulated ISGs in response to flavivirus infection. e, Gene expression vectors at each timepoint for all three IFNs plotted along two principal components to illustrate the trajectory of expression changes across core ISGs. PCA were transformations performed on flavivirus ISG signatures to overlay the expression profiles on top of IFN stimulation trajectories. Gold star represents 0-hour timepoint. Light to dark: 1, 2, 4, 8, 24, 48, 72-hour timepoints. f, Euclidean distance between flavivirus PCA projections and IFN timepoint vectors to characterize flavivirus ISG changes in the context of IFN responses.
Fig. 4 |
Fig. 4 |. Quantifying changes in dominant splice isoforms during epithelial-mesenchymal transition.
a, Schematic representation of the experimental design. b, Cas13-based detection of synthetic FGFR2 isoforms is largely specific with relatively minimal background compared to positive controls. c, Detection of synthetic FGFR2 isoform dilutions. Serial 10X dilutions of IIIb isoform of FGFR2 with IIIc isoform at a constant concentration (left). Serial 10X dilutions of IIIc isoform with IIIb isoform left constant. Error bars presented as 95% confidence intervals. d, Calculated changes in expression across downregulated epithelial (E) and upregulated mesenchymal (M) splice isoforms in both MCF7 (left) and T47D (right) cells after treatment with TGF-β. e, CD44s (mesenchymal form) increases relative to the initial timepoint after 72 hours; CD44v (epithelial form) decreases approximately 2-fold after 72 hours. Error bars presented as SEM (n=3). f, Kinetics of EXOC7 isoforms over a 72-hour timecourse.

References

    1. Devonshire A. S. et al. Application of next generation qPCR and sequencing platforms to mRNA biomarker analysis. Methods 59, 89–100 (2013). - PubMed
    1. Kaminski M. M., Abudayyeh O. O., Gootenberg J. S., Zhang F. & Collins J. J. CRISPR-based diagnostics. Nat Biomed Eng 5, 643–656 (2021). - PubMed
    1. Makarova K. S. et al. Evolutionary classification of CRISPR-Cas systems: a burst of class 2 and derived variants. Nat. Rev. Microbiol. 18, 67–83 (2020). - PMC - PubMed
    1. East-Seletsky A. et al. Two distinct RNase activities of CRISPR-C2c2 enable guide-RNA processing and RNA detection. Nature 538, 270–273 (2016). - PMC - PubMed
    1. Gootenberg J. S. et al. Nucleic acid detection with CRISPR-Cas13a/C2c2. Science 356, 438–442 (2017). - PMC - PubMed

Publication types