[Preprint]. 2023 Dec 21:2023.08.18.23294259.
doi: 10.1101/2023.08.18.23294259.

Timing dependent synergies between motor cortex and posterior spinal stimulation in humans

Affiliations

Timing dependent synergies between motor cortex and posterior spinal stimulation in humans

James R McIntosh et al. medRxiv. .

Update in

Abstract

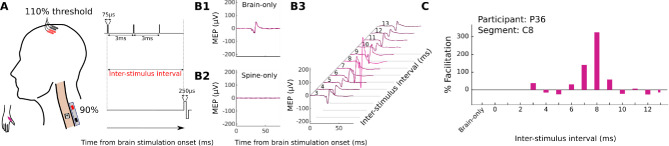
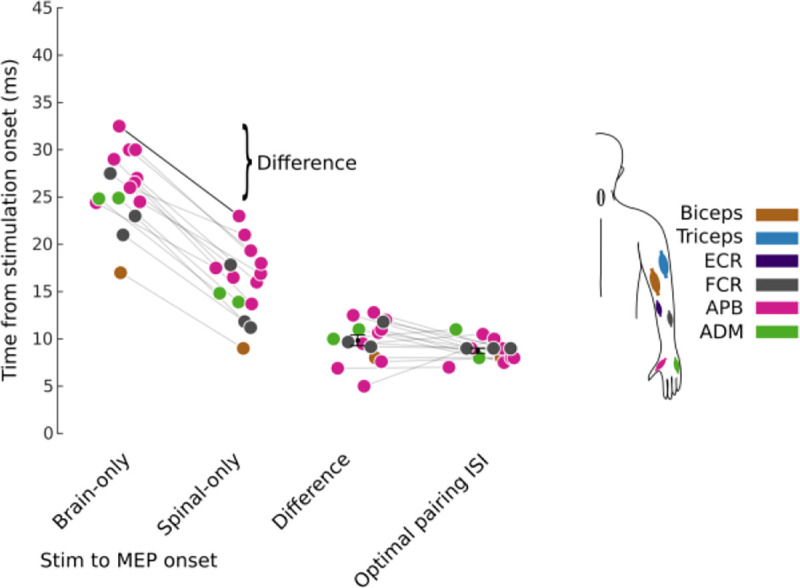
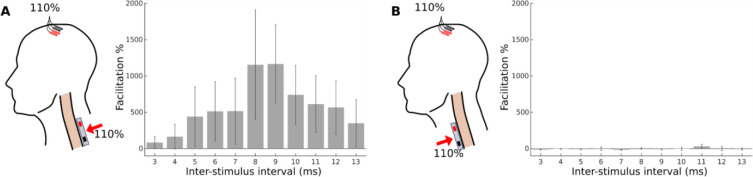
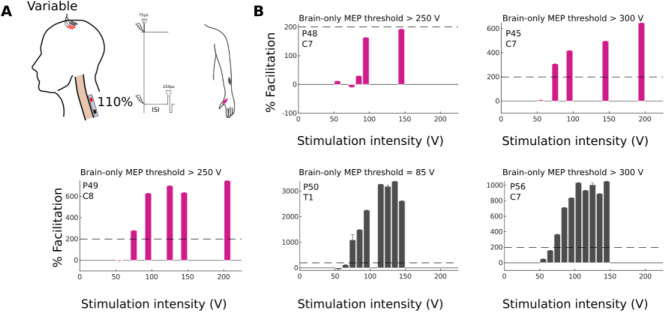
Volitional movement requires descending input from motor cortex and sensory feedback through the spinal cord. We previously developed a paired brain and spinal electrical stimulation approach in rats that relies on convergence of the descending motor and spinal sensory stimuli in the cervical cord. This approach strengthened sensorimotor circuits and improved volitional movement through associative plasticity. In humans it is not known whether dorsal epidural SCS targeted at the sensorimotor interface or anterior epidural SCS targeted within the motor system is effective at facilitating brain evoked responses. In 59 individuals undergoing elective cervical spine decompression surgery, the motor cortex was stimulated with scalp electrodes and the spinal cord with epidural electrodes while muscle responses were recorded in arm and leg muscles. Spinal electrodes were placed either posteriorly or anteriorly, and the interval between cortex and spinal cord stimulation was varied. Pairing stimulation between the motor cortex and spinal sensory (posterior) but not spinal motor (anterior) stimulation produced motor evoked potentials that were over five times larger than brain stimulation alone. This strong augmentation occurred only when descending motor and spinal afferent stimuli were timed to converge in the spinal cord. Paired stimulation also increased the selectivity of muscle responses relative to unpaired brain or spinal cord stimulation. Finally, paired stimulation effects were present regardless of the severity of myelopathy as measured by clinical signs or spinal cord imaging. The large effect size of this paired stimulation makes it a promising candidate for therapeutic neuromodulation.

Keywords: Cervical; Electrical stimulation; Epidural; Motor cortex; Motor evoked potentials; Myelopathy; Spinal cord.


Conflict of interest statement

5.1Competing interests Jason B. Carmel is a Founder and stock holder in BackStop Neural and a scientific advisor and stockholder in SharperSense. He has received honoraria from Pacira, Motric Bio, and Restorative Therapeutics. Michael S. Virk has been a consultant and has received honorarium from Depuy Synthes and BrainLab Inc; he is on the Medical Advisory Board and owns stock with OnPoint Surgical. K. Daniel Riew: Consulting: Happe Spine (Nonfinancial), Nuvasive; Royalties: Biomet, Nuvasive; Speaking and/or Teaching Arrangements: Nuvasive (Travel Expense Reimbursement); Stock Ownership: Amedica, Axiomed, Benvenue, Expanding Orthopedics, Happe Spine, Paradigm Spine, Spinal Kinetics, Spineology, Vertiflex. Ronald A. Lehman: Consulting: Medtronic; Royalties: Medtronic, Stryker. Zeeshan M. Sardar: Consulting: Medtronic; Grant/Research support from the Department of Defense. Joseph M. Lombardi: Consulting: Medtronic, Stryker. The other authors have nothing to disclose.

Figures

Figure 1.
Figure 1.. Epidural spinal cord and brain stimulation experiment during posterior and anterior cervical spine surgery.
A, Colors correspond to different recorded muscles (see legend). Subdermal needles were placed for brain stimulation. Catheter electrode shown placed below the lamina on the posterior aspect of the spinal cord. B, Example of catheter placement targeting dorsal root fibres, relative to bony anatomy when the posterior aspect of the spinal cord is being stimulated. X-ray was acquired after surgical instrumentation but prior to removal of the catheter. Red arrows indicate the contacts of the catheter electrode. C, The catheter electrode was used to stimulate the posterior (top) or anterior (bottom) aspect of the spinal cord in different participants. The posterior location targets the dorsal root entry zone, while the anterior location targets the ventral root exit.
Figure 2.
Figure 2.. Experimental paradigm and results of varying the timing of spinal stimulation relative to transcranial electrical stimulation (tES) in a single participant.
A, Schematic: three pulses are delivered over the motor cortex followed by a variable period of time (inter-stimulus interval; ISI) before a single pulse is delivered to the spinal cord. The catheter electrode was positioned over the C8 dorsal spinal cord, and the abductor pollicis brevis (APB) was the target muscle. B1, Brain-only baseline condition. The intensity of cortical stimulation was set to 110% of the APB threshold, ensuring a small MEP in the brain-only condition. B2, Spinal baseline condition. The intensity of spinal stimulation was set to 90% of the APB threshold, so no MEP was observed with spinal-only stimulation. B3, Paired stimulation. Averaged responses over 5 trials with variable ISI. C, Quantification of pairing facilitation. The facilitation is calculated relative to the brain-only MEP size. Facilitation of 324% was observed when the inter-stimulus interval was set to 8 milliseconds.
Figure 3.
Figure 3.. Augmentation of motor cortex MEPs with posterior, but not anterior, spinal stimulation.
A, Schematic: 110% threshold transcortical electrical stimulation is combined with 90% threshold posterior cervical spinal stimulation. A strong facilitation is present when averaging across participants (n = 38, 23M/15F). B, Schematic: as in A but cervical stimulation applied to the anterior aspect of the spinal cord. Anterior stimulation results in no observable facilitation (n = 12, 4M/8F). Across-participant signed-rank test, *p < .05, **p < .01, ***p < .001, Bonferroni corrected for multiple comparisons.
Figure 4.
Figure 4.. Estimate of optimal pairing ISI from brain and spinal MEP onset times.
Subtracting the brain-only MEP onset time from the spinal-only MEP onset time produces a difference in the onset times (9.8±0.6ms) which acts as an estimate of the spinal cord convergence time. This estimate is not significantly different from the estimate of the optimal pairing ISI (8.8±0.3ms; p = 0.15, signed-rank test). Onset times for brain-only and spinal-only MEPs were estimated programmatically and refined manually. The programmatic detection extracted the first time point where the MEP magnitude was nine times its pre-stimulation standard deviation. This time point was then further refined by tracing the MEP back to its x-axis crossing. The optimal pairing ISI was estimated by taking the time of maximum facilitation for all cases where facilitation was greater than 50%. Connecting lines represent the same participant. Marker colours correspond to targeted muscles. Data shown only for participants (n = 15, 9M/6F) where an estimate of the brain-only, spinal-only and optimal pairing ISI could be made.
Figure 5.
Figure 5.. Suprathreshold posterior but not anterior spinal cord stimulation produces synergistic effects when paired with suprathreshold tES.
A, Schematic: 110% threshold transcortical electrical stimulation is combined with 110% threshold posterior cervical spinal stimulation. A strong facilitation is present when averaging across participants (n = 10, 6M/4F). The peak facilitation is 1174% at 9ms relative to the sum of brain-only and spinal-only stimulation. B, Schematic: as in A but cervical stimulation applied to the anterior aspect of the spinal cord. In contrast, posterior aspect stimulation anterior stimulation results in no observable facilitation (n = 8, 3M/5F; peak facilitation = 38% at 11 ms).
Figure 6.
Figure 6.. Facilitation occurs 2–3ms after cortical stimulation.
A, Schematic: Subthreshold (150V) single pulse transcortical electrical stimulation is combined with 110% threshold posterior cervical spinal stimulation. Example for an individual participant (P56). The catheter electrode was positioned over the C7 dorsal root entry zone (DREZ) of the spinal cord and the FCR was the target muscle. B1, Brain-only baseline condition. The intensity of transcranial stimulation was set to 150 V and no MEP was present below the maximum tested 300 V. B2, Spinal-only baseline condition. The intensity of spinal stimulation was set to 110% of the target threshold needed to induce a motor evoked potential (MEP). B3, Paired stimulation. Averaged responses over 10 trials with variable ISI. C, Quantification of pairing facilitation. The facilitation is calculated relative to the spinal-only MEP size. While the peak facilitation appears to be at 2.5 ms, the earliest facilitation appears to be in the range 1–1.5 ms. D, Epidural spinal recordings. Brain-only stimulation was applied while a recording was made from the spinal electrode. A deflection is visible starting at 2.8 ms with the maximal deflection occurring at 4 ms. The stimulation artefact prior to 2.5 ms has been clipped for visualisation purposes. E, Average over participants (n = 11, 4M/7F) receiving subthreshold (77–288 V) single pulse transcortical electrical stimulation combined with 110% threshold posterior cervical spinal stimulation. The optimal ISI when single pulse cortical stimulation is used is 3ms.
Figure 7.
Figure 7.. Suprathreshold spinal MEPs are strongly facilitated by extremely subthreshold single pulse transcranial electrical stimulation.
A, Schematic: a single pulse delivered to the brain and spinal cord and choice of stimulation intensities. B, Cortical stimulation intensity was adjusted upwards from 50V while spinal stimulation intensity was maintained at 110% of threshold (n = 5, 1M/4F). Pairing was applied at the optimal inter-stimulus interval as determined in a previous experiment. Facilitation is initiated between 50V and 100 V in all cases, which is considerably lower than the threshold for brain-only stimulation in the majority of experiments (see text in figures). Bar colours correspond to the targeted muscle as shown in A.
Figure 8.
Figure 8.. Facilitation is greatest in targeted muscles.
A, Schematic: a triple pulse stimulation delivered to the brain and single pulse stimulation delivered to the spinal cord. For the muscle that was optimised for, intensity of brain stimulation was set to be 110% of threshold, and the intensity of spine stimulation was set to be 90% of threshold. The baseline condition used for normalisation is the sum of brain-only and spinal-only MEPs. B, In one example participant, the catheter electrode was positioned over the C6 dorsal root entry zone (DREZ) of the spinal cord and the Biceps muscle was targeted. Facilitation was strong in the targeted muscle and present in muscles innervated at nearby segments. Shoulder and leg muscles omitted for visualisation purposes. C, In a different participant, the catheter electrode was placed over the C8 DREZ and the APB was targeted. Strong facilitation was present in the target muscle but was also present in ECR and FCR.
Figure 9.
Figure 9.. Paired brain and spine stimulation yields more selective activation of individual muscles.
A, Example of individual muscle selectivity from a single participant showing that for the FCR and APB the selectivity of pairing is larger than for either brain-only or spinal-only stimulation alone. B, Selectivity as in A can be pooled across participants (n = 38, 23M/15F) by selecting the selectivity corresponding to the target muscle from each participant. Median target muscle selectivity is higher for pairing stimulation than for brain-only stimulation. While it is also higher for pairing stimulation than spinal-only stimulation this difference is not statistically significant. C, Across muscle selectivity measures the selectivity of muscle activation irrespective of the target muscle and is higher for pairing stimulation than for both brain-only stimulation and spinal-only stimulation (n = 38, 23M/15F). For B and C: Individual lines correspond to individual participants. Dark line corresponds to the participant shown in A. Hinges represent 1st and 3rd quartile, and whiskers span the range of the data not considered outliers (defined as q3 + 1.5 × (q3 − q1) or less than q1 − 1.5 × (q3 − q1)).
Figure 10.
Figure 10.. Activation of muscles is most selective near optimum inter-stimulus intervals.
A, Example of target muscle selectivity (APB) from a single participant. Change in selectivity of pairing from brain- and spinal-only is strongest at an inter-stimulus interval of 7–8 ms. 0% change in selectivity indicates that pairing selectivity is the same as the selectivity computed on the sum of the brain-only (110%) and spinal-only (90%) MEP-size. B, Selectivity change as in A can be pooled across participants (n = 38, 23M/15F) by choosing the selectivity corresponding to the target muscle from each participant. Average target selectivity is highest at an ISI of 9 ms, corresponding to the timing of optimal pairing. C, Change in the across muscle selectivity measure also shows the highest selectivity to be at an ISI of 9 ms, albeit at lower magnitude. Across-participant signed-rank test, *p < .05, not corrected for multiple comparisons (n = 38, 23M/15F). D, The selectivity change (as in B) increases (t-test, n = 38, 23M/15F) as the facilitation increases with varying ISI (Fig. 3A).
Figure 11.
Figure 11.. No relation between immediate effect size and degree of impairment.
A1, mJOA. A2, Average strength in the forearm and hand (MRC scale). A3, Biceps reflex score. A4, Triceps reflex score. B1, Hyperintensity on T2-weighted MRI signal at the stimulated segment. B2, T2 hyperintensity bove the stimulated segment. B3, Severe foraminal stenosis at the stimulated segment. Text represents median % facilitation. Across-participant signed-rank test, *p < .05, no correction for multiple comparisons was applied.

References

    1. Al’joboori Yazi, Hannah Ricci, Lenham Francesca, Borgas Pia, Kremers Charlotte J. P., Bunday Karen L., Rothwell John, and Duffell Lynsey D.. 2021. “The Immediate and Short-Term Effects of Transcutaneous Spinal Cord Stimulation and Peripheral Nerve Stimulation on Corticospinal Excitability.” Frontiers in Neuroscience 15. 10.3389/fnins.2021.749042. - DOI - PMC - PubMed
    1. Angeli Claudia A., Boakye Maxwell, Morton Rebekah A., Vogt Justin, Benton Kristin, Chen Yangshen, Ferreira Christie K., and Harkema Susan J.. 2018. “Recovery of Over-Ground Walking after Chronic Motor Complete Spinal Cord Injury.” New England Journal of Medicine 379 (13): 1244–50. 10.1056/NEJMoa1803588. - DOI - PubMed
    1. Asan Ahmet S., McIntosh James R., and Carmel Jason B.. 2022. “Targeting Sensory and Motor Integration for Recovery of Movement After CNS Injury.” Frontiers in Neuroscience 15. 10.3389/fnins.2021.791824. - DOI - PMC - PubMed
    1. Benzel Edward C., Lancon John, Kesterson Lee, and Hadden Theresa. 1991. “Cervical Laminectomy and Dentate Ligament Section for Cervical Spondylotic Myelopathy.” Clinical Spine Surgery 4 (3): 286. - PubMed
    1. Brendler Samuel J. 1968. “The Human Cervical Myotomes: Functional Anatomy Studied at Operation.” Journal of Neurosurgery 28 (2): 105–11. 10.3171/jns.1968.28.2.0105. - DOI - PubMed

Publication types