[Preprint]. 2023 Aug 15:2023.08.14.553154.
doi: 10.1101/2023.08.14.553154.

A non-canonical mechanism of GPCR activation

Affiliations

A non-canonical mechanism of GPCR activation

Alexander S Powers et al. bioRxiv. .

Update in

  • A non-canonical mechanism of GPCR activation.
    Powers AS, Khan A, Paggi JM, Latorraca NR, Souza S, Di Salvo J, Lu J, Soisson SM, Johnston JM, Weinglass AB, Dror RO. Powers AS, et al. Nat Commun. 2024 Nov 16;15(1):9938. doi: 10.1038/s41467-024-54103-6. Nat Commun. 2024. PMID: 39550377 Free PMC article.

Abstract

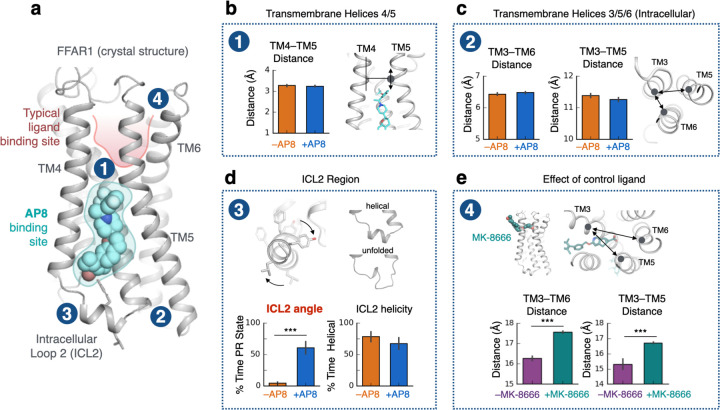
The goal of designing safer, more effective drugs has led to tremendous interest in molecular mechanisms through which ligands can precisely manipulate signaling of G-protein-coupled receptors (GPCRs), the largest class of drug targets. Decades of research have led to the widely accepted view that all agonists-ligands that trigger GPCR activation-function by causing rearrangement of the GPCR's transmembrane helices, opening an intracellular pocket for binding of transducer proteins. Here we demonstrate that certain agonists instead trigger activation of free fatty acid receptor 1 by directly rearranging an intracellular loop that interacts with transducers. We validate the predictions of our atomic-level simulations by targeted mutagenesis; specific mutations which disrupt interactions with the intracellular loop convert these agonists into inverse agonists. Further analysis suggests that allosteric ligands could regulate signaling of many other GPCRs via a similar mechanism, offering rich possibilities for precise control of pharmaceutically important targets.


Conflict of interest statement

Competing Financial Interests A.K., S.S., J.D.S., J.L., S.M.S., J.M.J., A.M.W. are current or past employees of Merck Research Laboratories.

Figures

Figure 1.
Figure 1.. Unlike typical GPCR ligands, AP8 controls the conformation of intracellular loop but does not affect key transmembrane helices.
(a) The crystal structure of FFAR1 (PDB 5TZY) shows agonist AP8 (cyan) bound to a membrane-facing pocket near intracellular loop 2 (ICL2) and transmembrane helix 3, 4, 5 (TM3, TM4, TM5). Other FFAR1 agonists, such as MK-8666, bind in a more typical pocket (highlighted in red) within the extracellular region of the receptor. (b, c) AP8 does not significantly affect the conformation of key TM helices in molecular dynamics simulations. The conformation of TM5 was measured by its vertical shift relative to TM4 (see Methods), which differs by 3 Å between the AP8-bound and AP8-free crystal structures. The intracellular conformation of TM helices was measured by distances between Cɑ atoms (TM3-TM6: residue 105 Cɑ to 222 Cɑ, TM3-TM5: 104 Cɑ to 208 Cɑ). Data presented as mean of 5–10 independent simulations, each at least 2 µs in length; blue bars are simulations started from AP8-bound crystal structure and orange bars are simulations started from AP8-free crystal structure (n.s., not significant; P>0.05 for all comparisons by two-sided t-test; error bars are 68% confidence interval, CI). (d) AP8 has a significant effect on the orientation of the ICL2 helix in simulation as measured by the rotation about the helical axis (see Methods). The conformation of ICL2, both angle and helicity, was quantified over simulations with and without AP8 bound, started from the AP8-bound crystal structure. Data presented as mean of 5–10 independent simulations (*** indicates P<0.001 by two-sided t-test; error bars are 68% CI). (e) For comparison, control ligand MK-8666 does have a substantial effect on key TM helices, in particular the extracellular ends of TM3, 5, and 6 as measured by distances between Cɑ atoms (TM3-TM6: residue 83 Cɑ to 184 Cɑ, TM3-TM5: 83 Cɑ to 244 Cɑ). Data presented as mean of 5–10 independent simulations; green bars are simulations started from MK-8666-bound crystal structure and purple bars are simulations with MK-8666 removed.
Figure 2.
Figure 2.. Ligand directly affects the intracellular receptor surface by rotating intracellular loop 2.
(a) Simulations of the receptor with AP8 bound (blue) favor one stable ICL2 conformation (PR state) while simulations without AP8 (orange) favor a distinct negatively rotated ICL2 conformation (NR state). Both simulations were started from the same structure. Representative simulation snapshots are shown at indicated timepoints overlaid on the AP8-bound crystal structure (light grey). Simulation trajectories show the ICL2 angle as measured by the rotation of L112 and Y114 around the ICL2 helix axis (see Methods). Dashed line indicates the distance in the starting structure. (b) AP8 alters a network of polar interactions; the frequency of water-mediated hydrogen bonds between key ICL2 residues were quantified in presence and absence of AP8. Data presented as mean of 5–10 independent simulations (error bars are 68% CI). Only simulation frames where ICL2 remained folded were used. (c) Simulation frames show representative hydrogen bonds (yellow dashes) formed with and without AP8 bound. With AP8 bound, a stable water molecule forms a hydrogen bond network bridging AP8 and the ICL2 backbone. In the absence of AP8, the water molecule reorients to form a new stable network of hydrogen bonds, necessitating a rotation of ICL2.
Figure 3.
Figure 3.. ICL2 helix orientation affects G protein binding.
(a) Model of active FFAR1 with bound AP8 and heterotrimeric Gq constructed from homology modeling and alignment with other complexes (see Methods). Zoomed image shows that ICL2 in the AP8-stabilized conformation (PR state) forms a tight interface with Gqɑ (red). In the lower image, ICL2 modeled in the NR state has poor shape complementarity with the Gq surface. (b) AP8 and Gq both independently stabilize the PR state of ICL2, and do so to an even greater degree together, indicating a cooperative effect. Data presented as mean of 5–10 independent simulations for each condition, each 1 µs in length (error bars are 68% CI). The simulation trace below shows ICL2 angle vs. time for the receptor only condition (grey) and receptor-Gq condition (red). When Gq is bound to the receptor, the ICL2 PR state is stabilized relative to the receptor alone. (c) ICL2 conformation is also coupled to the orientation of Gq relative to the receptor, in particular Gα helix 5. Representative simulation frames (left) and traces (middle) of the FFAR1-Gq model are shown with and without AP8 bound. In images, the starting structure is shown in grey and the simulation frame in color. The displacement of the Gα helix 5 was calculated by aligning simulation frames on the receptor and calculating the root mean square displacement (RMSD) of helix 5 (terminal 10 residues) relative to the starting structure. Bars (right) show mean displacement from 5–10 independent simulations for each condition, each 1 µs in length (error bars are 68% CI).
Figure 4.
Figure 4.. Mutagenesis experiments validate computationally derived activation mechanism.
(a, b) At the mutated G3.49E receptor, AP8 acts as an inverse agonist. FFAR1 activity was monitored in IP1 accumulation assays in HEK293 cells expressing WT or G3.49E mutant receptors treated with (a) AP8 or (b) MK-8666. Data is plotted as the % of WT receptor basal activity (cells treated with 1% DMSO), where data points are mean ± S.E.M. from N=3 experiments. Dose response curves were fit to a standard 4 parameter non-linear regression model. Images at right show simulation frames in color and starting structure as a black outline; AP8 is displaced from its WT binding pose by G3.49E, likely due to repulsion of the two nearby carboxylates. (c) In simulations, AP8 destabilizes the PR ICL2 state at the G3.49E receptor, the opposite of its behavior at the WT receptor. Data presented as mean of 5–10 independent simulations for each condition, each 1 µs in length (error bars are 68% CI). (d) Basal receptor activity in the IP1 accumulation assay, normalized by receptor surface expression, is plotted at right for different mutants at the 3.49 position. Only G3.49E leads to an increase in activity relative to WT. At left, a snapshot of the simulation of the G3.49E receptor in complex with Gq shows the glutamate sidechain can mimic the interactions of the AP8 carboxylate.
Fig. 5
Fig. 5. Druggable allosteric pockets exist at the same membrane-facing site in diverse GPCRs.
(a) Selected frames from simulations of a range of different GPCRs show comparable allosteric pockets to the AP8 binding pocket. All receptors are shown from the same view angle with the putative pockets highlighted by dashed lines. Below, selected simulation frames show changes in the ICL2 helix angle and orientation upon formation of receptor-G protein complex, suggesting functional relevance. Purple structures were selected from simulations of receptor-G protein complexes, red structures were selected from simulation of receptor only. (b) Using Schrodinger’s SiteMap software, we scored the druggability of ICL2 allosteric sites from 29 class A GPCRs. Representative static structures from the Protein Data Bank were used. Druggable classification is determined from previously reported literature benchmarks. (c) Curated structures from the PDB, with non-protein molecules bound to the ICL2 site. Receptors are shown in purple with ligands and other molecules in orange sticks.

References

    1. Dror R. O. et al. Activation mechanism of the B2-adrenergic receptor. Proc. Natl. Acad. Sci. 108, 18684–18689 (2011). - PMC - PubMed
    1. Chan H. C. S., Li Y., Dahoun T., Vogel H. & Yuan S. New Binding Sites, New Opportunities for GPCR Drug Discovery. Trends Biochem. Sci. 44, 312–330 (2019). - PubMed
    1. Koehl A. et al. Structure of the µ-opioid receptor–Gi protein complex. Nature 558, 547–552 (2018). - PMC - PubMed
    1. Maeda S., Qu Q., Robertson M. J., Skiniotis G. & Kobilka B. K. Structures of the M1 and M2 muscarinic acetylcholine receptor/G-protein complexes. Science 364, 552–557 (2019). - PMC - PubMed
    1. Krishna Kumar K. et al. Structure of a Signaling Cannabinoid Receptor 1-G Protein Complex. Cell 176, 448–458.e12 (2019). - PMC - PubMed

Publication types