[Preprint]. 2023 Aug 14:rs.3.rs-3221704.
doi: 10.21203/rs.3.rs-3221704/v1.

Autistic traits in myotonic dystrophy type 1 due to MBNL inhibition and RNA mis-splicing

Affiliations

Autistic traits in myotonic dystrophy type 1 due to MBNL inhibition and RNA mis-splicing

Lukasz Sznajder et al. Res Sq. .

Update in

Abstract

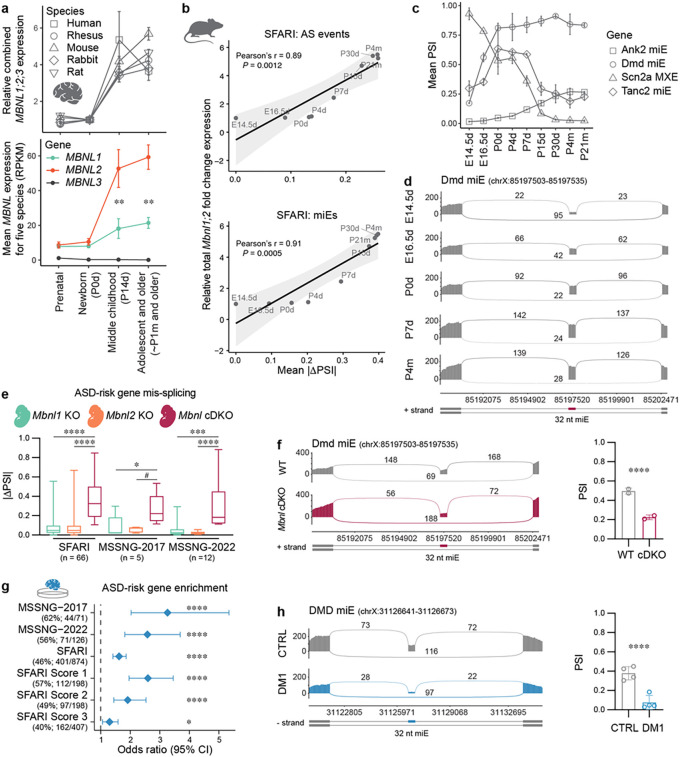
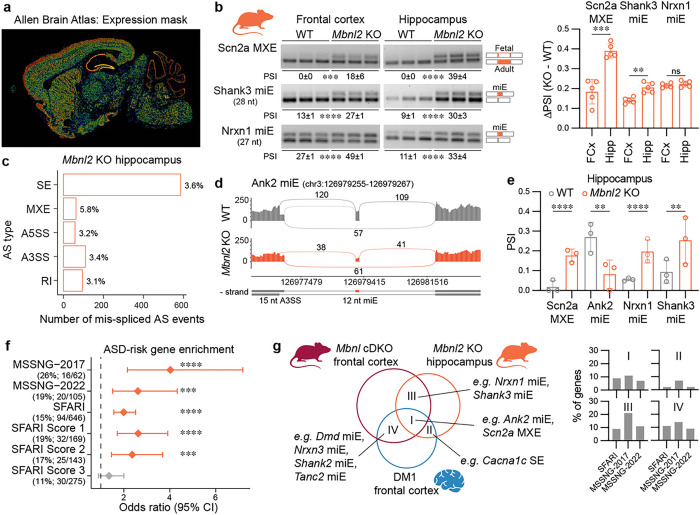
Tandem repeat expansions are enriched in autism spectrum disorder, including CTG expansion in the DMPK gene that underlines myotonic muscular dystrophy type 1. Although the clinical connection of autism to myotonic dystrophy is corroborated, the molecular links remained unknown. Here, we show a mechanistic path of autism via repeat expansion in myotonic dystrophy. We found that inhibition of muscleblind-like (MBNL) splicing factors by expanded CUG RNAs alerts the splicing of autism-risk genes during brain development especially a class of autism-relevant microexons. To provide in vivo evidence that the CTG expansion and MBNL inhibition axis leads to the presentation of autistic traits, we demonstrate that CTG expansion and MBNL-null mouse models recapitulate autism-relevant mis-splicing profiles and demonstrate social deficits. Our findings indicate that DMPK CTG expansion-associated autism arises from developmental mis-splicing. Understanding this pathomechanistic connection provides an opportunity for greater in-depth investigations of mechanistic threads in autism.

Keywords: ANK2; ASD; DMPK; MBNL; SRRM4; alternative splicing; autism spectrum disorder; microexon; myotonic dystrophy; short tandem repeat expansion.


Conflict of interest statement

Declaration of interests M.S.S. is a Scientific Advisory Board member for Skyhawk Therapeutics and Tacit Therapeutics. Other authors declare no competing interests.

Figures

Figure 1
Figure 1. ASD-risk gene mis-splicing in DM1 prefrontal cortex.
a, Differential AS analysis in DM1 (N = 21: NXX = 12, NXY = 9; sampling age: median = 56 years (y), min = 39y, max = 77y; unknown ASD status) compared to age-matched control (CTRL; N = 8: NXX = 4, NXY = 4; sampling age: median = 63y, min = 48y, max = 71y) prefrontal cortex (Brodmann area 10; BA10) RNA-seq samples. AS mis-splicing criteria: |DPSI | > 0.1, FDR < 0.05. The bar graph shows the number and percentage of significantly mis-spliced AS event types. b, MSSNG-2017, MSSNG-2022 and SFARI gene-set enrichment analysis for mis-spliced genes in DM1 BA10. Points represent the odds ratio (OR), and error bars represent the 95% confidence interval (CI). The vertical dashed line represents OR = 1. c, Sashimi plot of DM1 (N = 8) and CTRL (N = 8) BA10 RNA-seq samples for SCN2A MXE, ANK2 miE, and DMD miE. d, SCN2A MXE, ANK2 miE, SHANK2 miE, and DMD miE (only MSSNG-2017) mis-splicing in DM1 BA10. The bar graph shows mean percent spliced-in (PSI) ± standard deviation (SD). e, Correlation between previously estimated 90th percentile of CTG repeat lengths (N = 7) and mean |DPSI| values for mis-spliced SFARI genes in DM1 BA10. b,d, * FDR < 0.05, ** FDR < 0.01, *** FDR < 0.001, **** FDR < 0.0001.
Figure 2
Figure 2. Microexon mis-splicing in DM1 and Mbnl cDKO frontal cortexes.
a, Differential AS analysis in Mbnl cDKO (NXY = 3) compared to littermate WT control (NXY = 3) frontal cortex RNA-seq samples. The bar graph shows the number and percentage of significantly mis-spliced AS event types (|DPSI | > 0.1, FDR < 0.05). b, MSSNG-2017, MSSNG-2022 and SFARI gene-set enrichment analysis for mis-spliced genes in Mbnl cDKO frontal cortex. Points represent the OR and error bars represent the 95% CI. The vertical dashed line represents OR = 1. c, Overlap between mis-spliced SFARI, MSSNG-2017 and MSSNG-2022 genes in DM1 and Mbnl cDKO cortexes. d, Scn2a MXE mis-splicing. Sashimi plot of Mbnl cDKO and WT RNA-seq samples. The bar graph shows the mean PSI ± SD. e, miE enrichment analysis for SFARI, MSSNG-2017 and MSSNG-2022 mis-spliced SE events. f, Sashimi plot of Mbnl cDKO and WT RNA-seq samples for Ank2 miE 12 nt. g, Human and mouse miE mis-splicing in DM1 and Mbnl cDKO. The bar graph shows mean DPSI ± SD. h, Schematic of Ank2 miE to the A3SS coordinate splicing and modeled structures of mouse Ank2 polypeptides. The aa sequences changed by AS are by a magenta box. The S901 phosphorylation site is bolded. b,d,e,g, # FDR = 0.056, * FDR < 0.05, ** FDR < 0.01, *** FDR < 0.001, **** FDR < 0.0001.
Figure 3
Figure 3. MBNL proteins governs developmental splicing transitions in ASD-risk genes.
a, MBNL1, MBNL2 and MBNL3 gene expression levels in developing brains of five species. Top: total MBNL expression relative to newborn/postnatal day 0 (P0d) time point. Bottom: mean MBNL expression for five species at each developmental stage. Points show mean expression ± SD. Significant differences between MBNL1 and MBNL2 expression at different developmental stages were determined by a two-tailed t-test; ** P < 0.01. b, Correlation between Mbnl gene expression and mean |DPSI | values for MBNL-sensitive splicing changes in SFARI genes in developing WT mouse cortex. MBNL-sensitive AS events (top) and miEs only (bottom) were selected based on differential AS analysis in the Mbnl cDKO cortex. The Pearson correlation coefficient (r) and P values are shown. c, The line chart shows individual mean PSI values ± SD in the developing cortex for four MBNL-sensitive AS events in MSSNG-2017 and MSSNG-2022 genes at embryonic day 14.5 (E14.5d), E16.5, postnatal day 0 (P0d), P4d, P7d, P15d, P30d, postnatal month 4 (P4m), and P21m. d, Sashimi plots show Dmd miE splicing transitions during mouse cortical development (N = 2 for each time point). e, ASD-risk gene mis-splicing in Mbnl1 KO (N = 2), Mbnl2 KO (N = 2) and Mbnl cDKO (N = 2) mouse E18.5 cortical neuron RNA-seq samples. The box plot shows the lower (25th %ile), middle (median, 50th %ile) and upper (75th %ile) quartiles. Whiskers show minimum and maximum. Number of mis-spliced AS events are provided as n value. Statistical differences were determined by Kruskal-Wallis test followed by Dunn’s multiple comparison test: # P = 0.067, * P = 0.038, *** P = 0.0006, and **** P < 0.0001. f, Sashimi plot of embryonic Mbnl cDKO (N = 2) and WT (N = 2) RNA-seq samples for Dmd miE. The bar graph shows the mean PSI ± SD; **** FDR < 0.0001. g, MSSNG-2017, MSSNG-2022 and SFARI gene-set enrichment analysis for mis-spliced genes in 8-month-old DM1 brain organoid (N = 2 in 2 replicas). Points represent the OR and error bars represent the 95% CI. The vertical dashed line represents OR = 1; * FDR = 0.013 and **** FDR < 0.0001. h, Sashimi plot of DM1 (N = 2 in 2 replicas) and WT (N = 2 in 2 replicas) 8-month-old brain organoid RNA-seq samples for DMD miE. The bar graph shows the mean PSI ± SD; **** FDR < 0.0001.
Figure 4
Figure 4. Mis-splicing in the Mbnl2 knockout hippocampus.
a, The Allen Mouse Brain Atlas (mouse.brain-map.org) shows the normalized color-coded Mbnl2 expression level (from blue-low to red-high) derived from the informatics data processing of in situ hybridization (ISH) results (mouse.brain-map.org/gene/show/69724). b, Representative RT-PCR splicing assay gels of Scn2a MXE, Nrxn1 miE and Shank3 miE in Mbnl2 KO (N = 5) and littermate WT (N = 5) frontal cortex (FCx) and hippocampus (Hipp). Mean (D)PSI ± SD are shown below the gels or on a bar graph. Significant differences were determined by unpaired two-tailed t-test: ** P < 0.01, *** P < 0.001, **** P < 0.0001. c, Differential AS analysis in Mbnl2 KO (NXX = 3) compared to littermate WT control (NXX = 3) hippocampus RNA-seq samples. The bar graph shows the number and percentage of significantly mis-spliced AS event types (|DPSI | > 0.1, FDR < 0.05). d, Ank2 miE sashimi plot of Mbnl2 KO and WT hippocampus RNA-seq samples. e, Scn2a MXE, Ank2 miE, Nrxn1 miE, and Shank 3 miE mis-splicing in Mbnl2 KO hippocampus RNA-seq. Bar graph shows the mean PSI ± SD; ** FDR < 0.01, **** FDR < 0.0001. f, MSSNG-2017, MSSNG-2022 and SFARI gene-set enrichment analysis for mis-spliced genes in Mbnl2 KO hippocampus. Points represent the OR and error bars represent the 95% CI. The vertical dashed line represents OR = 1; *** FDR < 0.001, **** FDR < 0.0001 g, Venn diagram showing the overlap between mis-spliced ASD-risk genes in DM1 prefrontal cortex, Mbnl cDKO frontal cortex, and Mbnl2 hippocampus RNA-seq samples. Bar graphs show the percentage of overlap for mis-spliced SFARI, MSSNG-2017 and MSSNG-2022 genes.
Figure 5
Figure 5. MBNL proteins directly regulate ASD-risk gene splicing.
a, Differential AS analysis in Mbnl DKD (N = 3) compared to control (N = 3) CAD RNA-seq samples. The bar graph shows the number and percentage of significantly mis-spliced AS event types (|DPSI | > 0.1, FDR < 0.05). b, MSSNG-2017, MSSNG-2022 and SFARI gene-set enrichment analysis for mis-spliced genes in Mbnl DKD CAD cells. c, MiE enrichment analysis for SFARI, MSSNG-2017 and MSSNG-2022 mis-spliced SE events. c,d, Points represent the OR and error bars represent the 95% CI. The vertical dashed line represents OR = 1. d, Ank2 miE sashimi plot of Mbnl DKD (N = 3) and control (N = 3) CAD RNA-seq samples. Bar graph shows mean PSI ± SD. e, MBNL-binding motif enrichment near mis-spliced SE in ASD-risk genes. f, Mbnl2-CLIP-seq (NXX = 3) reads cluster cover three UGCU motifs in intron downstream Ank2 miE. Mbnl binding sequences identified in mouse Ank2 and human ANK2 introns and their mutant variants used in heterologous Atp2a1 splicing minigene experiments. g, Schematic of Atp2a1 splicing minigene variants and regulation by MBNL proteins. Atp2a1-WT Atp2a1-Ank2 (mouse), and Atp2a1-ANK2 (human) contain functional MBNL-binding sequences and result in alternative E22 inclusion. In contrast, E22 exclusion occurs in Atp2a1-D, Atp2a1-mutAnk2, and Atp2a1-mutANK2 with deleted WT and inserted mutated mouse Ank2 and human ANK2 MBNL-binding sequences, respectively. h, Atp2a1-derived splicing minigenes regulation by endogenous MBNL, exogenous MBNL1 and MBNL2 proteins in HeLa cells (N = 4). Bar graphs show the mean Atp2a1 E22 PSI ± SD. Dashed line shows Atp2a1-D E22 inclusion as baseline for other splicing minigenes. Significant differences were determined by unpaired t-test: **** P < 0.0001. b-e, Points represent the OR and error bars represent the 95% CI. The vertical dashed line represents OR = 1; ns FDR = 0.11, # FDR = 0.052, * FDR < 0.05, ** FDR < 0.01. *** FDR < 0.001, **** FDR < 0.0001.
Figure 6
Figure 6. ANK2 microexon mis-splicing in ASD.
a, Differential AS analysis in ASD (N = 10: NXX = 1, NXY = 9; sampling age: median = 51y, min = 38y, max = 67y; ASD confirmed by the Autism Diagnostic Interview-Revised (ADI-R; N = 8) or supported by records) compared to age-matched CTRL (N = 10: NXX = 2, NXY = 8; sampling age: median = 50y, min = 41y, max = 60y) frontal cortex (BA9) RNA-seq samples. AS mis-splicing criteria: |DPSI | > 0.1, FDR < 0.06. The bar graph shows the number and percentage of significantly mis-spliced AS event types. b, ANK2 miE mis-splicing in ASD. Sashimi plot of ASD (N = 8) and CTRL (N = 8) BA9 RNA-seq samples. The bar graph shows the mean PSI ± SD; # FDR = 0.056. c, Differential AS analysis in Srrm DKD (N = 2) compared to control (N = 2) N2a RNA-seq samples. Bar graph shows the number and percentage of significantly mis-spliced AS event types (|DPSI | > 0.1, FDR < 0.05). d, Top pie chart represents the percentage of mis-spliced miE that overlap between Srrm DKD N2a and Mbnl DKD CAD cells with concordant and opposite DPSI values. Bottom pie chart demonstrates all concordant miEs are excluded. e, Ank2 miE sashimi plot of Srrm DKD (N = 2) and control (N = 2) N2a RNA-seq samples. The bar graph shows mean PSI ± SD; **** FDR < 0.0001. f, SRRM4-CLIP-seq reads cover in Ank2 miE upstream intron containing UGC motif. g, SRRM4 and MBNL proteins promote ANK2 miE inclusion by binding to differently localized similar intronic sequence motifs.
Figure 7
Figure 7. ASD-associated social deficit in two DM1 mouse models.
a, Scheme of the three-chamber sociability and social novelty test. Each experiment consisted of the following 10 min consecutive phases: habituation, sociability, and social novelty. b,c, The ratio of time in the chamber with novel animal (Stranger 1) and object during the sociability test. Note that time spent in the middle chamber is not included. b, WT mice (N = 11: NXX = 7, NXY = 4), heterozygous Dmpk-(CTG)480/WT (N = 11: NXX = 7, NXY = 4), and homozygous Dmpk-(CTG)480/480 (N = 11: NXX = 7, NXY = 4). The box plot shows the lower (25th %ile), middle (median, 50th %ile) and upper (75th %ile) quartiles. Whiskers show minimum and maximum. Paired dots represent all sample data points, including outliers. Statistical differences were determined by the paired t-test: ns P = 0.38 (t = 0.9134, df = 10), * P = 0.013 (t = 2.997, df = 10), ** P = 0.0025 (t = 4.012, df = 10). c, WT mice (N = 12: NXX = 9, NXY = 3), Mbnl2 KO (N = 12: NXX = 9, NXY = 3). The box plot shows the lower (25th %ile), middle (median, 50th %ile) and upper (75th %ile) quartiles. Whiskers show minimum and maximum. Paired dots represent all sample data points, including outliers. Statistical differences were determined by the paired t-test: ns P = 0.43 (t = 0.8193, df = 11), * P = 0.023 (t = 2.641, df = 11). d, Assessment of mouse movement activity.

References

    1. Lord C., et al. Autism spectrum disorder. Nat Rev Dis Primers 6, 5 (2020). - PMC - PubMed
    1. Soke G.N., Maenner M.J., Christensen D., Kurzius-Spencer M. & Schieve L.A. Prevalence of Co-occurring Medical and Behavioral Conditions/Symptoms Among 4- and 8-Year-Old Children with Autism Spectrum Disorder in Selected Areas of the United States in 2010. J Autism Dev Disord 48, 2663–2676 (2018). - PMC - PubMed
    1. Maenner M.J., et al. Prevalence and Characteristics of Autism Spectrum Disorder Among Children Aged 8 Years - Autism and Developmental Disabilities Monitoring Network, 11 Sites, United States, 2020. MMWR Surveill Summ 72, 1–14 (2023). - PMC - PubMed
    1. Myers S.M., et al. Insufficient Evidence for “Autism-Specific” Genes. Am J Hum Genet 106, 587–595 (2020). - PMC - PubMed
    1. Trost B., et al. Genome-wide detection of tandem DNA repeats that are expanded in autism. Nature 586, 80–86 (2020). - PMC - PubMed

Publication types

LinkOut - more resources