[Preprint]. 2023 Aug 16:rs.3.rs-3164966.
doi: 10.21203/rs.3.rs-3164966/v1.

The microenvironment dictates glycocalyx construction and immune surveillance

Affiliations

The microenvironment dictates glycocalyx construction and immune surveillance

Kevin M Tharp et al. Res Sq. .

Abstract

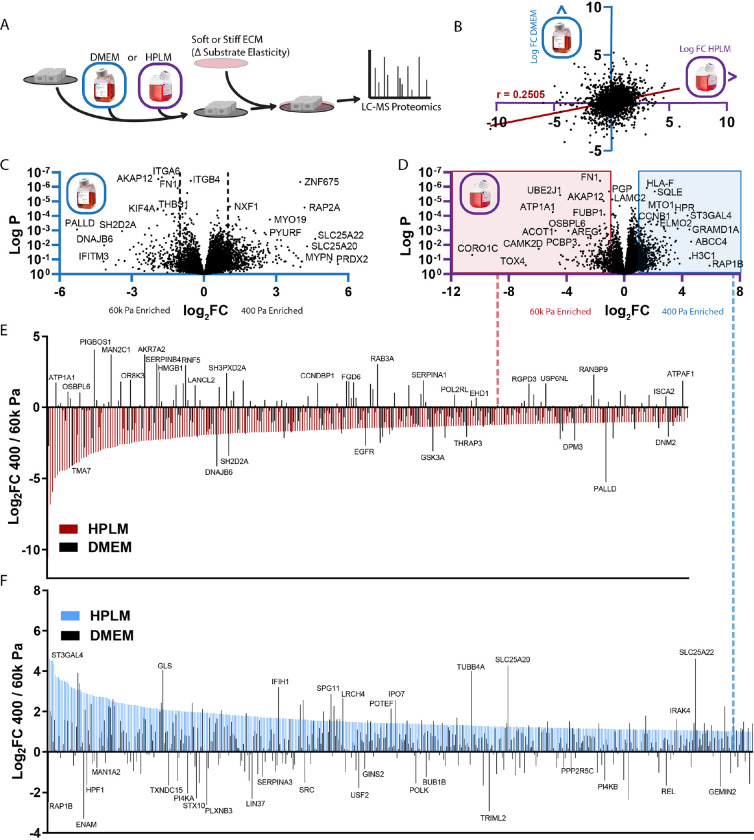
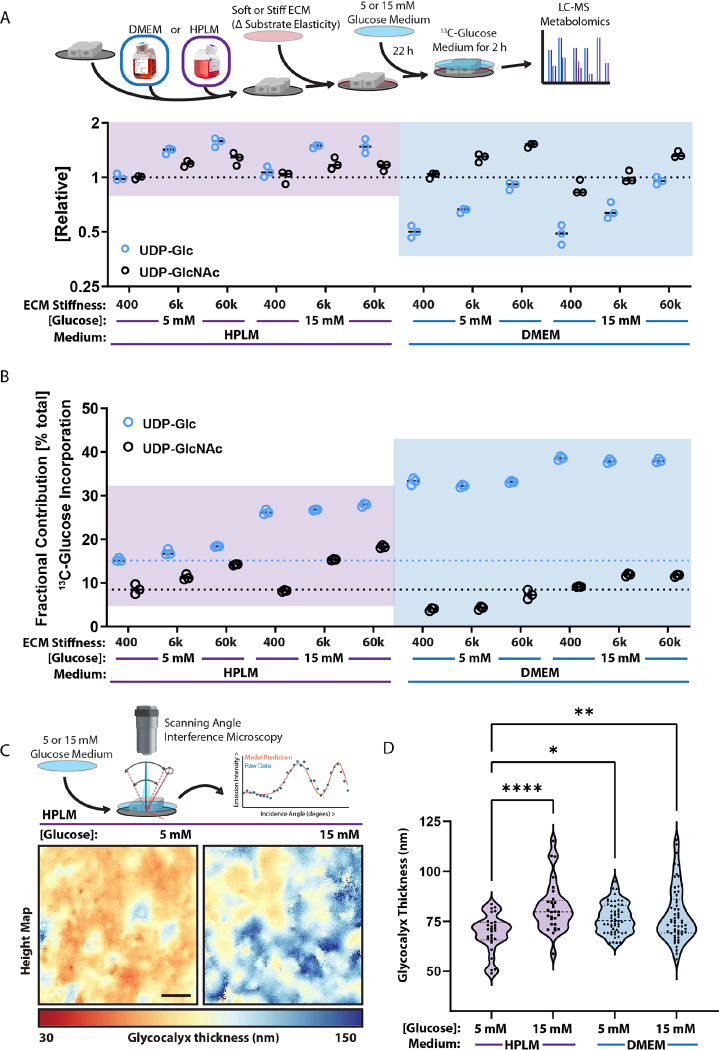
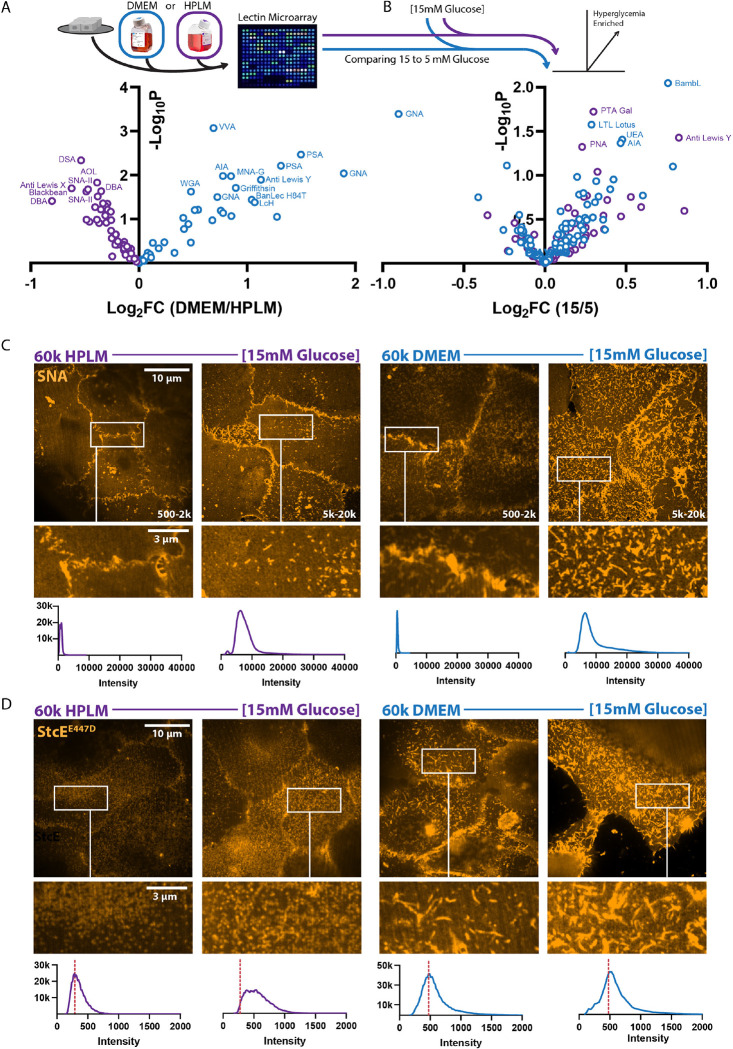
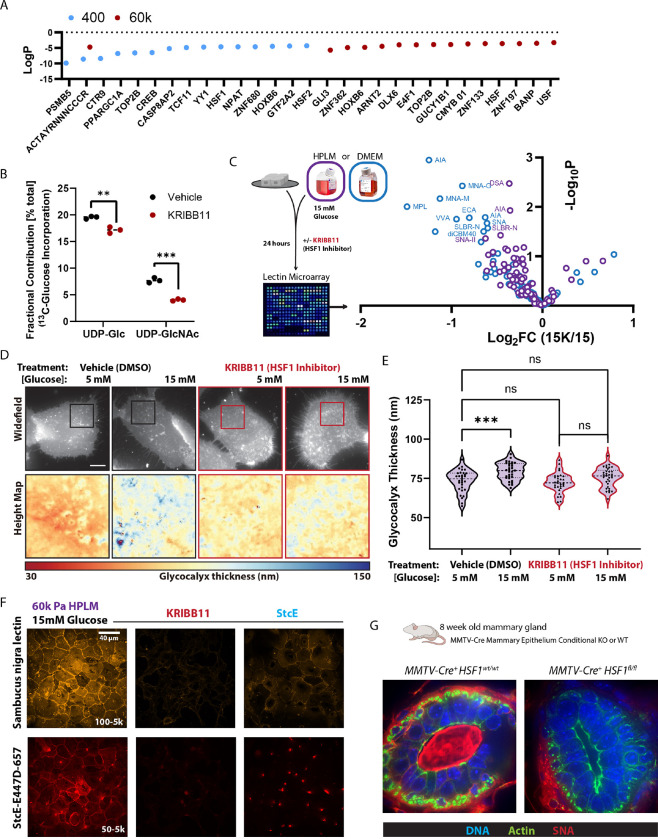
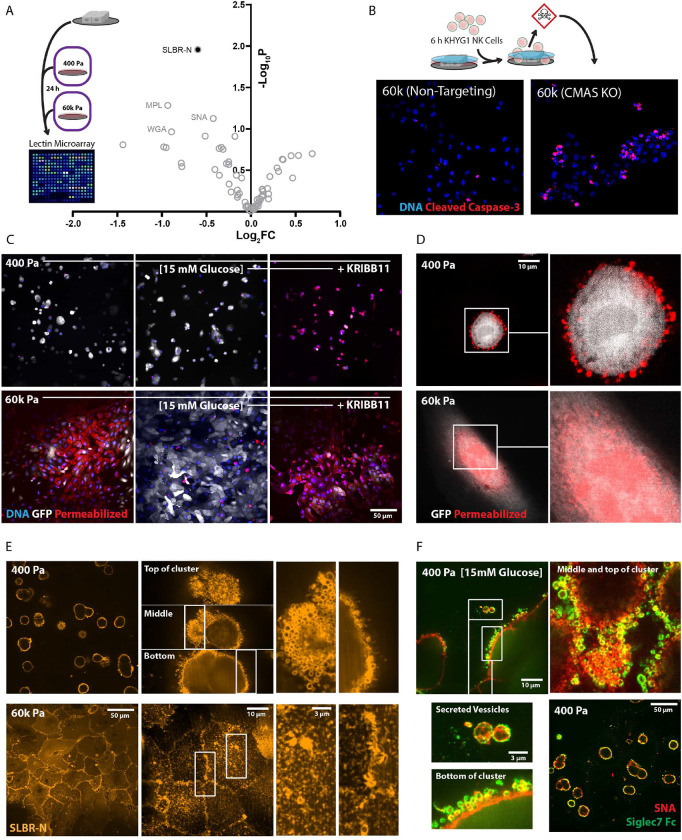
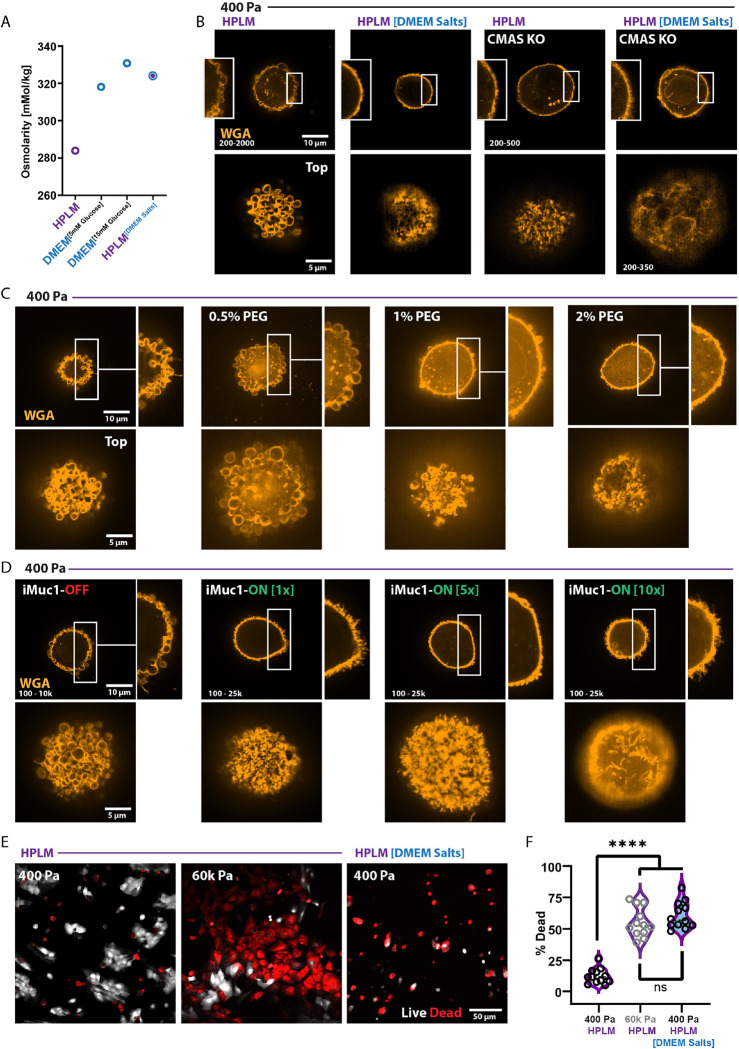
Efforts to identify anti-cancer therapeutics and understand tumor-immune interactions are built with in vitro models that do not match the microenvironmental characteristics of human tissues. Using in vitro models which mimic the physical properties of healthy or cancerous tissues and a physiologically relevant culture medium, we demonstrate that the chemical and physical properties of the microenvironment regulate the composition and topology of the glycocalyx. Remarkably, we find that cancer and age-related changes in the physical properties of the microenvironment are sufficient to adjust immune surveillance via the topology of the glycocalyx, a previously unknown phenomenon observable only with a physiologically relevant culture medium.

Keywords: ECM; Mechanopharmacology; bleb; glycoform; glycome; glycosylation; immune surveillance; lectin array; lectin microarray; mechano-metabolic; metabolism; microenvironment; sialic acid.


Conflict of interest statement

Competing Interests J.R.C. is an inventor on an issued patent for Human Plasma-Like Medium (HPLM) assigned to the Whitehead Institute (Application number: PCT/US2017/061377. Patent number: 11453858. Issue date: 09/27/2022)

Figures

Figure 1:
Figure 1:
Culture medium dictates proteomic mechanoresponse A. Graphical representation of experimental design related to Figure 1B–F. (n = 3 biological replicates) B. Comparison of protein abundance between MCF10A cells cultured on 400 Pa (soft) vs 60k (stiff), either in HPLM (X-axis) or DMEM (Y-axis). Each point represents a single peptide’s fold change (400/60k) in a given medium, Pearson’s r-value = 0.2505, P value <0.0001 (two-tailed). C. Volcano plot depicting relative abundance of proteins in MCF10A cells cultured on 400 Pa vs 60k in DMEM (fold change, 400/60k). D. Volcano plot depicting relative abundance of proteins in MCF10A cells cultured on 400 Pa vs 60k in HPLM (fold change, 400/60k). E. Abundance rank order plot of proteins two fold enriched in MCF10A cells cultured on 60k Pa vs 400 Pa in HPLM (red, related to red box in D), with the same comparison in DMEM (black) superimposed (related to B). F. Abundance rank order plot of proteins two fold enriched in MCF10A cells cultured on 400 Pa 60k Pa in HPLM (blue, related to red box in D), with the same comparison in DMEM (black) superimposed (related to B).
Figure 2:
Figure 2:
Culture medium dictates metabolomic mechanoresponse A. Graphical representation of experimental design related to Figure 2B. (n = 3 biological replicates) B. Heatmap depicting the relative abundance (z-score) of metabolites between cells cultured on 400 Pa, 6k Pa, or 60k Pa in HPLM or DMEM with 5 or 15 mM glucose. (n = 3 biological replicates, Z-score color scale depicted in A)
Figure 3:
Figure 3:
Microenvironmental properties dictate glycosylation and glycocalyx dynamics A. Graphical representation of experimental design related to Figure 3A–B and plot of relative abundance of UDP-Glc and UDP-GlcNAc between MCF10A cells cultured on 400 Pa, 6k Pa, or 60k Pa in HPLM or DMEM with 5 or 15 mM glucose. (n = 3 biological replicates) B. Plot depicting the percent of the total UDP-Glc and UDP-GlcNAc pool containing 13C derived from exogenous 13C6-glucose (fractional contribution) in cells cultured on 400 Pa, 6k Pa, or 60k Pa in HPLM or DMEM with 5 or 15 mM glucose. (n = 3 biological replicates) C. Representative scanning angle interference microscopy (SAIM) heightmaps of glycocalyx thickness of MCF10A cells in HPLM with or without 15 mM glucose. D. SAIM-based quantification of glycocalyx thickness of MCF10A cells in HPLM or DMEM with and without 15 mM glucose, results are the mean ± S.D. of at least 13 cells per condition (repeated 3 separate times with similar effects).
Figure 4:
Figure 4:
Microenvironmental properties dictate the abundance, topology, and composition of glycans that can comprise the cellular glycocalyx A. Volcano plot depicting relative abundance of glycans from MCF10A cells cultured in HPLM or DMEM, detected via lectin microarray. (n = 4 biological replicates) B. Volcano plot depicting relative abundance of glycans from MCF10A cells cultured in HPLM with 5 or 15 mM glucose, detected via lectin microarray. (n = 4 biological replicates) C. Representative super resolution via optical reassignment (SoRa) confocal microscopy of SNA staining of unpermeabilized MCF10A cells cultured on 60k Pa in HPLM or DMEM with or without 15 mM glucose. Associated fluorescent intensity histogram and intensity range of each image indicated in figure. D. Representative SoRa confocal microscopy of StcEE447D staining of unpermeabilized MCF10A cells cultured on 60k Pa in HPLM or DMEM with or without 15 mM glucose. Associated fluorescent intensity histogram shown in figure.
Figure 5:
Figure 5:
HSF1 mediates hyperglycemia induced glycocalyx construction A. Transcriptional Regulatory Relationships Unraveled by Sentence-based Text mining (TRRUST) based detection of transcription factors associated with the proteins significantly enriched in response to 15 mM glucose in HPLM on 400 Pa or 60k Pa. (n = 3 biological replicates LC-MS based proteomics) B. Fractional contribution of 13C6-glucose to UDP-Glc and UDP-GlcNAc in cells cultured in HPLM +/− KRIBB11 [2 μM]. (n = 3 biological replicates) C. Volcano plot depicting relative abundance of glycans from MCF10A cells cultured in HPLM with 15 mM glucose +/− KRIBB11 [2 μM], detected via lectin microarray. (n = 4 biological replicates) D. Representative SAIM-based heightmaps of glycocalyx thickness of MCF10A cells in HPLM with 15 mM glucose +/− KRIBB11 [2 μM]. E. SAIM-based quantification of glycocalyx thickness of MCF10A cells in HPLM with 15 mM glucose +/− KRIBB11 [2 μM], results are the mean ± S.D. of at least 13 cells per condition (repeated 3 separate times with similar effects). F. Representative confocal microscopy of SNA and StcEE447D staining of unpermeabilized MCF10A cells cultured in HPLM with 15 mM glucose +/− KRIBB11 [2 μM] or StcE [2 μM]. G. Representative confocal microscopy of SNA (red), phalloidin (green), and DAPI (blue) staining of 8 week old murine mammary gland acini, from MMTV-Cre+ mice and MMTV-Cre+Hsf1fl/fl mice. (n = at least 5 acini were examined from 3 WT and 5 KO mice, all KO acini had no detectable SNA).
Figure 6:
Figure 6:
The physical properties of the microenvironment affect Natural Killer cell immunogenicity via glycocalyx composition and topology A. Volcano plot depicting relative abundance of glycans from MCF10A cells cultured in HPLM on 400 Pa or 60k Pa, detected via lectin microarray. (n = 4 biological replicates) B. Representative confocal microscopy of cleaved caspase 3 (red) and DAPI (blue) staining of non-targeting WT controls and CMAS KO MCF10A cells after 6 h of co-culture with equal numbers of KHYG1 NK cells in HPLM. (repeated twice with similar results) C. Representative confocal microscopy of propidium iodide homodimer (red) and DAPI (blue) staining of cytosolic-GFP (white) expressing MCF10A cells on 400 Pa or 60k Pa after 24 h of co-culture with equal numbers of KHYG1 NK cells in 5 mM glucose HPLM. Treatments indicated (+/−15 mM glucose or 15 mM glucose + KRIBB11 [2 μM]) occurred for the 24 h prior to the addition of equal number of KHYG1 cells to the MCF10A cultures in HPLM with 5 mM glucose and no KRIBB11. (repeated three times with similar results) D. Representative SoRa confocal microscopy of propidium iodide homodimer (red) staining of a cytosolic-GFP (white) expressing MCF10A cell on 400 Pa or 60k Pa after 24 h of co-culture with equal numbers of KHYG1 NK cells in HPLM. E. Representative confocal (left panel) and SoRa confocal microscopy (right panel and enhancements) of SLBR-N staining of MCF10A cells on 400 Pa or 60k Pa in HPLM. F. Representative confocal (left panel) and SoRa confocal microscopy (right panel and enhancements) of SLBR-N staining of MCF10A cells on 400 Pa or 60k Pa in HPLM. G. Representative confocal (bottom right) and SoRa confocal microscopy (top and expansions) of recombinant Siglec7 Fc (green) and SNA staining of MCF10A cells on 400 Pa or 60k Pa in HPLM.
Figure 7:
Figure 7:
Microenvironmental regulation of glycocalyx topology is related to osmotic adjustments and dictates Natural Killer cell immunogenicity A. Osmolality of additive-free culture media. B. Representative SoRa confocal microscopy of WGA staining of unpermeabilized non-targeting WT controls and CMAS KO MCF10A cells on 400 Pa in HPLM or HPLMDMEM Salt. C. Representative SoRa confocal microscopy of WGA staining of unpermeabilized MCF10A cells on 400 Pa in HPLM with increasing concentrations of PEG-400 (v/v %) for 24 h. D. Representative SoRa confocal microscopy of WGA staining of unpermeabilized iMuc1-MCF10A cells on 400 Pa in HPLM (1x = 1 ng/mL, 5x = 5 ng/mL, 10x = 10 ng/mL Dox). E. Representative confocal microscopy of propidium iodide homodimer (red) and calcien-AM (white) staining of MCF10A cells on 400 Pa or 60k Pa after 24 h of co-culture with equal numbers of KHYG1 NK cells in HPLM or HPLMDMEM Salt. (repeated three times with similar results) F. Quantitation of effects shown in E from 10 field views randomly selected across 2 biological replicate experiments.

References

    1. Tharp K. M. & Weaver V. M. Modeling Tissue Polarity in Context. J. Mol. Biol. 430, 3613–3628 (2018). - PMC - PubMed
    1. Pickup M. W., Mouw J. K. & Weaver V. M. The extracellular matrix modulates the hallmarks of cancer. EMBO Rep. 15, 1243–1253 (2014). - PMC - PubMed
    1. Piersma B., Hayward M. K. & Weaver V. M. Fibrosis and cancer: A strained relationship. Biochim. Biophys. Acta - Rev. Cancer 1873, 188356 (2020). - PMC - PubMed
    1. Park J. S. et al. Mechanical regulation of glycolysis via cytoskeleton architecture. Nature 578, 10.1038/s41586-020-1998-1 (2020). - DOI - PMC - PubMed
    1. Papalazarou V. et al. The creatine–phosphagen system is mechanoresponsive in pancreatic adenocarcinoma and fuels invasion and metastasis. Nat. Metab. 2, 62–80 (2020). - PMC - PubMed

Publication types