[Preprint]. 2023 Aug 18:2023.08.17.553722.
doi: 10.1101/2023.08.17.553722.

Massively Parallel Reporter Assay Confirms Regulatory Potential of hQTLs and Reveals Important Variants in Lupus and Other Autoimmune Diseases

Affiliations

Massively Parallel Reporter Assay Confirms Regulatory Potential of hQTLs and Reveals Important Variants in Lupus and Other Autoimmune Diseases

Yao Fu et al. bioRxiv. .

Update in

Abstract

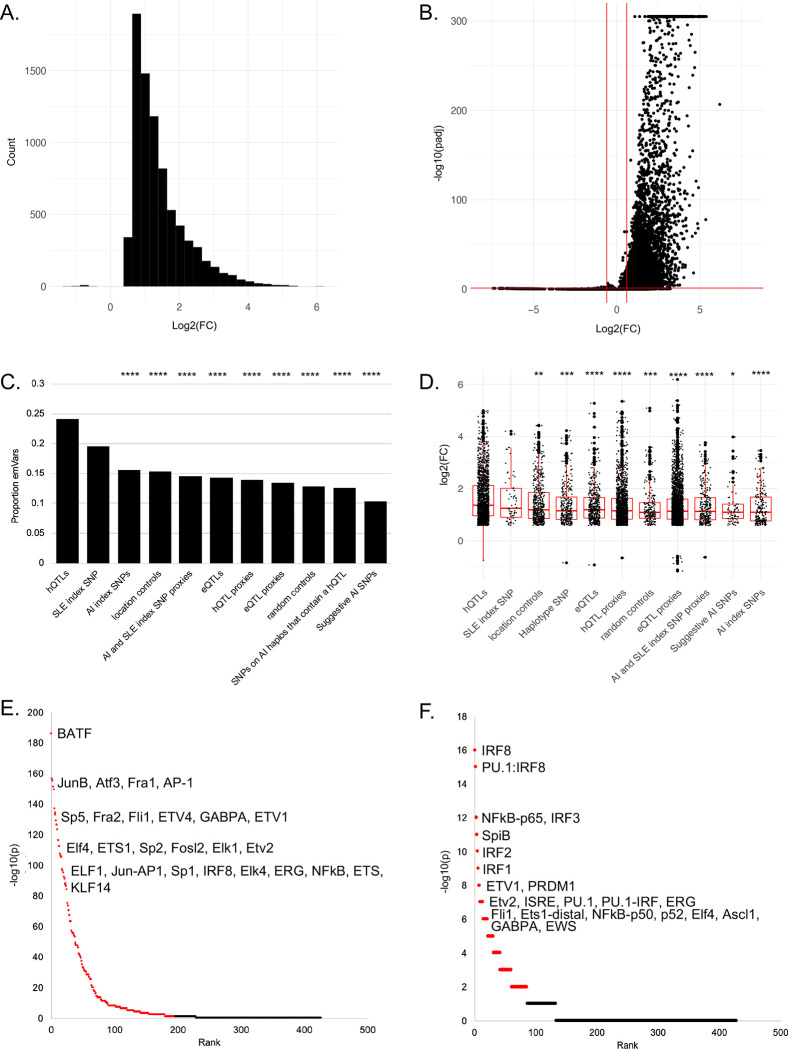
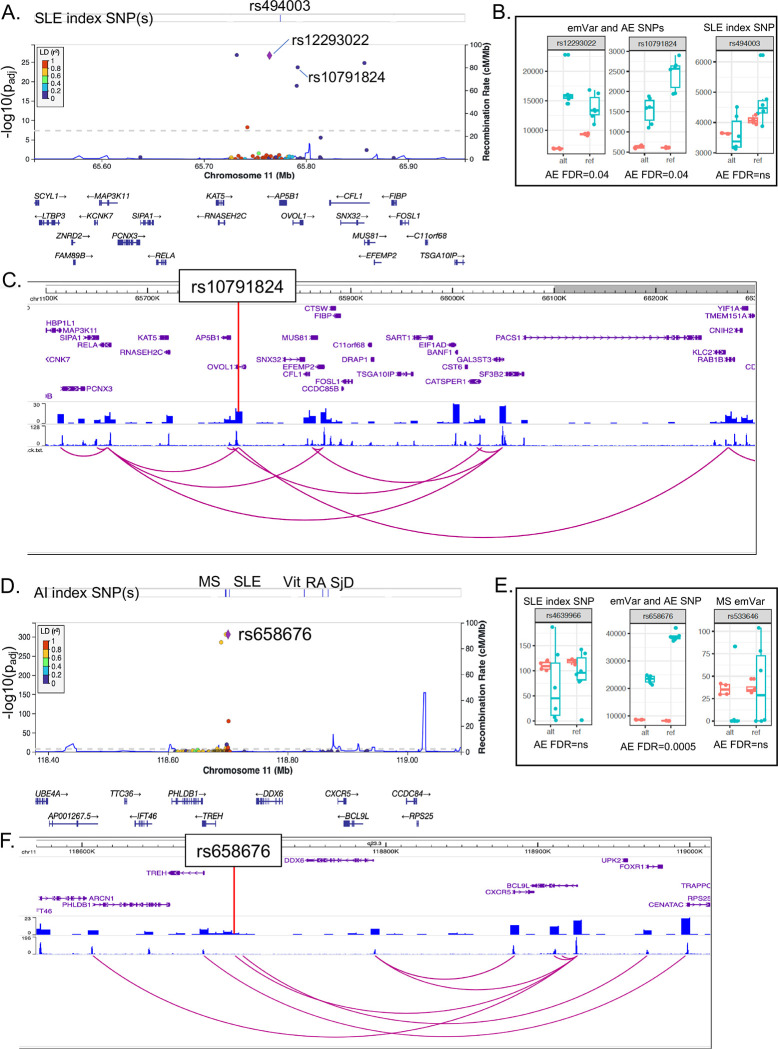
Objective: To systematically characterize the potential for histone post-translational modifications, i.e., histone quantitative trait loci (hQTLs), expression QTLs (eQTLs), and variants on systemic lupus erythematosus (SLE) and autoimmune (AI) disease risk haplotypes to modulate gene expression in an allele dependent manner.

Methods: We designed a massively parallel reporter assay (MPRA) containing ~32K variants and transfected it into an Epstein-Barr virus transformed B cell line generated from an SLE case.

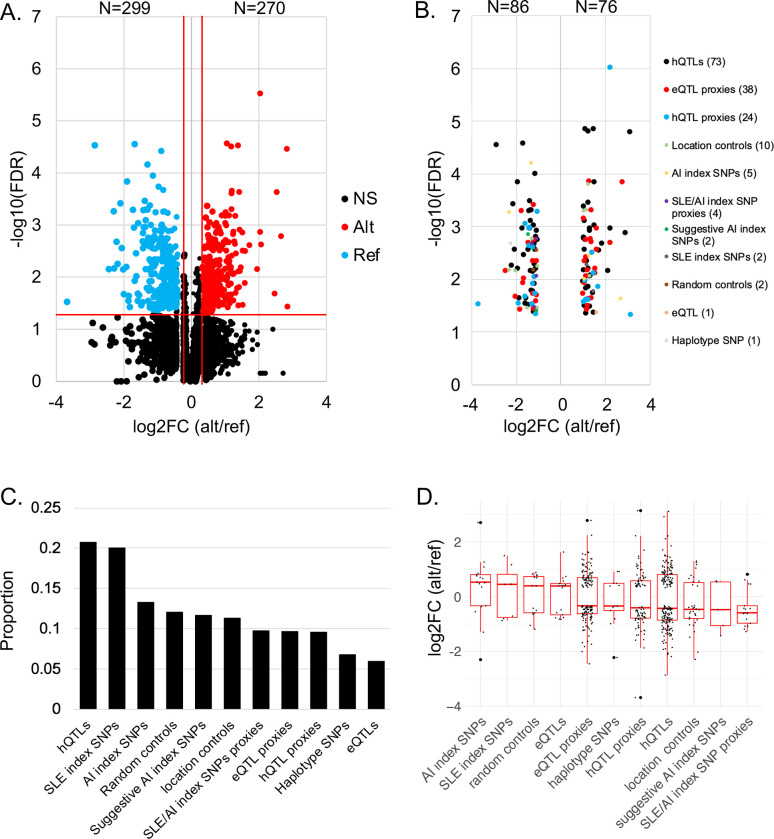
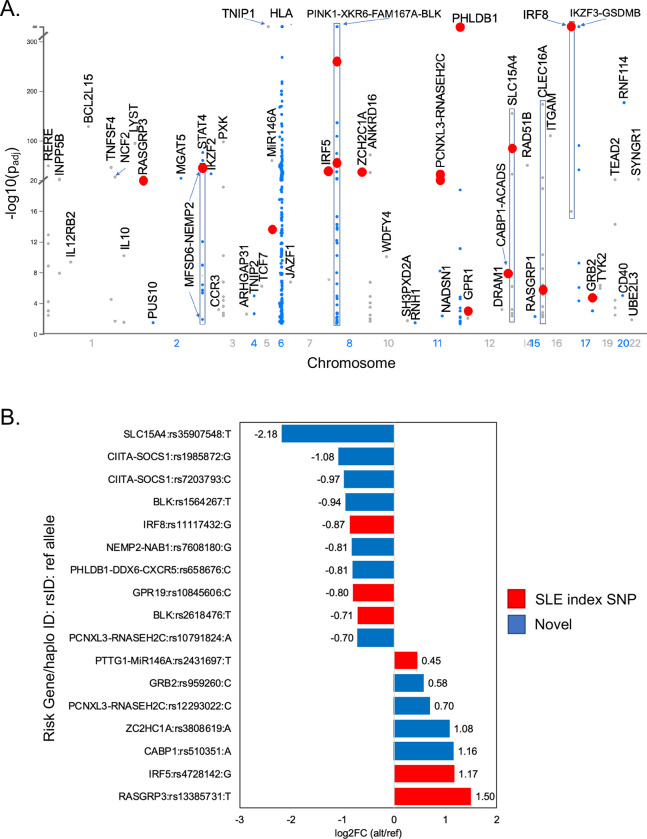
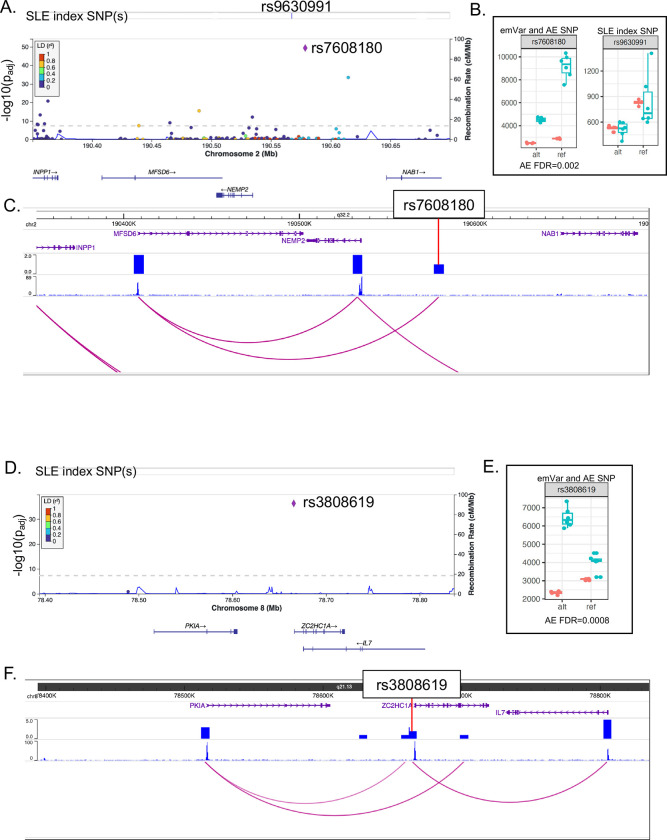
Results: Our study expands our understanding of hQTLs, illustrating that epigenetic QTLs are more likely to contribute to functional mechanisms than eQTLs and other variant types, and a large proportion of hQTLs overlap transcription start sites (TSS) of noncoding RNAs. In addition, we nominate 17 variants (including 11 novel) as putative causal variants for SLE and another 14 for various other AI diseases, prioritizing these variants for future functional studies primary and immortalized B cells.

Conclusion: We uncover important insights into the mechanistic relationships between genotype, epigenetics, gene expression, and SLE and AI disease phenotypes.


Conflict of interest statement

Conflicts of interest: None

Figures

Figure 1.
Figure 1.. Properties of emVars in the MPRA.
A. Histogram distribution of emVar regulatory (log2(FC)) in six EBV B cell technical replicates compared to four plasmid controls. Positive values represent increased regulatory activity and negative values represent decreased activity in EBV B cells relative to plasmid controls. Oligo count is plotted on the y-axis. B. Volcano plot of emVar effect sizes (−log10(padj) from DESeq2) in EBV B cells relative to controls. Horizontal red line represents padj≤0.05; vertical red lines (log2(FC)±0.58) represent a 1.5 FC difference between the EBV B replicates and plasmid controls. C. Proportion of emVars within each variant type. Significant differences between the proportion of emVars within hQTLs and the other variant types are shown: ****chi-square p<0.0001. D. Box plots of emVar effect sizes (log2(FC)) for each variant type. X-axis is sorted in descending order by mean log2(FC) of the variant types. Significant differences in the means of hQTL effect sizes compared to the other variant types are shown: *t-test p<0.05; **<0.01, ***<0.001, ****<0.0001. E & F. Significant TFs enriched in all emVars (E) and hQTL emVars (F). TF rank and HOMER −log10(p) are plotted. FDR≤0.05 effects are highlighted in red. Top TFs are indicated.
Figure 2.
Figure 2.. Strong AE variants are dominated by hQTLs.
A. Volcano plot of AE effect sizes (log2(FC)) relative to the alternate/reference alleles. Horizontal red line represents q≤0.05; vertical red lines (log2(FC)=±0.32) represent a 1.25 FC difference between the alternate/reference alleles. Red dots indicate alternate alleles that demonstrate significantly higher expression than the reference allele; blue dots indicate reference alleles that have significantly higher expression. B. AE variants (n=162) with effect sizes >2.0, colored by variant type, demonstrating the high number of hQTLs (45%, black dots) with strong effects. The log2(FC) of alternate/reference allele is plotted on the x-axis; y-axis is the −log10(FDR). C. Proportions of AEs within each type. D. The log2(FC) of alternate/reference allele effect size plotted by variant type, sorted by descending median log2FC alternate/reference.
Figure 3.
Figure 3.. EmVar and AE variants on SLE risk haplotypes.
A. Manhattan plot of significant emVars (−log10(padj) as determined by DESeq2) plotted on SLE risk haplotypes. Only the allele with the highest regulatory activity is plotted for each variant. SLE risk gene/haplotype is indicated. Red dots represent emVars with allelic effects. B. Effect sizes of variants that demonstrate significant AEs on SLE risk haplotypes. The risk gene/ haplotype and reference allele are provided for each variant. Positive effects indicate the alternate allele significantly increases expression over the reference allele; negative effects indicate the reference allele significantly increases expression over the alternate allele. Candidate causal SLE index SNPs are indicated in red. Novel candidate causal variants on SLE haplotypes are indicated in blue.
Figure 4.
Figure 4.. Novel candidate variant identification on the NEMP2-NAB1 and PKIA-ZC2HC1A SLE risk haplotypes.
A & D. LocusZoom plots demonstrating emVar effects on the haplotypes of (A) NEMP2-NAB1 and (D) PKIA-ZC2HC1A. Evaluated index SNPs are indicated. Variants evaluated, their genomic location, and genes in the region are presented on the x-axis. The novel AE variant is represented as a purple diamond. LD values between each variant and the AE variant are colored based on their r2 value (see LD key). B & E. Box plots of the counts for each allele (alt and ref) in the EBV B (blue) and plasmid control (orange) replicates. FDR q value is indicated. C & F. Screenshot from the WashU Epigenome Browser for each haplotype region. Gene positions are provided on the top, followed by density HiC bed tracks, HiC bigwig tracks, and the interactions between gene promoters and the HiC data. The AE variant position is provided.
Figure 5.
Figure 5.. Novel candidate variant identification on the RNASEH2C-OVOL1 and PHLDB1-DDX6-CXCR5 SLE risk haplotypes.
A & D. LocusZoom plots demonstrating emVar effects on the haplotypes of (A) RNASEH2C-OVOL1 and (D) PHLDB1-DDX6-CXCR5. Evaluated index SNPs are indicated. Variants evaluated, their genomic location, and genes in the region are presented on the x-axis. The novel AE variant is represented as a purple diamond. LD values between each variant and the AE variant are colored based on their r2 value (see LD key). B & E. Box plots of the counts for each allele (alt and ref) in the EBV B (blue) and plasmid control (orange) replicates. FDR q value is indicated. C & F. Screenshot from the WashU Epigenome Browser for each haplotype region. Gene positions are provided on the top, followed by density HiC bed tracks, HiC bigwig tracks, and the interactions between gene promoters and the HiC data. The AE variant position is provided.

Similar articles

References

    1. Zhang F, Lupski JR. Non-coding genetic variants in human disease. Hum Mol Genet 2015;24:R102–10. - PMC - PubMed
    1. Farh KK- H, Marson A, Zhu J, et al. Genetic and epigenetic fine mapping of causal autoimmune disease variants. Nature 2015;518:337–43. - PMC - PubMed
    1. ENCODE Project Consortium, Moore JE, Purcaro MJ, et al. Expanded encyclopaedias of DNA elements in the human and mouse genomes. Nature 2020;583:699–710. - PMC - PubMed
    1. Zhang L, Xue G, Liu J, Li Q, Wang Y. Revealing transcription factor and histone modification co-localization and dynamics across cell lines by integrating ChIP-seq and RNA-seq data. BMC Genomics 2018;19:914. - PMC - PubMed
    1. Pelikan RC, Kelly JA, Fu Y, et al. Enhancer histone-QTLs are enriched on autoimmune risk haplotypes and influence gene expression within chromatin networks. Nat Commun 2018;9:2905. - PMC - PubMed

Publication types