[Preprint]. 2023 Aug 14:2023.08.12.553095.
doi: 10.1101/2023.08.12.553095.

Multi-omic stratification of the missense variant cysteinome

Affiliations

Multi-omic stratification of the missense variant cysteinome

Heta Desai et al. bioRxiv. .

Update in

Abstract

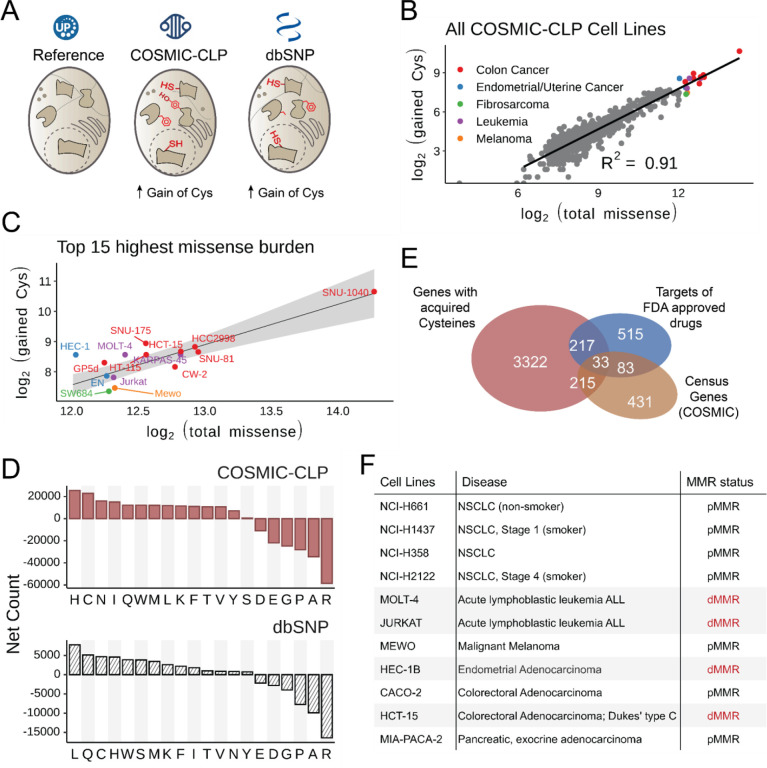
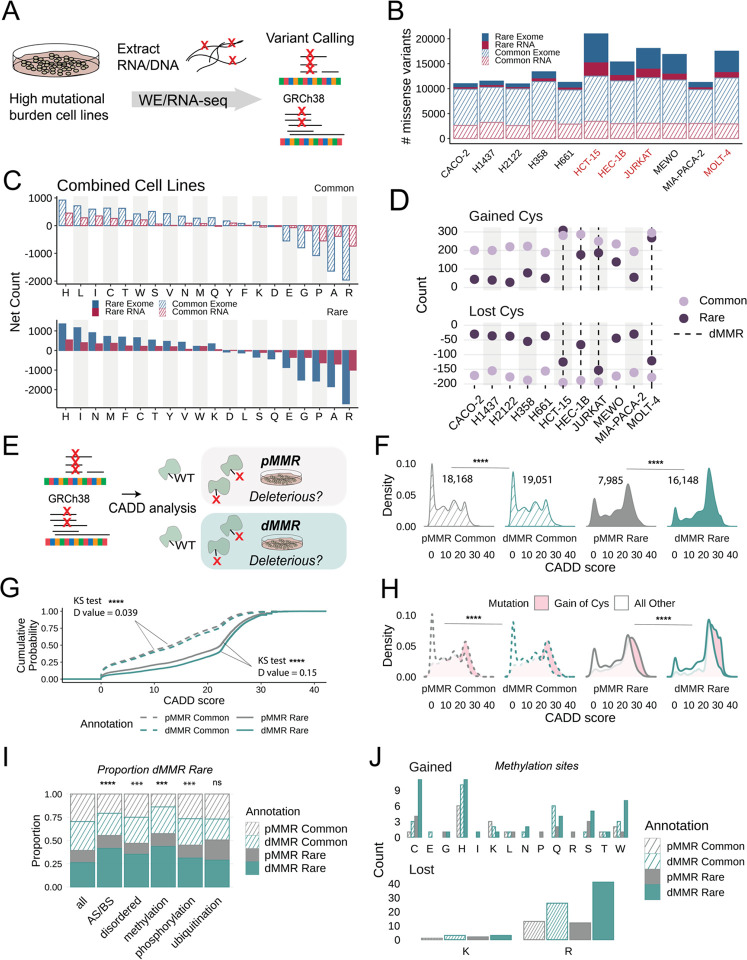
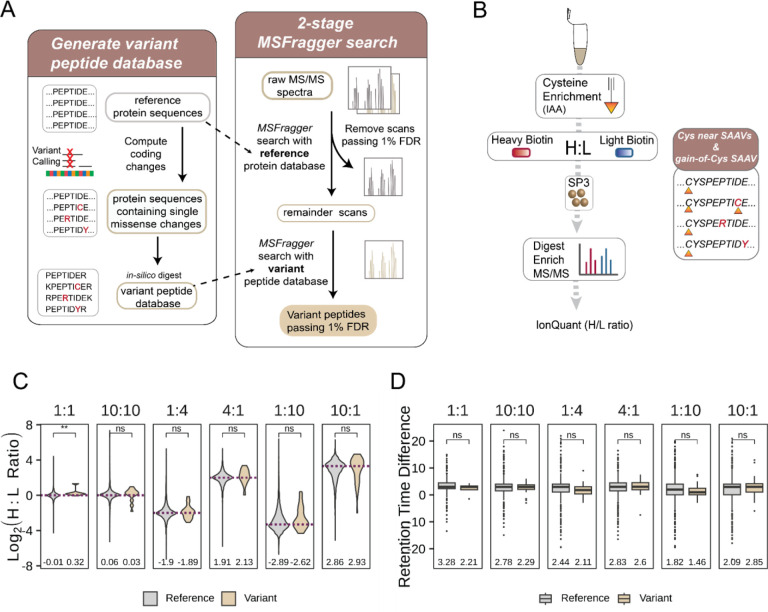
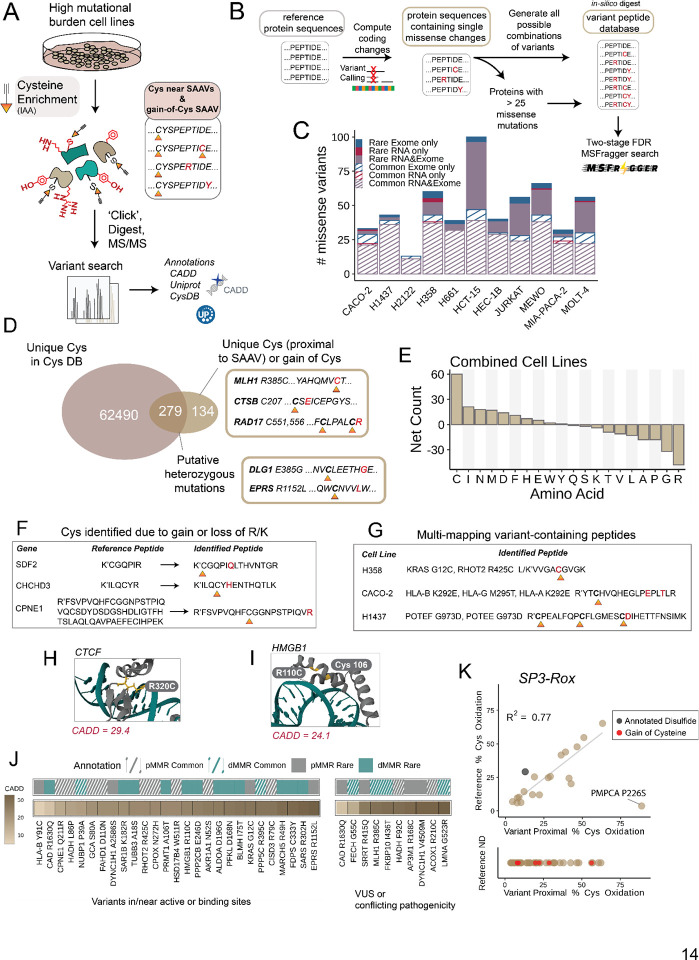
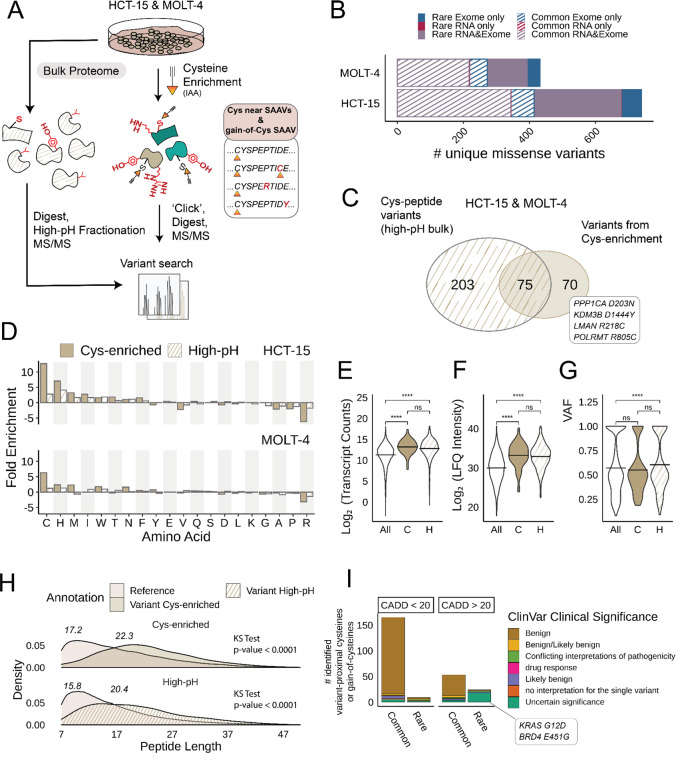
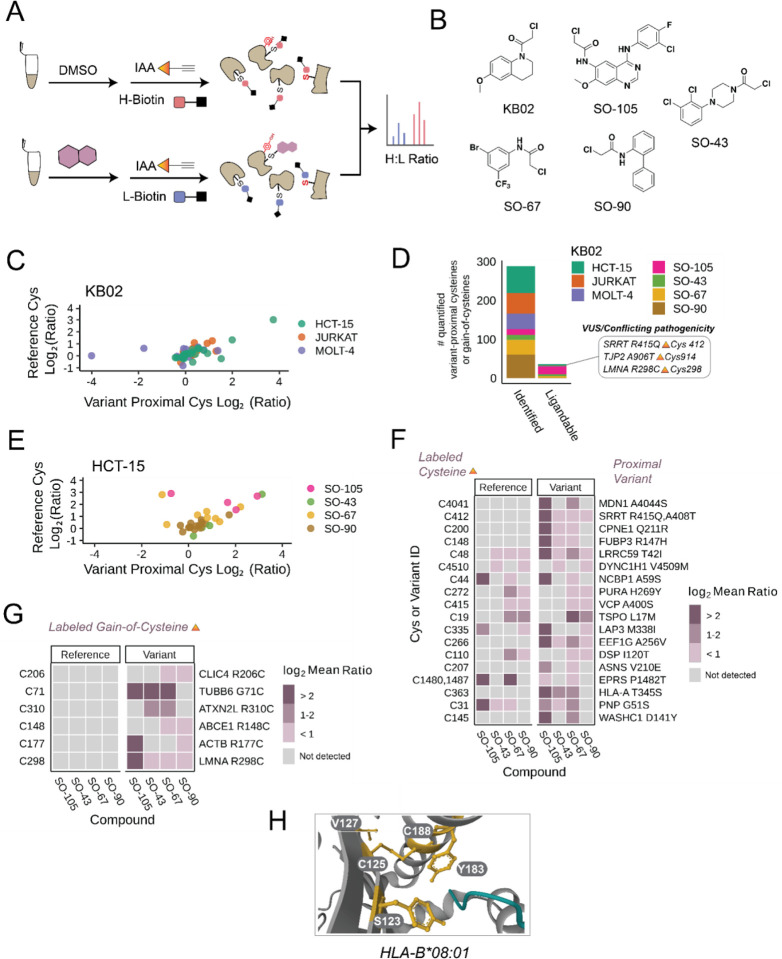
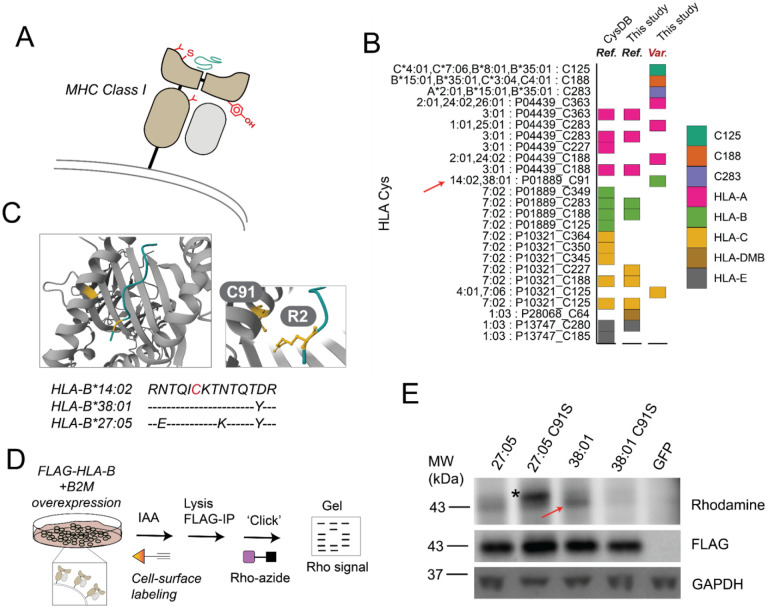
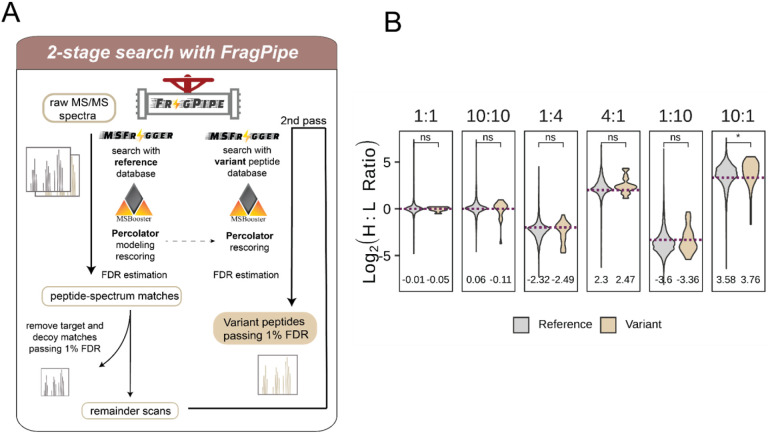
Cancer genomes are rife with genetic variants; one key outcome of this variation is gain-ofcysteine, which is the most frequently acquired amino acid due to missense variants in COSMIC. Acquired cysteines are both driver mutations and sites targeted by precision therapies. However, despite their ubiquity, nearly all acquired cysteines remain uncharacterized. Here, we pair cysteine chemoproteomics-a technique that enables proteome-wide pinpointing of functional, redox sensitive, and potentially druggable residues-with genomics to reveal the hidden landscape of cysteine acquisition. For both cancer and healthy genomes, we find that cysteine acquisition is a ubiquitous consequence of genetic variation that is further elevated in the context of decreased DNA repair. Our chemoproteogenomics platform integrates chemoproteomic, whole exome, and RNA-seq data, with a customized 2-stage false discovery rate (FDR) error controlled proteomic search, further enhanced with a user-friendly FragPipe interface. Integration of CADD predictions of deleteriousness revealed marked enrichment for likely damaging variants that result in acquisition of cysteine. By deploying chemoproteogenomics across eleven cell lines, we identify 116 gain-of-cysteines, of which 10 were liganded by electrophilic druglike molecules. Reference cysteines proximal to missense variants were also found to be pervasive, 791 in total, supporting heretofore untapped opportunities for proteoform-specific chemical probe development campaigns. As chemoproteogenomics is further distinguished by sample-matched combinatorial variant databases and compatible with redox proteomics and small molecule screening, we expect widespread utility in guiding proteoform-specific biology and therapeutic discovery.


Conflict of interest statement

Conflicts of Interest The authors declare no financial or commercial conflict of interest.

Figures

Figure 1.
Figure 1.. Acquired cysteines are prevalent across cancer genomes, particularly for high missense burden cell lines.
A) The full scope of acquired cysteines in the COSMIC Cell Lines Project (COSMICCLP, cancer.sanger.ac.uk/cell_lines) (v96), and dbSNP (4–23-18) were analyzed. B) 1,020 cell lines stratified by number of gained cysteines and total missense mutations; color indicates cancer type for top 15 highest missense count cell lines. C) Top 15 cell lines with highest missense burden from panel B; linear regression and 95% confidence interval shaded in gray. D) Net missense mutations (gained-lost) from COSMIC-CLP (v96) and common SNPs (dbSNP 4–23-18). E) Overlap of genes with acquired cysteines in top 15 subset from panel B with Census genes and targets of FDA approved drugs. F) Panel of cell lines used in this study with MMR status (dMMR= deficient mismatch repair, pMMR=proficient mismatch repair). Data found in Table S1.
Figure 2.
Figure 2.. dMMR cell lines are enriched for rare, predicted deleterious gain-of-cysteine mutations.
A) Sequencing portion of the ‘chemoproteogenomic’ workflow to identify chemoproteomic detected variants–extracted genomic DNA or RNA from cell lines undergo sequencing followed by variant calling using Platypus (v0.8.1) and GATK-Haplotype Caller (v4.1.8.1) for RNA and exomes respectively and predicted missense changes were computed. B) Total numbers of missense mutations identified from either RNAseq or WE-seq; stripe vs solid denotes common and rare variants, red text indicate dMMR cell lines. C) Net amino acid changes for all cell lines combined. D) Totals of gained and lost cysteine in each cell line separated by rare and common variants, dashed line indicates dMMR cell lines. E) Scheme of CADD score analysis for two dMMR and non-dMMR cell lines. F) Distribution of CADD scores for indicated variant grouping; statistical significance was calculated using Mann-Whitney U test, **** p < 0.0001. G) Empirical cumulative distributions (ECDF) were computed for CADD scores with indicated grouping; statistical significance was calculated using two-sample Kolmogorov-Smirnov test, **** p < 0.0001. H) CADD score distributions for cysteine gained amino acid indicated separated by grouping; statistical significance between gained Cys values was calculated using Mann-Whitney U test, **** p < 0.0001. I) Proportion of variants belonging to the indicated sites; AS/BS = in or near active site/binding site as annotated by UniProtKB or Phosphosite; statistical significant calculated using two-sample test of proportions, *** p < 0.001, **** p < 0.0001, ns p > 0.05. J) Amino acid changes at protein methylation sites as identified by Phosphosite. Data found in Table S2.
Figure 3.
Figure 3.. Variant peptide identification implementing an MSFragger-search pipeline
A) 2-stage MSFragger-enabled variant searches–variant databases are generated from non-redundant reference protein sequences that are in-silico mutated to incorporate sequencing-derived missense variants followed by 2-stage MSFragger/PeptideProphet search to identify confident variant-containing peptides. First, raw spectra are searched against a normal reference protein database, confidently matched spectra (passing 1% FDR) are removed and remainder spectra are searched with a variant tryptic database. B) Chemoproteomics workflow to validate heavy and light biotin. HEK293T cell lysates were labeled with pan-reactive iodoacetamide alkyne (IAA) followed by ‘click’ conjugation onto heavy or light biotin azide enrichment handles in known ratios. Following neutravidin enrichment, samples are digested and subjected to MS/MS analysis. C) Heavy to light ratios (H:L) from triplicate datasets comparing identifications from reference and variant searches; mean ratio value indicated, dashed lines indicate ground-truth log2 ratio, statistical significance was calculated using Mann-Whitney U test, ** p < 0.01, ns p > 0.05. D) Retention time difference for heavy and light identified peptides for reference and variant-searches; mean value indicated, statistical significance was calculated using Mann-Whitney U test, ns p > 0.05. Data found in Table S3.
Figure 4.
Figure 4.. Variant peptide identification on tumor cell lines
A) Cell lysates were labeled with pan-reactive iodoacetamide alkyne (IAA) followed by ‘click’ conjugation onto biotin azide enrichment. Samples were prepared and acquired using our SP3-FAIMS chemoproteomic platform,, using single pot solid phase sample preparation (SP3) sample cleanup, neutravidin enrichment, sequence specific proteolysis, and LC-MS/MS analysis with field asymmetric ion mobility (FAIMS) device. Experimental spectra are searched using the custom fasta for variant identification. Sample set includes both reanalysis of previously reported datasets from Yan et al. (Molt-4, Jurkat, Hec-1B, HCT-15, H661, and H2122 cell line) with newly acquired datasets (H1437, H358, Caco-2, Mia-PaCa-2 and MeWo cell lines). B) Non-synonymous changes are incorporated into reference protein sequences and combinations of variants are generated for proteins with less than 25 variant sites to make customized fasta databases. Details in methods. C) Total numbers of unique missense variants identified from either RNA-seq or WE-seq or both after using 2-stage MSFragger search and philosopher validation from duplicate datasets; stripe vs solid denotes common and rare variants, red text indicate dMMR cell lines Indicated is sequencing source and type of variant. D) Overlap of identified cysteines from variant searches with cysteines in CysDB database. E) Net amino acid changes for all cell lines combined F) Example of cysteies identified from loss of R/K peptides G) Examples of multi-mapping variant sites. H) Crystal structure of CTCF indicating detected Cys320 (yellow) and DNA-binding site (PDB: 5T0U). I) Crystal structure of HMGB1 indicating detected Cys110 and nearby Cys106 (yellow) (PDB: 6CIL). J) Variants identified in or near active and binding sites with CADD score, common/rare, cell line dMMR/pMMR annotations. K) Re-analysis of SP3-Rox oxidation state data in Jurkat cells. Data found in Table S4.
Figure 5.
Figure 5.. Comparison of variants identified from cysteine enrichment and bulk proteomics
A) Workflow for high-pH fractionation of lysates. Cell lysates are treated with DTT and iodoacetamide followed by digestion, high-pH fractionation, and LC-MS/MS analysis. Triplicate high-pH sets for HCT-15 and Molt-4 cells were used. B) Total numbers of unique missense variants identified from either RNA-seq or WE-seq or both after using 2-stage MSFragger search of high-pH datasets. C) Overlap of cysteine-containing peptide variants identified from bulk fractionation and cysteine enrichment datasets. D) Fold enrichment of amino acids as a ratio of the net amino acid frequency (gain minus loss) to the amino acid frequency in all missense-containing proteins detected in high-pH and cys-enriched datasets. E) DE-seq normalized transcript counts for all RNA variants ‘All’, variants detected from cys-enrichment ‘C’, and variants detected from high-pH fractionation ‘H’ in HCT-15 cells. F) Label free quantitation (LFQ) intensities for proteins matched to all RNA variants ‘All’, variants detected from cys-enrichment ‘C’, and variants detected from high-pH fractionation ‘H’ in HCT-15 cells. G) Variant allele frequencies (VAF) (total reads/total coverage per site) for RNA-seq variants called in HCT-15 and Molt-4 cells. E-G statistical significance was calculated using Mann-Whitney U test, **** p < 0.0001, ns p > 0.05. H) Peptide lengths of reference and variant peptides identified in dataset types. I) High-pH detected variants stratified by CADD score and ClinVar clinical significance. Data found in Table S5.
Figure 6.
Figure 6.. Assessing ligandability of variant proximal cysteines and gain-of-cysteines.
A) Schematic of activity-based screening of Cys reactive compounds; cell lysates are labeled with compound or DMSO followed by chase with IAA and ‘click’ conjugation to heavy or light biotin click conjugation to our isotopically differentiated heavy and light biotin-azide reagents, tryptic digest, LC-MS/MS acquisition, and MSFragger analysis. B) Chloroacetamide compound library. C) Total quantified variants and total ligandable variants (Log2 Ratio > 2) identified stratified by cell line (KB02 data) or compound (HCT-15 cell line). D) Correlation of high-confidence variant containing and reference cysteine ratio values from KB02 data. E) Correlation of high-confidence variant containing and reference cysteine ratio values from SO compound data. F) Log2 heavy to light ratio values for variant containing and reference cysteine peptides. G) Subset of gain of cysteine peptide variant log2 ratios. H) Crystal structure of HLA-B*08:01 protein liganded Cys125, disulfide Cys188, and binding site residue Y183 as well as variant sites V127 and S123 (PDB: 3X13). Data provided in Table S6.
Figure 7.
Figure 7.. Expanding HLA cysteine peptide coverage and gel-based ABPP of HLA covalent labeling.
A) Schematic of highly variable HLA binding pocket containing cysteine with bound peptide. B) Coverage of HLA cysteines from this study and in CysDB; color indicates HLA type or multi-mapped cysteines. C) Crystal structure of HLA-B 14:02 (PDB: 3BXN) with highlighted Cys67 and Arg P2 position of bound peptide; alignments of Cys91 regions of three HLA-B alleles. D) Workflow to visualize HLA cysteine labeling; first cells were harvested and treated with IAA followed by lysis, FLAG immunoprecipitation, and click onto rhodamine-azide. E) Cys-dependent cell surface labeling of HLA-B alleles with IAA, band indicated with red arrow and non-specific band represented with asterisk (representative of 2 two biological replicates). Data provided in Table S7.
Figure 8.
Figure 8.. 2-stage search implemented into FragPipe GUI with Percolator rescoring
A) 2-stage search incorporation into FragPipe GUI workflow. B) Heavy to light ratios (H:L) from triplicate datasets comparing identifications from reference and variant searches; mean ratio value indicated, dashed lines indicate ground-truth log2 ratio, statistical significance was calculated using Mann-Whitney U test, * p < 0.05, ** p < 0.01, ns p > 0.05. Data provided in Table S8.

Similar articles

References

    1. Auton A. et al. A global reference for human genetic variation. Nature 526, 68–74 (2015). - PMC - PubMed
    1. Shen H. et al. Comprehensive Characterization of Human Genome Variation by High Coverage Whole-Genome Sequencing of Forty Four Caucasians. PLOS ONE 8, e59494 (2013). - PMC - PubMed
    1. Vogelstein B. et al. Cancer Genome Landscapes. Science 339, 1546–1558 (2013). - PMC - PubMed
    1. Forbes S. A. et al. COSMIC: exploring the world’s knowledge of somatic mutations in human cancer. Nucleic Acids Res. 43, D805–D811 (2015). - PMC - PubMed
    1. Bailey M. H. et al. Comprehensive Characterization of Cancer Driver Genes and Mutations. Cell 173, 371–385.e18 (2018). - PMC - PubMed

Publication types