[Preprint]. 2023 Aug 16:2023.08.16.553575.
doi: 10.1101/2023.08.16.553575.

Phosphorylation of a Cleaved Tau Proteoform at a Single Residue Inhibits Binding to the E3 Ubiquitin Ligase, CHIP

Affiliations

Phosphorylation of a Cleaved Tau Proteoform at a Single Residue Inhibits Binding to the E3 Ubiquitin Ligase, CHIP

Cory M Nadel et al. bioRxiv. .

Update in

Abstract

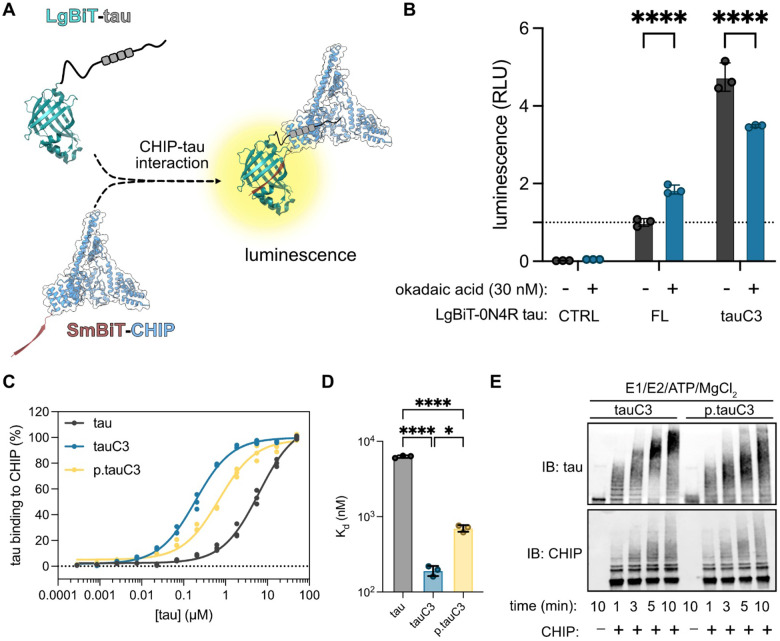
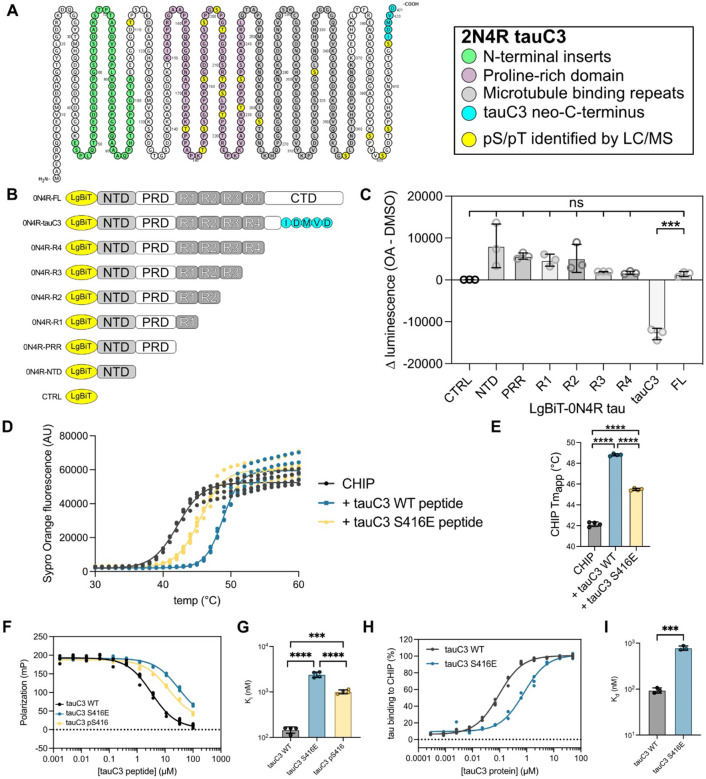
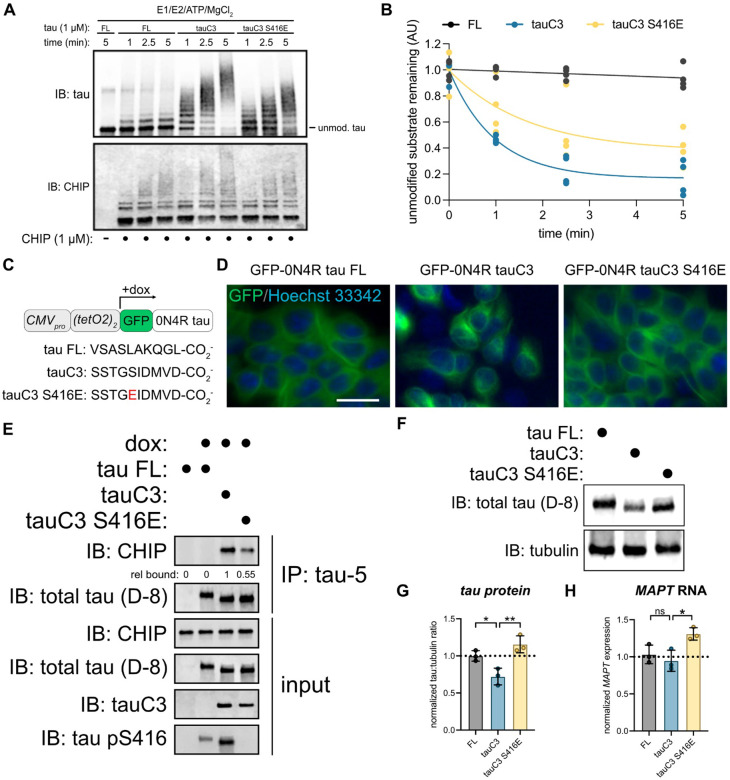
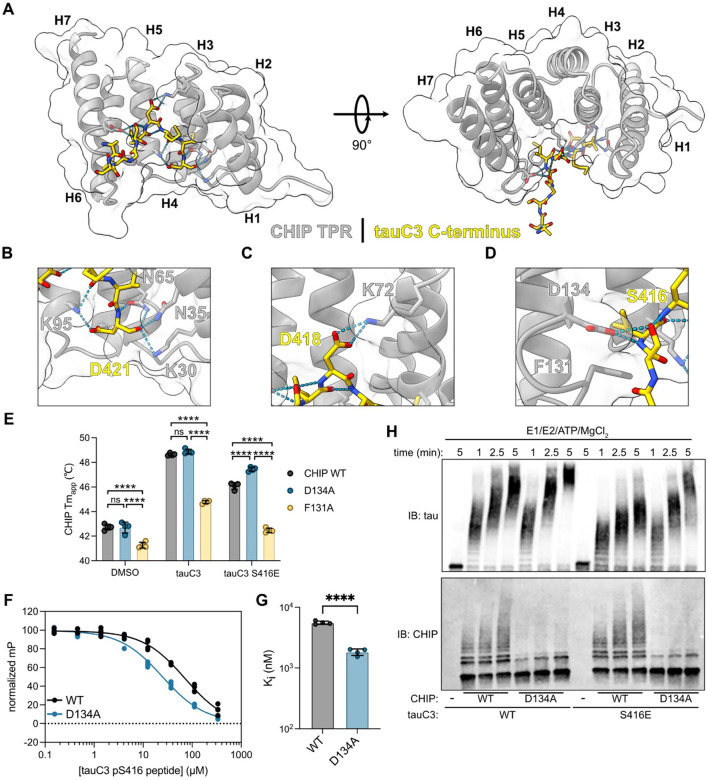
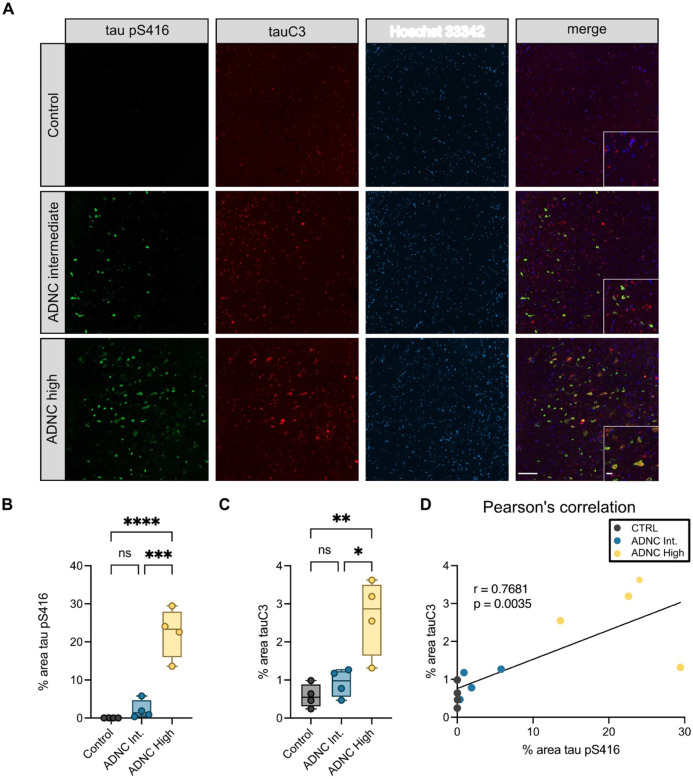
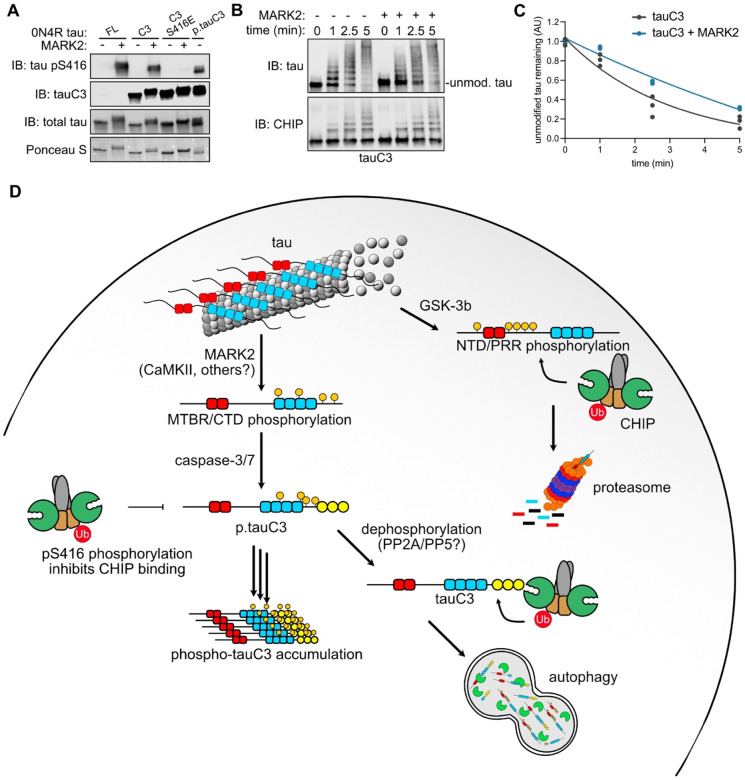
Microtubule-associated protein tau (MAPT/tau) accumulates in a family of neurodegenerative diseases, including Alzheimer's disease (AD). In disease, tau is aberrantly modified by post-translational modifications (PTMs), including hyper-phosphorylation. However, it is often unclear which of these PTMs contribute to tau's accumulation or what mechanisms might be involved. To explore these questions, we focused on a cleaved proteoform of tau (tauC3), which selectively accumulates in AD and was recently shown to be degraded by its direct binding to the E3 ubiquitin ligase, CHIP. Here, we find that phosphorylation of tauC3 at a single residue, pS416, is sufficient to block its interaction with CHIP. A co-crystal structure of CHIP bound to the C-terminus of tauC3 revealed the mechanism of this clash and allowed design of a mutation (CHIPD134A) that partially restores binding and turnover of pS416 tauC3. We find that pS416 is produced by the known AD-associated kinase, MARK2/Par-1b, providing a potential link to disease. In further support of this idea, an antibody against pS416 co-localizes with tauC3 in degenerative neurons within the hippocampus of AD patients. Together, these studies suggest a discrete molecular mechanism for how phosphorylation at a specific site contributes to accumulation of an important tau proteoform.


Conflict of interest statement

Competing Interests The authors have no conflicts to report.

Figures

Fig. 1
Fig. 1. Phosphorylation of tauC3 inhibits interaction with CHIP.
(A) Cartoon schematic of the live-cell NanoBiT assay for measuring CHIP-tau PPIs (NanoBiT PDB = 7SNX; CHIP PDB = 2C2L). (B) Results of NanoBiT assays for CHIP interactions with tau proteoforms following treatment with okadaic acid (30 nM, 18 hours) or DMSO control. Luminescence normalized to CHIP binding to FL 0N4R tau treated with vehicle (dashed line). Statistical significance was determined by two-way ANOVA with Bonferroni’s post-hoc analysis (****p<0.0001, n = 3). (C) Tau proteoforms binding to immobilized CHIP measured by ELISA. Assay was performed in triplicate and normalized to maximum absorbance @ 450 nM. (D) Dissociation constants derived from (C). Statistical significance was determined by one-way ANOVA with Tukey’s post-hoc analysis (*p<0.05, ****p<0.0001, n = 3). (E) In vitro ubiquitination of tau proteoforms by CHIP. Samples were collected at the denoted timepoints, quenched in SDS-PAGE loading buffer, and analyzed by western blot.
Fig 2
Fig 2. Phosphorylation of tauC3 Ser416 is sufficient to inhibit interaction with CHIP.
(A) Locations of serine and threonine phosphorylation sites identified on p.tauC3 by LC/MS-MS. Residue numbering is derived from 2N4R tau, while identified pS/pT sites are shown in yellow. (B) Cartoon depicting constructs used for mapping of inhibitory phosphorylation sites by NanoBiT live cell assays. (C) NanoBiT live cell assay for CHIP interactions with truncated tau constructs following treatment with okadaic acid (30 nM, 18 hours) or DMSO control. Data is shown as the difference between okadaic acid treated samples and vehicle control. Statistical significance was determined by one-way ANOVA with Tukey’s post-hoc analysis (ns = not significant, ***p<0.001, n = 3). (D) DSF curves for CHIP incubated with DMSO control or tauC3 peptides. Assay was performed in quadruplicate and melt curves were fit with a Boltzmann sigmoid. (E) Apparent melting temperatures (Tmapp) of CHIP in the absence or presence of 10-mer tau peptides as derived from (D). Statistical significance was determined by one-way ANOVA with Tukey’s post-hoc analysis (****p<0.0001, n = 4). (F) Competition FP experiment showing displacement of fluorescent tracer from the CHIP TPR domain by various 10-mer tau peptides. Samples were performed in quadruplicate. (G) Inhibition constants for various tau peptides derived from (F). Statistical significance was determined by one-way ANOVA with Tukey’s post-hoc analysis (***p<0.001, ****p<0.0001, n = 4). (H) Tau proteoforms binding to immobilized CHIP, as measured by ELISA. Assay was performed in triplicate and normalized to maximum absorbance @ 450 nM. (I) Dissociation constants derived from (H). Statistical significance was determined by unpaired student’s t-test (***p<0.001, n = 3).
Fig 3
Fig 3. TauC3 Ser416 phosphorylation regulates CHIP-dependent tau homeostasis.
(A) In vitro ubiquitination of tau proteoforms by CHIP. Samples were collected at the denoted timepoints, quenched in SDS-PAGE loading buffer, and analyzed by western blot. (B) Quantification of unmodified tau remaining following in vitro ubiquitination of varying tau proteoforms by CHIP. Unmodified tau remaining was analyzed by densitometry, normalized to 0-minute time point, and curves were fit using one-phase exponential decay (n = 3). (C) Cartoon schematic depicting promoter architecture and varying C-terminal sequences for HEK293 FlpIn T-Rex cells expressing doxycycline inducible GFP-tau proteoforms. (D) Representative fluorescence micrographs for GFP-tau cells. Images show tau species associated with microtubules (green, false color), while nuclei are stained with Hoechst 33342 (blue, false color). Scale bar = 30 μM. (E) Co-immunoprecipitation assay following IP of varying tau species from cells. Whole cell lysate (input) was used for loading controls, and co-immunoprecipitated CHIP was analyzed by western blot. Relative CHIP bound was determined by densitometry and normalized to tauC3. (F) Representative western blot showing differing abundance of various tau proteoforms in HEK293 FlpIn T-Rex cells. (G) Quantification of tau protein abundance taken from three independent experiments. Tau:tubulin ratio was determined by densitometry and normalized to full-length tau. Statistical significance was determined by one-way ANOVA with Tukey’s post-hoc analysis (*p<0.05, **p<0.01, n = 3). (H) Quantification of MAPT mRNA from three independent experiments. MAPT mRNA was normalized to GAPDH and shown relative to full-length tau. Statistical significance was determined by one-way ANOVA with Tukey’s post-hoc analysis (ns = not significant, *p<0.05, n = 3).
Fig 4
Fig 4. Structural basis for CHIP binding to tauC3 and inhibition by phosphorylation.
(A) 1.8 Å crystal structure of the CHIP TPR domain bound to a 10-mer tauC3 C-terminal peptide. The CHIP TPR domain is depicted in gray, while the tauC3 peptide is in yellow. Helices 1-7 of the CHIP TPR domain are numbered H1-H7. (B) Close-up view of interactions of tauC3 D421 and C-terminus with CHIP carboxylate-clamp residues K95, N65, N35, and K30. (C) Close-up view of interaction of tauC3 D418 with CHIP carboxylate-clamp residue K72. (D) Close-up view of interactions of tauC3 S416 with CHIP carboxylate-clamp residue D134 and proximity to CHIP F131. (E) Apparent melting temperatures (Tmapp) of CHIP WT or mutants in the absence or presence of 10-mer tau peptides as derived from. Statistical significance was determined by two-way ANOVA with Bonferroni’s post-hoc analysis (ns = not significant, ****p<0.0001, n = 4). (F) Competition FP experiment showing displacement of fluorescent tracer from WT or D134A CHIP TPR domain by tauC3 pS416 10-mer peptide. Samples were performed in quadruplicate and normalized to DMSO control. (G) Inhibition constants for tauC3 pS416 peptide for WT or D134A CHIP as derived from (F). Statistical significance was determined by unpaired student’s t-test (****p<0.0001, n = 4). (H) In vitro ubiquitination of tau proteoforms by WT or D134A CHIP. Samples were collected at the denoted timepoints, quenched in SDS-PAGE loading buffer, and analyzed by western blot.
Fig 5
Fig 5. TauC3 co-accumulates with Serine 416 phosphorylation in Alzheimer’s disease patient brains.
(A) Representative micrographs of immunofluorescence staining of tau pS416 (green), tauC3 (red), and nuclei (Hoechst 33342, blue) from the hippocampal CA1/CA2 region of human patient brains across increasing spectrum of Alzheimer’s Disease Neuropathological Change (ADNC) scoring. Scale bars = 50 μM; insets = 10 μM. (B) Quantification of tau pS416 staining across ADNC score. Analysis was performed on four patient samples for each score. Statistical significance was determined by one-way ANOVA with Tukey’s post-hoc analysis (ns = not significant, ***p<0.001, ****p<0.0001). (C) Quantification of tauC3 staining across ADNC score. Analysis was performed on four patient samples for each score. Statistical significance was determined by one-way ANOVA with Tukey’s post-hoc analysis (ns = not significant, ***p<0.001, ****p<0.0001). (D) Pearson’s analysis showing correlation of increasing tau pS416 and tauC3 across ADNC score.
Fig 6
Fig 6. MARK2 inhibits CHIP-dependent ubiquitination of tauC3 by phosphorylating serine 416.
(A) In vitro phosphorylation of varying tau proteoforms by MARK2. Varying tau species were incubated overnight with recombinant MARK2, and relative phosphorylation of Ser416 was quantified by western blot. Ponceau S was used as loading control. (B) In vitro ubiquitination of unmodified tauC3 or MARK2-phosphorylated tauC3 by CHIP. Samples were collected at the denoted timepoints, quenched in SDS-PAGE loading buffer, and analyzed by western blot. (C) Quantification of unmodified tau remaining in (C). Samples were normalized to 0-minute time point and curves were fit using one-phase exponential decay (n = 3). (D) Cartoon depicting the role of tau PTMs on interactions with CHIP and shuttling to various degradation pathways.

References

    1. Orr M. E., Sullivan A. C. & Frost B. A Brief Overview of Tauopathy: Causes, Consequences, and Therapeutic Strategies. Trends in pharmacological sciences 38, 637–648 (2017). 10.1016/j.tips.2017.03.011 - DOI - PMC - PubMed
    1. Goedert M. Tau filaments in neurodegenerative diseases. FEBS Lett 592, 2383–2391 (2018). 10.1002/1873-3468.13108 - DOI - PubMed
    1. Garcia M. L. & Cleveland D. W. Going new places using an old MAP: tau, microtubules and human neurodegenerative disease. Curr Opin Cell Biol 13, 41–48 (2001). 10.1016/s0955-0674(00)00172-1 - DOI - PubMed
    1. Guo T., Noble W. & Hanger D. P. Roles of tau protein in health and disease. Acta Neuropathol 133, 665–704 (2017). 10.1007/s00401-017-1707-9 - DOI - PMC - PubMed
    1. Petrucelli L. et al. CHIP and Hsp70 regulate tau ubiquitination, degradation and aggregation. Hum Mol Genet 13, 703–714 (2004). - PubMed

Publication types